
Technical Analysis
BTC/USDT
US President Donald Trump said he found India’s offer to lower tariffs “too late” and that the country had increased its purchases of energy and military equipment from Russia. US Treasury Secretary Bessent emphasized that the Fed must remain independent, while also stating that he wanted Stephen Miran to be quickly appointed to the Fed Board of Governors; he also said that a national housing emergency could be declared to combat housing costs. Indian Prime Minister Modi and Russian President Putin held talks on bilateral relations and the Ukraine crisis. ECB Governing Council Member Isabel Schnabel said interest rates should be kept at the current level of 2%. Chinese Foreign Minister Wang Yi shared the results of the SCO Tianjin Summit and announced a development strategy for the next decade.
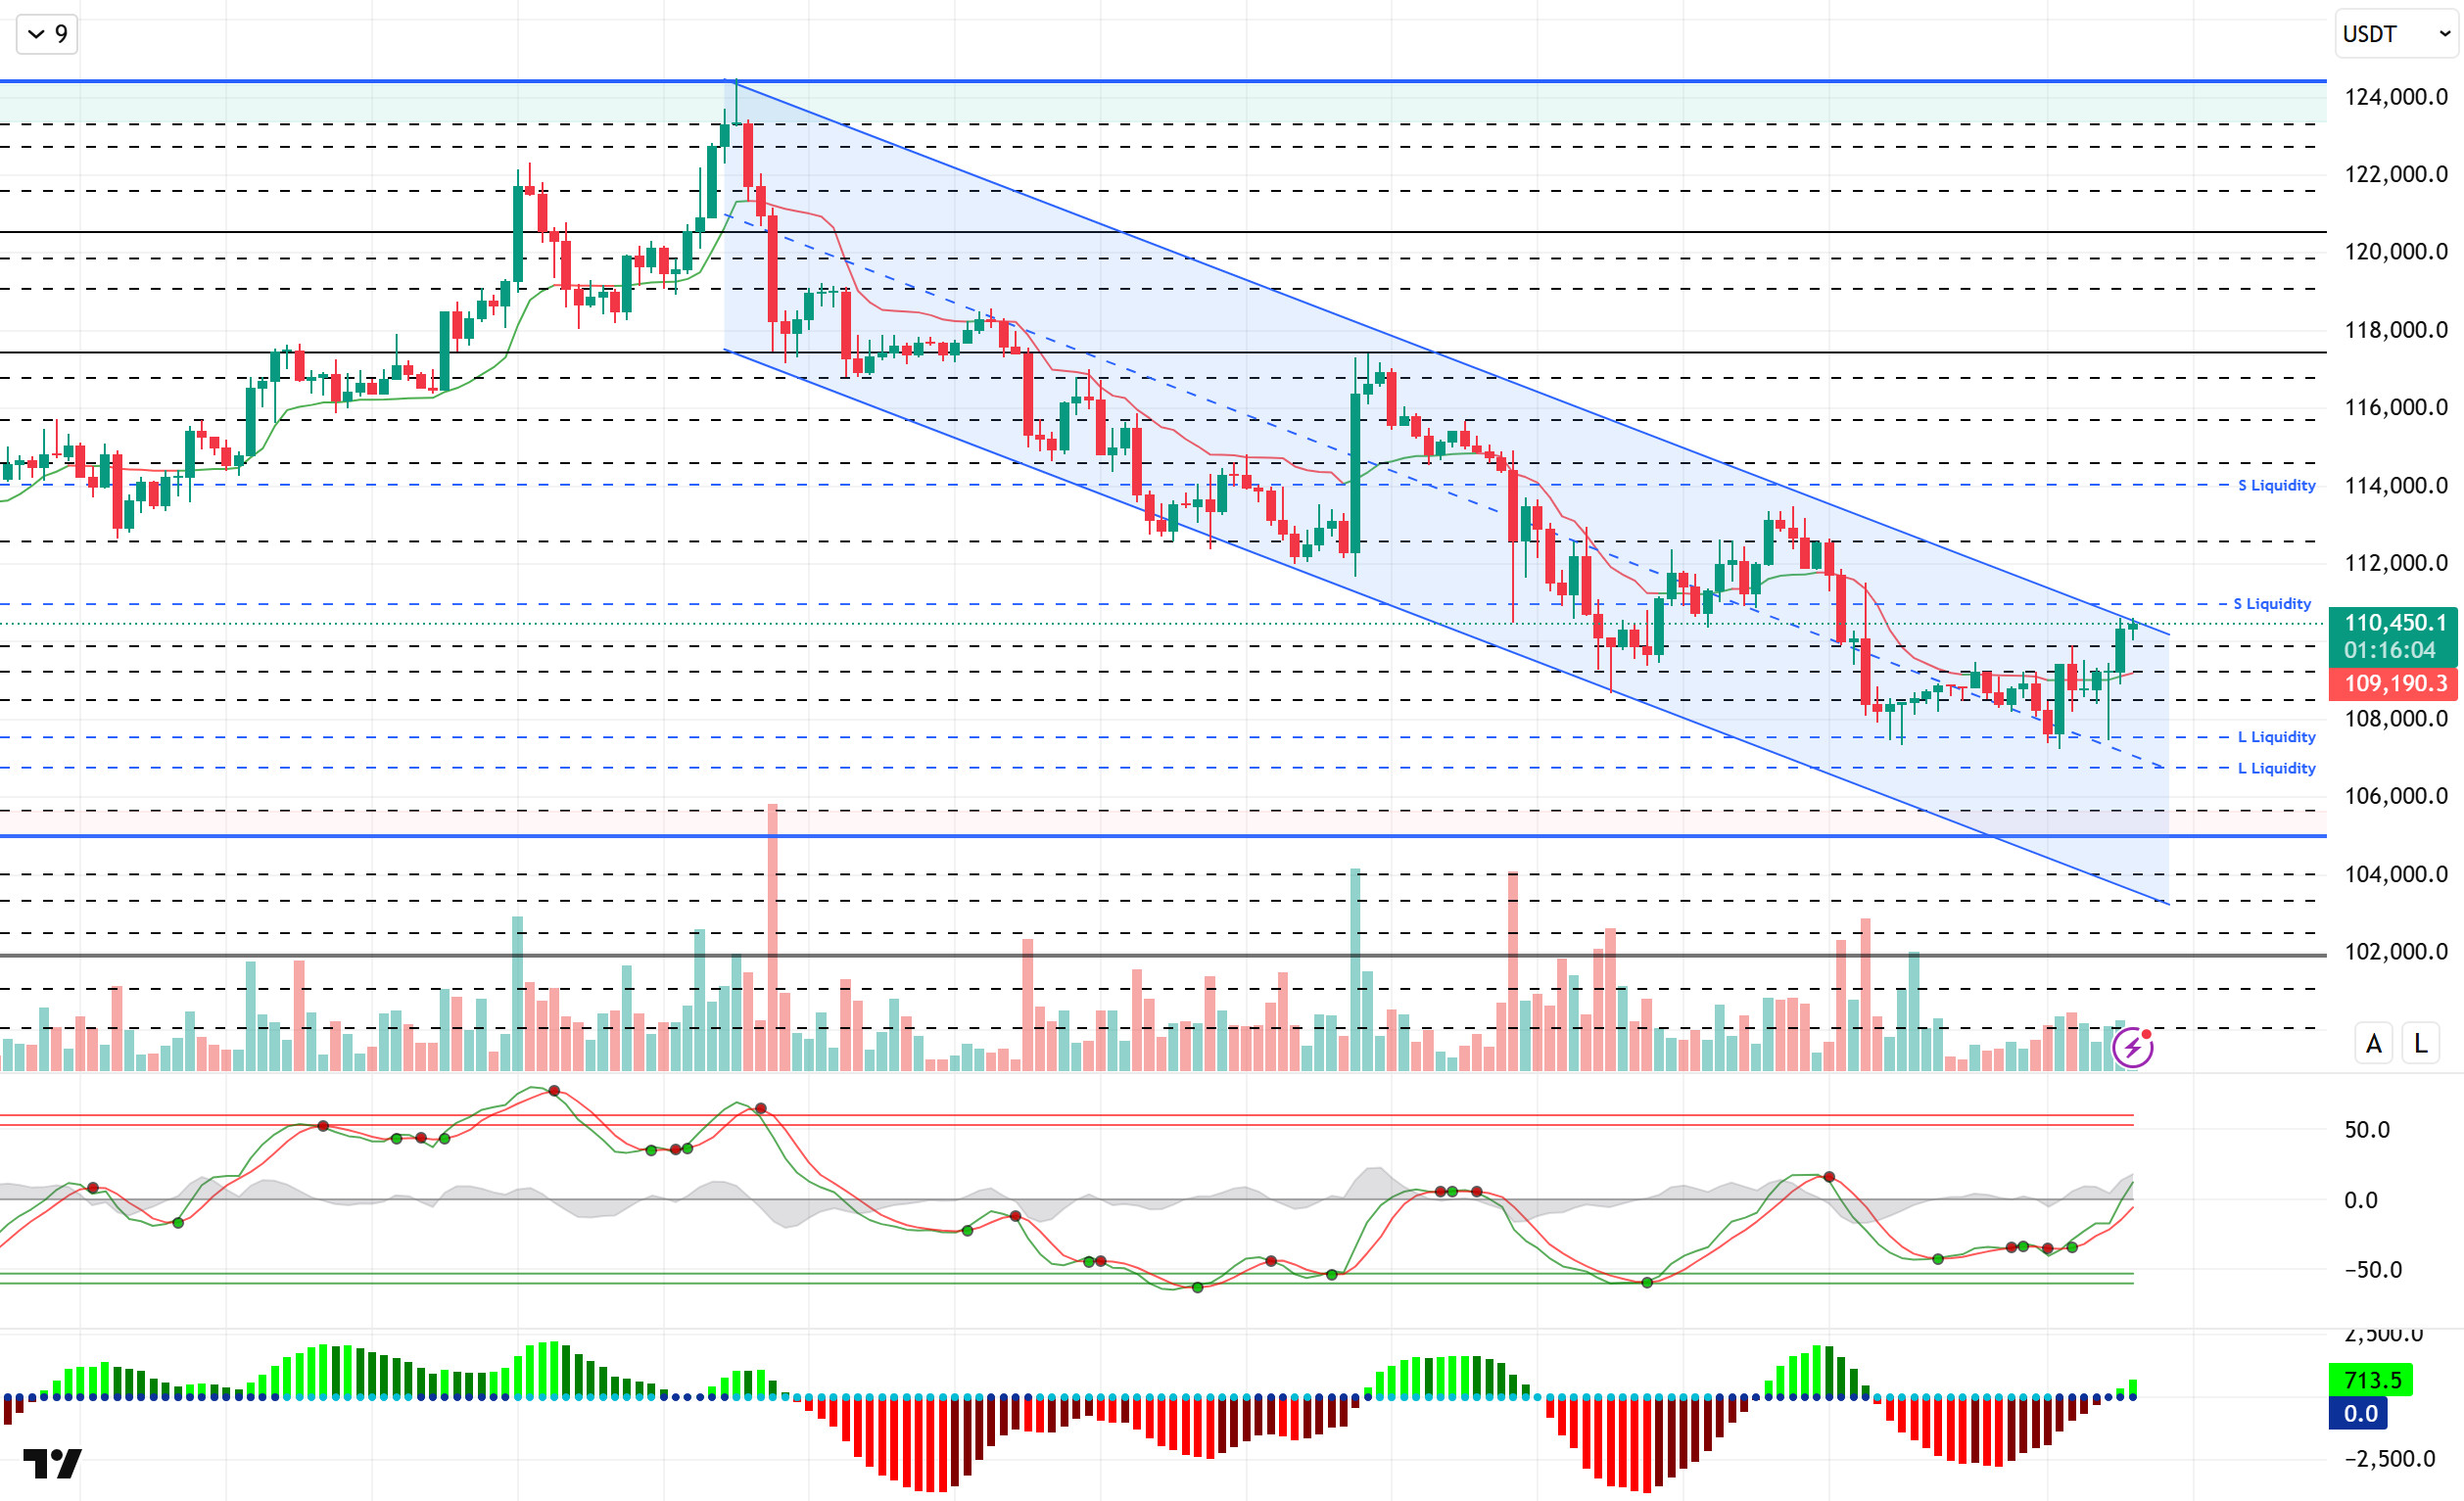
Looking at the technical picture, BTC, which continued to trade within a falling trend channel, hit the 107,400 level. The price then recorded a rapid recovery, rising above the 110,000 level and began to challenge the upper line of the falling trend.
Technical indicators moved towards the middle band of the channel, accompanied by a buy signal from the Wave Trend oscillator (WT). The Squeeze Momentum (SM) indicator’s histogram moved into positive territory, providing momentum support. The Kaufman moving average is currently below the price, moving at the 109,190 level.
Looking at liquidity data, we see that short-term sell-side transactions were heavily liquidated within the 109,000 – 110,000 band, while the next sell level recorded accumulation at the 114,000 level. Buying transactions, on the other hand, are gaining intensity in the 106,500 – 107,500 band.
In summary, the disappearance of the recent optimistic mood amid fundamental developments, coupled with discussions among Fed members about interest rate cuts and new task allocations, and the continued focus on tariffs, are emerging as factors exerting downward pressure on prices. Technically, the formation of a suitable ground for a new upward movement, supported by sell-side positions in liquidity data, could initiate a new upward trend for BTC following the bottoming movement. In this context, the re-emergence of catalysts in the market is expected to create a driving force on the price. In a potential upward movement, the 110,000 level stands out as a liquidity area, and we will follow the 112,000 level along with momentum. In a potential selling pressure, the 107,000 level stands out as a liquidity area.
Supports 108,500 – 107,400 – 105,000
Resistances 111,000 – 112,600 – 114,000
ETH/USDT
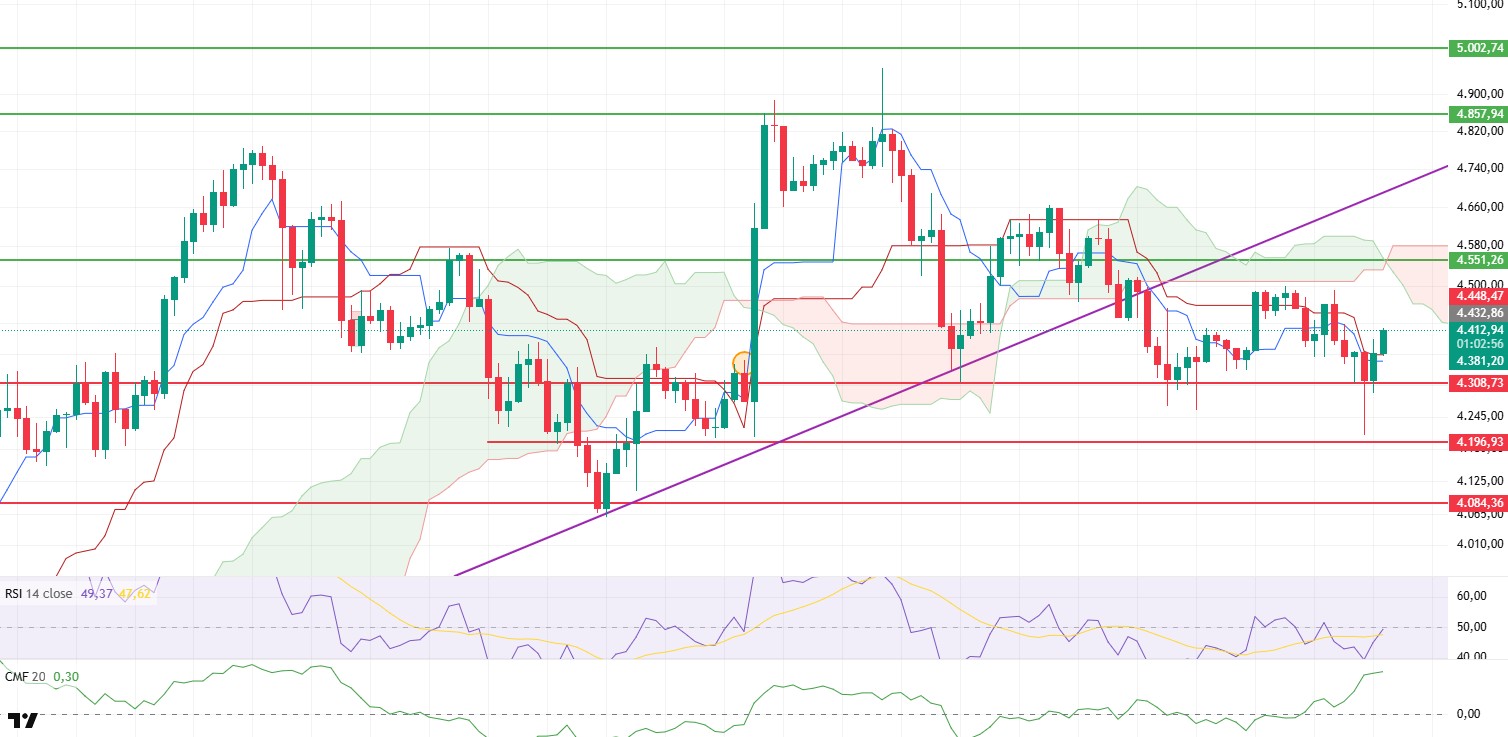
After losing the $4,302 level yesterday evening, the ETH price fell to the $4,200 level amid heavy selling pressure. However, strong buying from this area allowed the price to recover and rise above the $4,400 level, showing that buyers have taken control in the short term. Strong demand in the spot market, in particular, stands out as the key factor supporting this recovery.
The Cumulative Volume Delta (CVD) indicator reveals that buyers are aggressively active on the spot side and that trading volumes have risen significantly. The rising volume signals that market participants are viewing declines as buying opportunities and that short-term upside expectations are gaining strength. A similar picture emerges on the liquidity side. The upward movement of the Chaikin Money Flow (CMF) indicator in positive territory confirms that fresh capital continues to flow into the market and that the buyer side is gaining strength.
In the Ichimoku indicator, the price regaining both the kijun and tenkan levels and the tenkan level beginning to converge towards the kijun level technically supports the short-term positive outlook. However, the price remaining below the kumo cloud indicates that the main trend has not yet fully turned positive and that stronger confirmation is needed for the uptrend to become sustainable.
The Relative Strength Index (RSI) indicator reaching the 50 level above the MA line confirms that momentum is recovering and an upward trend is forming in the short term. This outlook reveals that buyers are increasing their influence in the market and that the price is maintaining its upward potential.
In the short term, maintaining stability above the $4,400 level could push the price towards the main resistance zone at $4,551. Closing below the $4,400 level, however, could weaken buyer momentum and cause the price to retreat back to the $4,200 level. Therefore, the price movement at the $4,400 level is a critical threshold for determining the short-term direction.
Top of Form
Below the Form
Support levels: 4,369 – 4,277 – 4,084
Resistance levels: 4,551 – 5,857 – 5,000
XRP/USDT
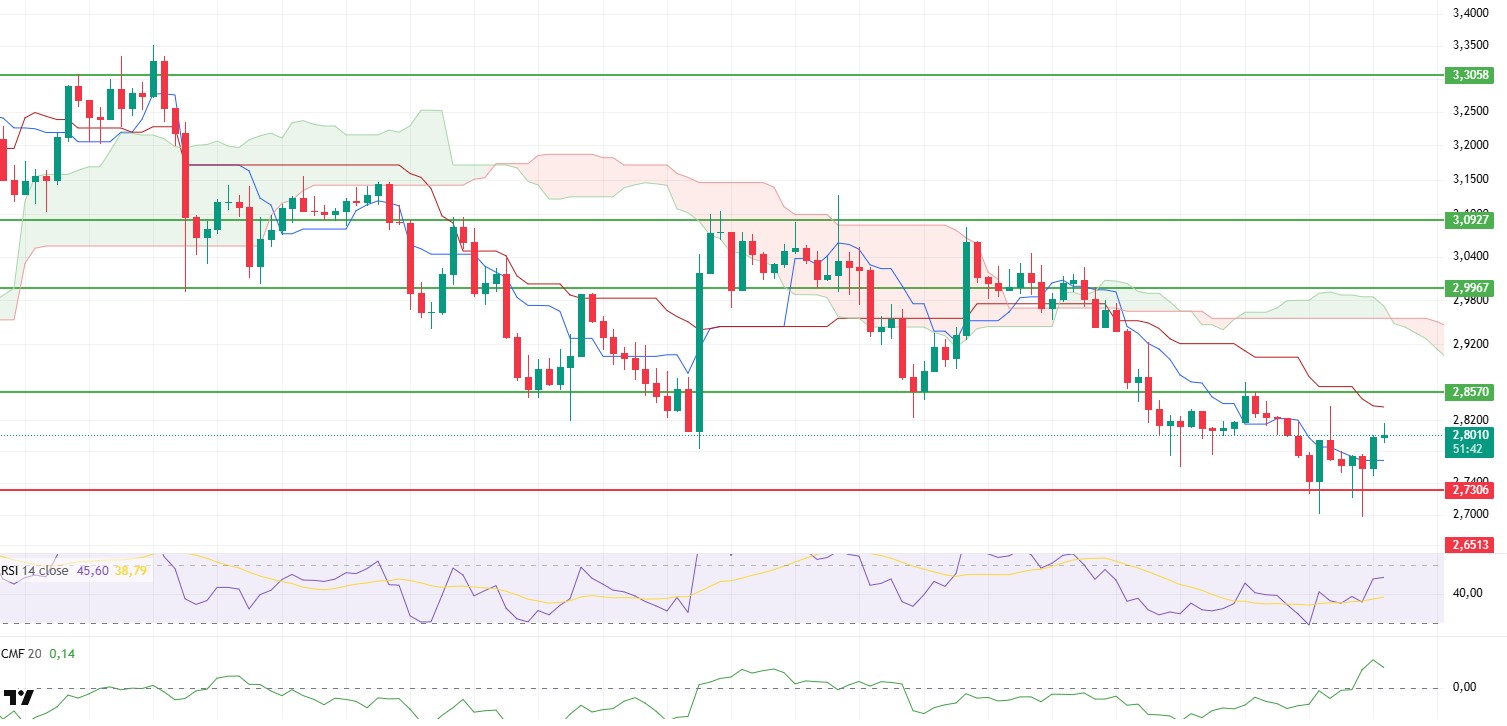
XRP had attempted to establish a base at the $2.70 level after losing critical support during the downtrend that began last Tuesday. During this process, buyers stepped in, regaining the $2.73 support level, and the price rose above the $2.80 level, signaling a short-term recovery. This movement indicates that selling pressure is beginning to weaken and that rebound buying is gaining strength.
In the Ichimoku indicator, the price rising above the Tenkan level positively impacts the technical outlook. Maintaining this level in the short term could support a rise towards the $2.85 resistance level. However, the continued position below the Kumo cloud indicates that the main trend has not yet fully turned positive, meaning more technical confirmation is needed for a strong upward move.
On the liquidity front, a significant improvement is noteworthy. The Chaikin Money Flow (CMF) indicator’s sharp upward movement into positive territory signals a strong influx of liquidity into the market and that buyers have regained control. The recovery is also evident on the momentum side. The Relative Strength Index (RSI), crossing above the MA line and approaching the 50 level, confirms that the upward movement is gaining strength in the short term.
In the short term, the $2.85 level stands out as the most critical resistance. A break above this level could trigger a stronger upward move toward the $2.99 level. Below, the $2.73 level is the most important support. Maintaining this level is critical for the recovery process to continue, while a possible break could push the price back to the $2.70 and below regions.
Support levels: 2.7306 – 2.6513 – 2.4730
Resistance levels: 2.8570 – 2.9967 – 3.0927
SOL/USDT
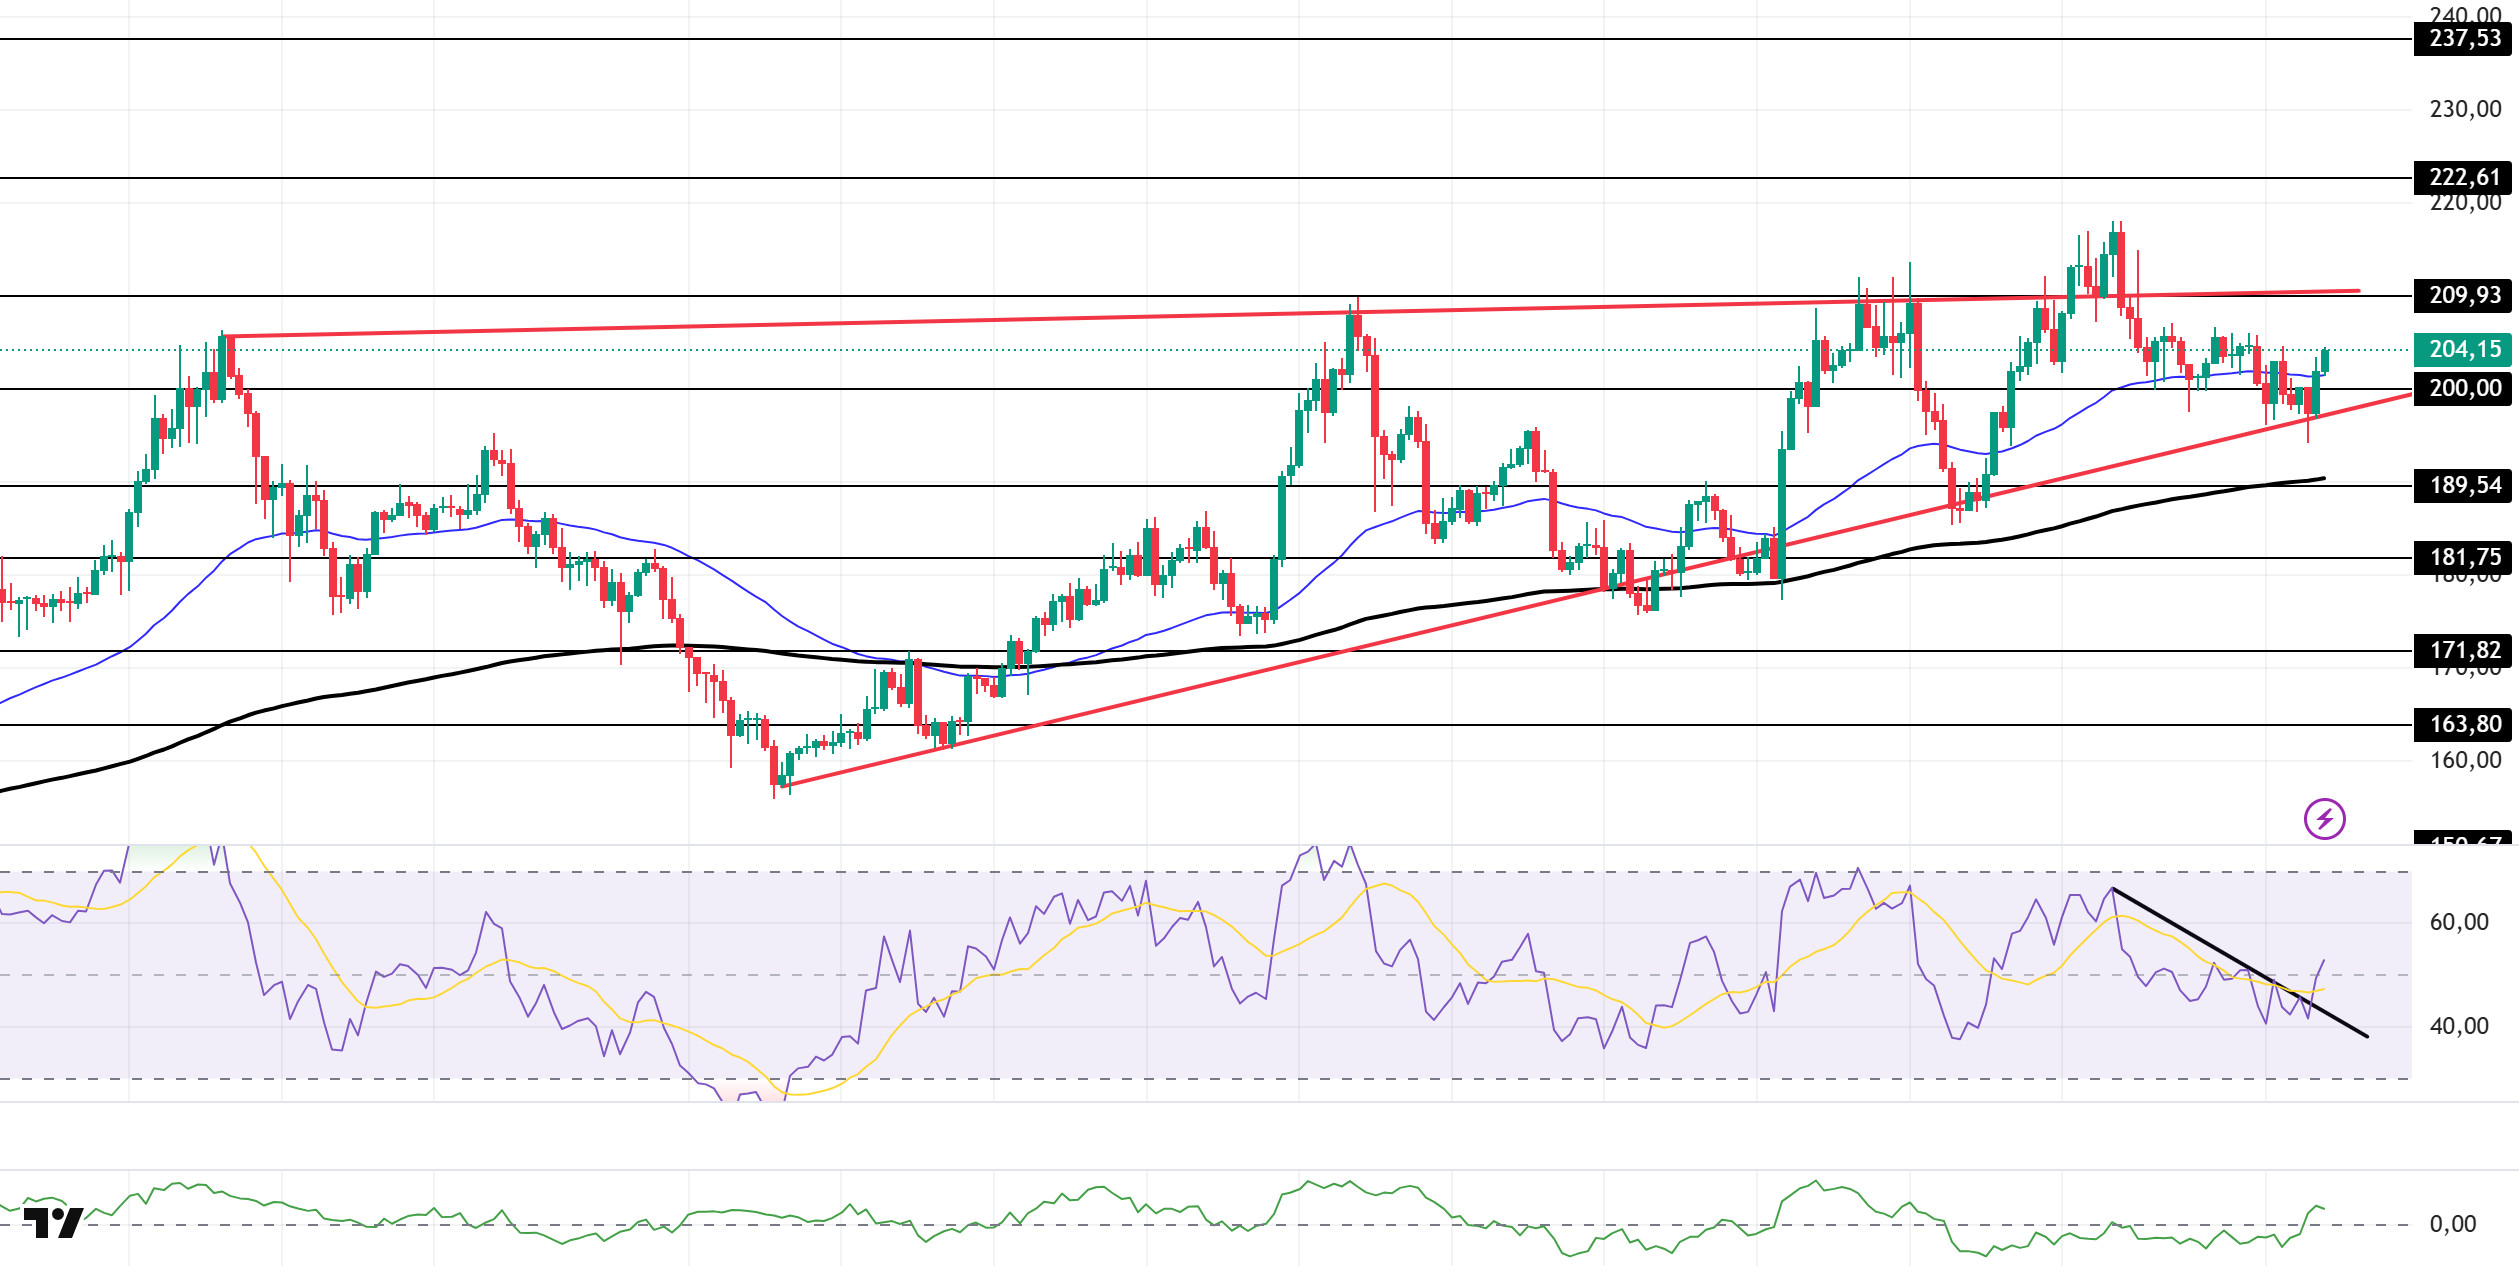
SOL price showed an upward trend. The asset continued to remain within the rising wedge formation that began on August 2. The price broke below the strong support level of $200.00, tested the base level of the formation as support, and then accelerated upward from there. Currently trading above the strong resistance level of $200.00 and the 50 EMA (Exponential Moving Average – Blue Line), the price could test the top of the pattern if it continues its upward movement. In the event of a pullback, the $189.54 level could be monitored.
On the 4-hour chart, the 50 EMA (Blue Line) remained above the 200 EMA (Black Line). This indicates that the medium-term upward trend may continue. At the same time, the price being above both moving averages shows us that the market is trending upward in the short term. The Chaikin Money Flow (CMF-20) has moved into positive territory. Furthermore, an increase in money inflows could push the CMF to the upper levels of the positive zone. The Relative Strength Index (RSI-14) has risen into positive territory. It also broke above the downward trend that began on August 29, signaling buying pressure. If an uptrend occurs due to macroeconomic data or positive news related to the Solana ecosystem, the $209.93 level stands out as a strong resistance point. If this level is broken upwards, the rise is expected to continue. If pullbacks occur due to developments in the opposite direction or profit-taking, the $189.54 level may be tested. A decline to these support levels could increase buying momentum, presenting a potential upside opportunity.
Supports: 200.00 – 189.54 – 181.75
Resistances: 209.93 – 222.61 – 237.53
DOGE/USDT
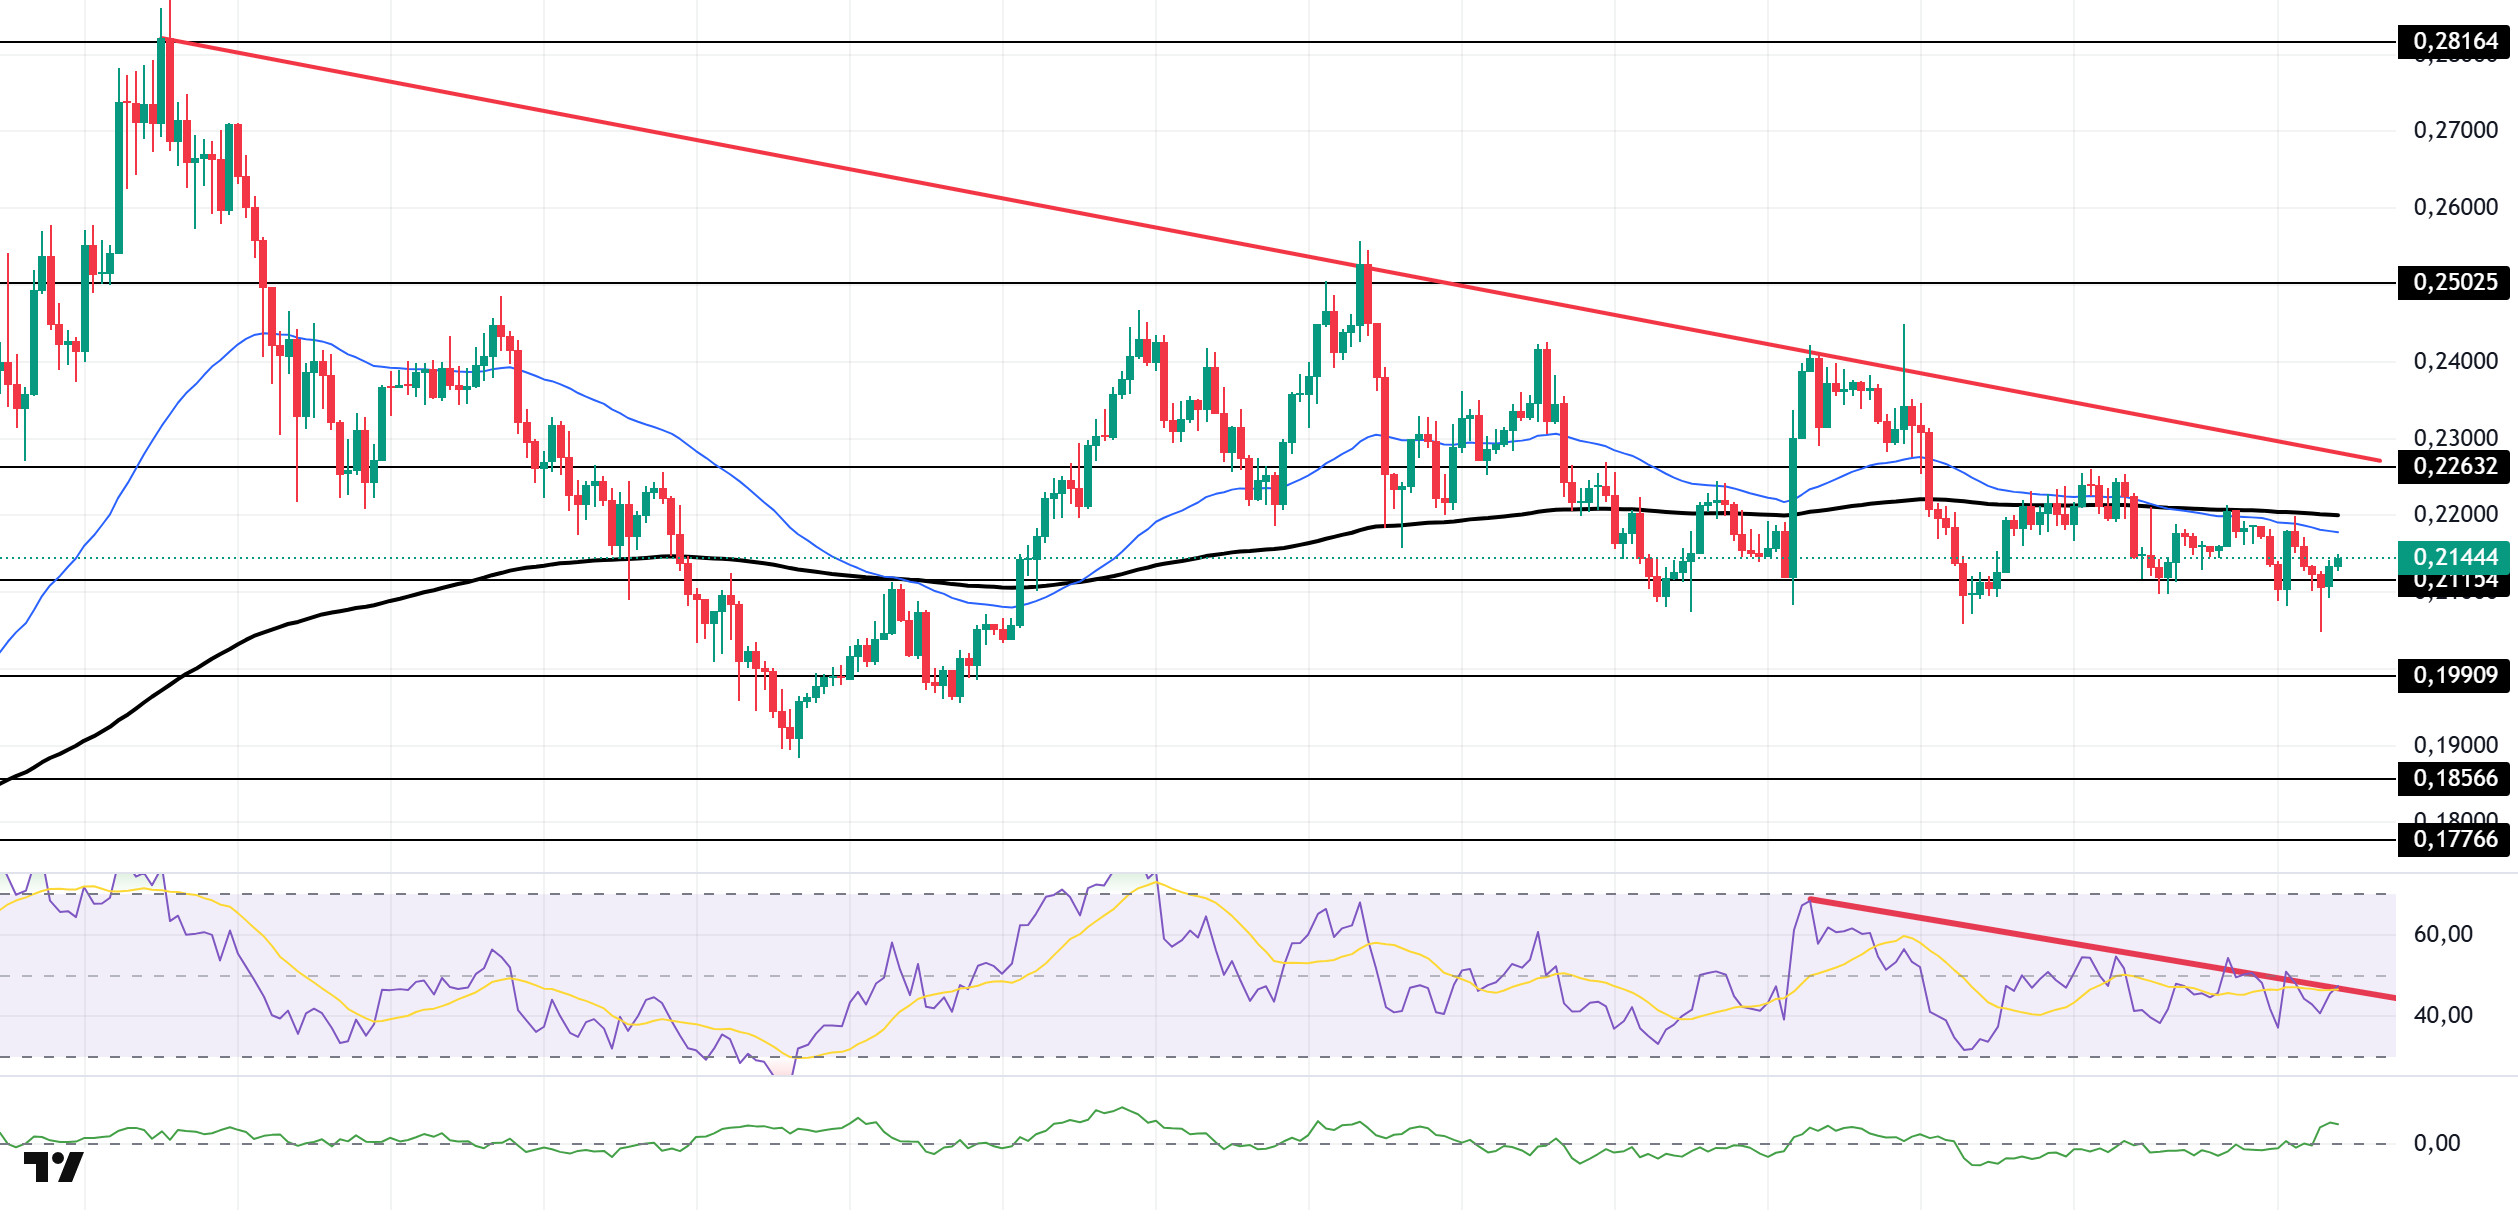
The DOGE price continues to move sideways. The asset remained below the downtrend that began on July 21. The price, which faced resistance from the 50 EMA (Exponential Moving Average – Blue Line) and 200 EMA (Black Line) moving averages, found support at the strong support level of $0.21154 and gained momentum. If the upward movement continues, the $0.22632 level should be monitored. In the event of a pullback, the $0.19909 level should be monitored.
On the 4-hour chart, the 50 EMA (Blue Line) continued to remain below the 200 EMA (Black Line). This indicates that a medium-term downward trend has begun. The price being below both moving averages also shows that the asset is in a downward trend in the short term. The Chaikin Money Flow (CMF-20) has moved into positive territory. Additionally, an increase in cash inflows could push the CMF to the upper levels of the positive zone. The Relative Strength Index (RSI-14) remains in the negative zone. It is currently testing the resistance level of the downward trend that began on August 22. A break above this level could lead to an increase. In the event of an uptrend driven by political developments, macroeconomic data, or positive news flow within the DOGE ecosystem, the $0.22632 level stands out as a strong resistance zone. Conversely, in the event of negative news flow, the $0.19909 level could be triggered. A decline to these levels could increase momentum and potentially initiate a new upward wave.
Supports: 0.21154 – 0.19909 – 0.18566
Resistances: 0.22632 – 0.25025 – 0.28164
TRX/USDT
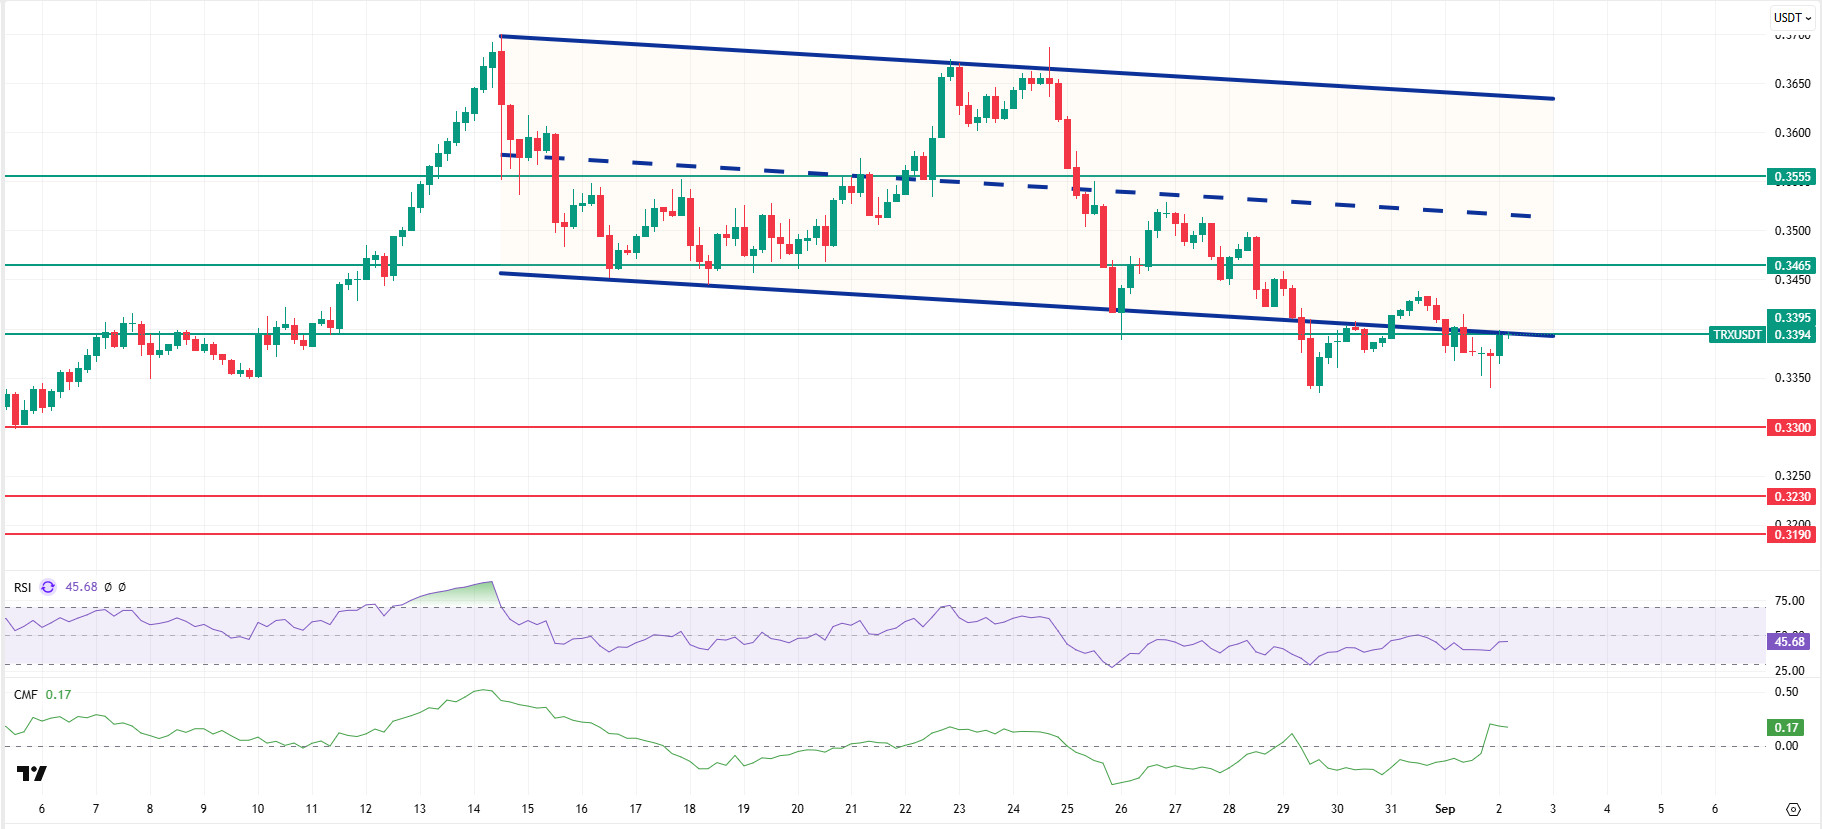
As of September 1, 2025, the total amount of TRX staked is 45,654,456,019, which is 48.23% of the circulating supply. Additionally, a total of 4,076,887 TRX was burned yesterday, permanently removing 161,175 TRX from the circulating supply. This contributes to reducing inflationary pressure on the Tron network.
Technically speaking, despite the decline experienced near the close yesterday, TRX closed the day at 0.3373 and rose slightly in the morning hours, currently trading at 0.3394. Currently trading near the lower band of the bearish channel, TRX is priced just below the 0.3395 resistance on the 4-hour chart. The Relative Strength Index (RSI) value is 45, indicating a sell zone. In addition, the Chaikin Money Flow (CMF) indicator is above zero at 0.17, indicating an increase in cash inflows. This suggests that buyers are playing a more active role in the market and points to an increase in liquidity that could support an upward price movement.
In light of all these indicators, TRX may rise slightly in the first half of the day, testing the 0.3465 resistance level based on its current zone and RSI value. A candle close above this resistance could allow it to continue its upward movement, potentially entering a bearish channel and moving toward the middle band. It may then attempt to test the 0.3555 resistance level. If it fails to close above the 0.3395 resistance level and the CMF moves into negative territory, it may decline slightly due to potential selling pressure and test the 0.3300 support level.
On the 4-hour chart, 0.3190 is an important support level, and as long as it remains above this level, the upward momentum is expected to continue. If this support is broken, selling pressure may increase.
Supports 0.3300 – 0.3230 – 0.3190
Resistances 0.3395 – 0.3465 – 0.3555
LTC/USDT
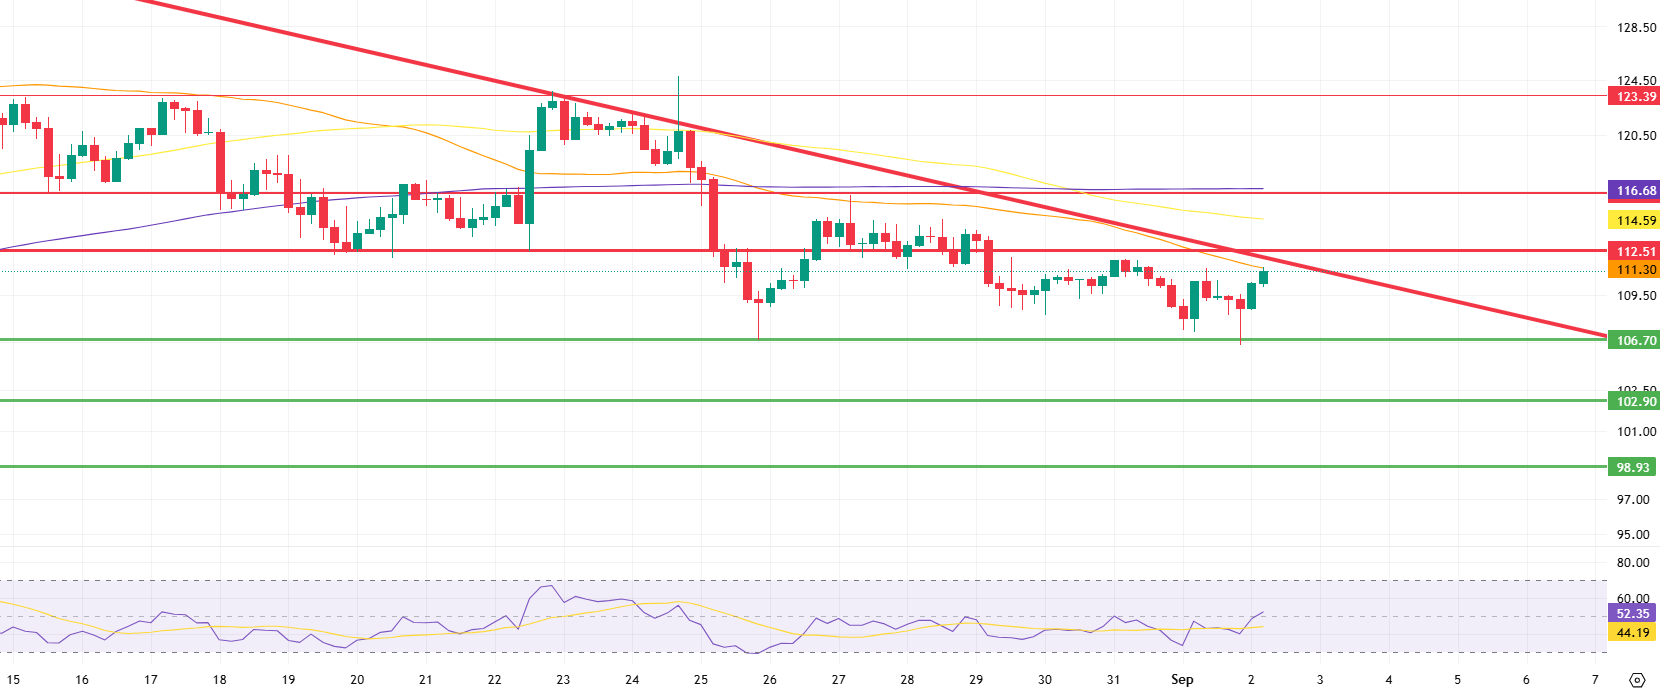
LTC opened at 108.66, down 0.17% from the previous day. It also lost 1.09% against Bitcoin. On the futures side, there is a position reduction of over 11 million USDT, meaning that volume is decreasing on the leveraged trading side. Despite this, funding rates remain positive. This shows that there is still appetite on the long side, but the price has not responded very positively to this.
The first important threshold for LTC to start rising is the 111.30 level. Both the falling trend line and the 50-period moving average (orange line) intersect in this area, making it critical. If the price closes above this level consistently, it will be the first confirmation that buyers are gaining strength. If the resistance is broken with high trading volume, the short-term target for the price will be the 112.51 level. This area is a critical test for the sustainability of the uptrend, and the price reaction here will determine the direction of the trend. If a strong hold is achieved above this level, the next focus will be the 116.68 level. This area, where both horizontal resistance and the 200-period moving average (purple line) exert pressure, stands out as an area where buyer intensity may weaken and selling pressure may regain strength.
If the 106.70 level is broken downwards, the probability of selling pressure gradually increasing and pulling the price back to the next support point at 102.90 will rise. The most critical factor to watch at this point will be the direction of the reaction from the 102.90 level; the reaction will play an important role in determining the short-term market trend. However, if a sustained break below this band occurs, the technical outlook will weaken significantly, and the possibility of selling deepening to the 98.93 level will increase.
Supports: 106.70 – 102.90 – 98.93
Resistances 111.30 – 112.51 – 116.68
SUI/USDT
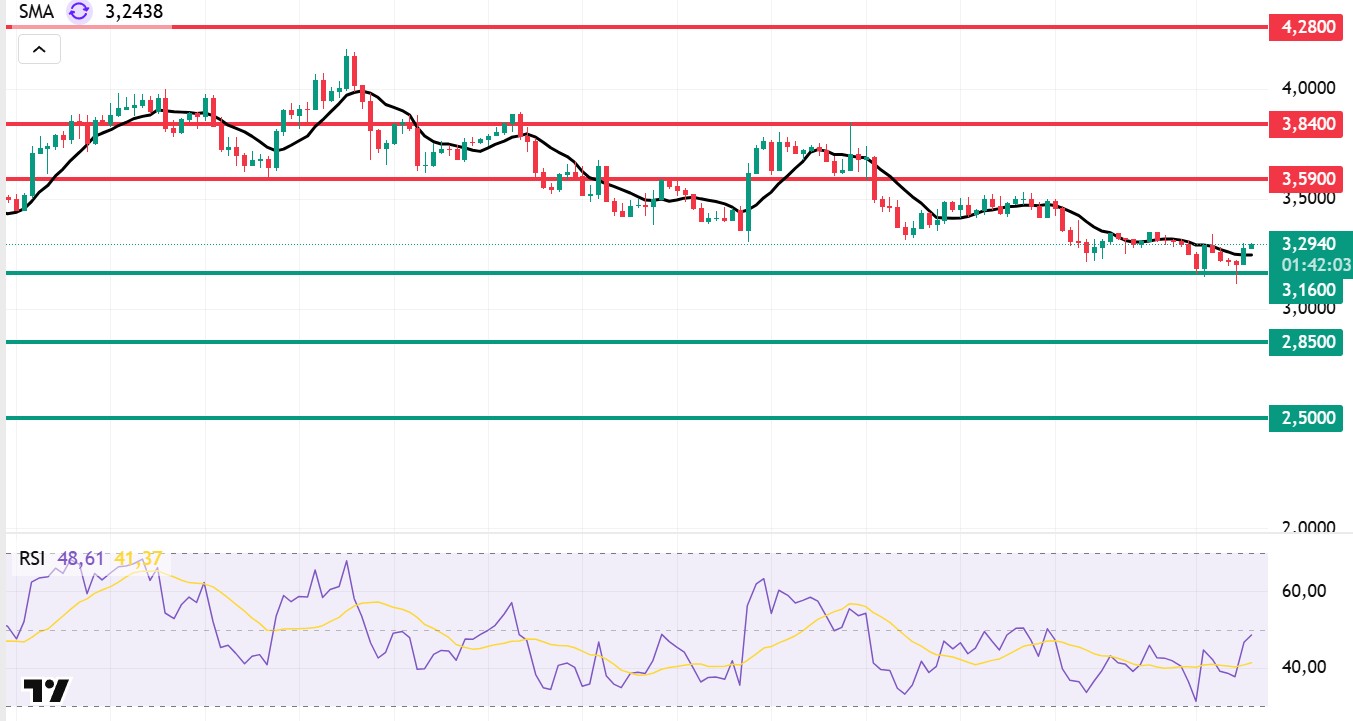
Looking at Sui’s technical outlook, we see that the price has declined on a weekly basis to around $3.24, influenced by fundamental developments. The Relative Strength Index (RSI) is currently in the range of 48.61 – 41.37. This range indicates that the market is trading close to the sell zone; however, if the RSI weakens and falls to the 30.00 – 35.00 range, it could signal a potential buying point. If the price moves upward, the resistance levels of $3.59, $3.84, and $4.28 can be monitored. However, if the price falls to new lows, it could indicate that selling pressure is intensifying. In this case, the $3.16 and $2.85 levels stand out as strong support zones. In particular, in the event of a sharp sell-off, a pullback to $2.50 appears technically possible.
According to Simple Moving Averages (SMA) data, Sui’s average price is currently at the $3.29 level. The price remaining below this level indicates that the current downtrend could technically continue. The downward trend of the SMA also supports this situation.
Support levels: $2.50 – $2.85 – $3.16
Resistances: 3.59 – 3.84 – 4.28
Legal Notice
The investment information, comments, and recommendations contained herein do not constitute investment advice. Investment advisory services are provided individually by authorized institutions taking into account the risk and return preferences of individuals. The comments and recommendations contained herein are of a general nature. These recommendations may not be suitable for your financial situation and risk and return preferences. Therefore, making an investment decision based solely on the information contained herein may not produce results in line with your expectations.

