
Technical Analysis
BTC/USDT
While some Fed officials in the US advocate a more cautious stance against inflation risks, others emphasize that softening in the labor market is a more pressing risk. On the Chinese front, both the central bank’s supportive stance on liquidity and the increase in money supply and credit expansion are noteworthy. The flexible monetary policy rhetoric leaves the door open for reserve requirement and interest rate cuts, while rising M2, credit volume, and government bond balances signal that economic support policies are continuing.
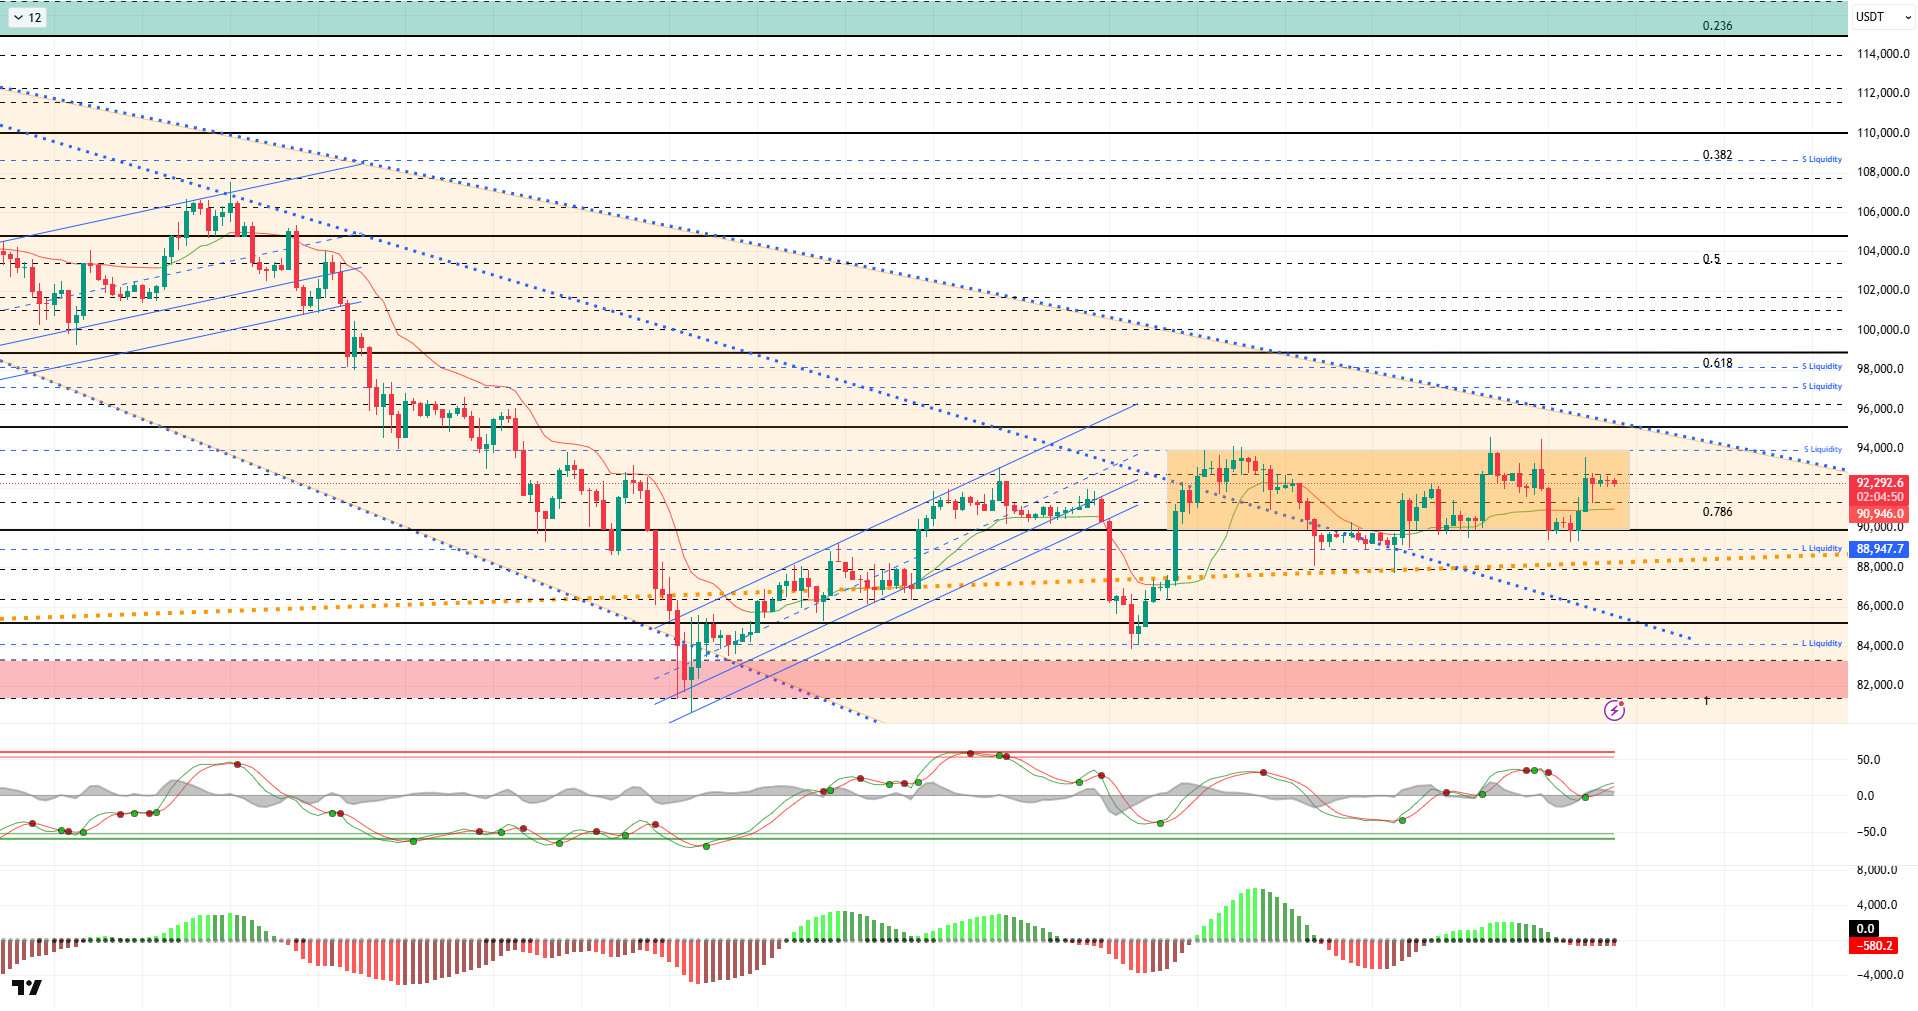
From a technical perspective, BTC entered a consolidation phase within a horizontal band after losing its triangle structures in the previous analysis. The price, which occasionally spikes below the reference level of 90,000, manages to break above this region. Yesterday, the price once again demonstrated a similar movement, returning above the 92,000 level.
Technical indicators show that the Wave Trend (WT) oscillator has reversed its sell signal in the channel midband to a buy signal. The histogram on the Squeeze Momentum (SM) indicator is in the negative zone with divergence. The Kaufman Moving Average (KAMA) is currently trading below the price at the $90,945 level.
According to liquidation data, although the short-term buying level at 89,000 saw some liquidation during the recent decline, investors who saw the decline as an opportunity recorded more intensity. Short-term sell-side transactions are concentrated in the 94,500–95,800 range. In the monthly view, it continues to maintain its concentration in the 97,000–98,000 range.
In summary, although the Fed cut interest rates as expected, it emphasized that uncertainty remains regarding the course of policy for the coming year. On the other hand, another important development that caught the attention of the markets was the Fed’s preparation to expand its balance sheet by repurchasing short-term Treasury bonds. In contrast, the BOJ’s decision to raise interest rates by 25 basis points at its December meeting is the most important factor for markets to monitor in the coming days. On the technical side, BTC, which retreated to the 80,500 level following the downtrend that began after its all-time high (ATH), rebounded strongly from this region. It then settled above the 90,000 level and continues to trade there. Liquidity data shows that target zones have regained importance and the market has stabilized, but the intensity of the selling pressure has increased. After this stage, the 90,000 level has become critical again for the price to maintain its momentum. Closings and pricing above this level are an important indicator for regaining momentum. In this context, 95,000 stands out as the next target area, and once it is passed, liquidity areas will be monitored again. In the event of possible selling pressure, 90,000 stands out again as the reference area, and in the event of a breakout, the 88,000 level, which is the point where the major uptrend passed, will be monitored.
Supports: 90,000 – 89,000 – 88,000
Resistances: 91,400 – 92,600 – 94,000
ETH/USDT
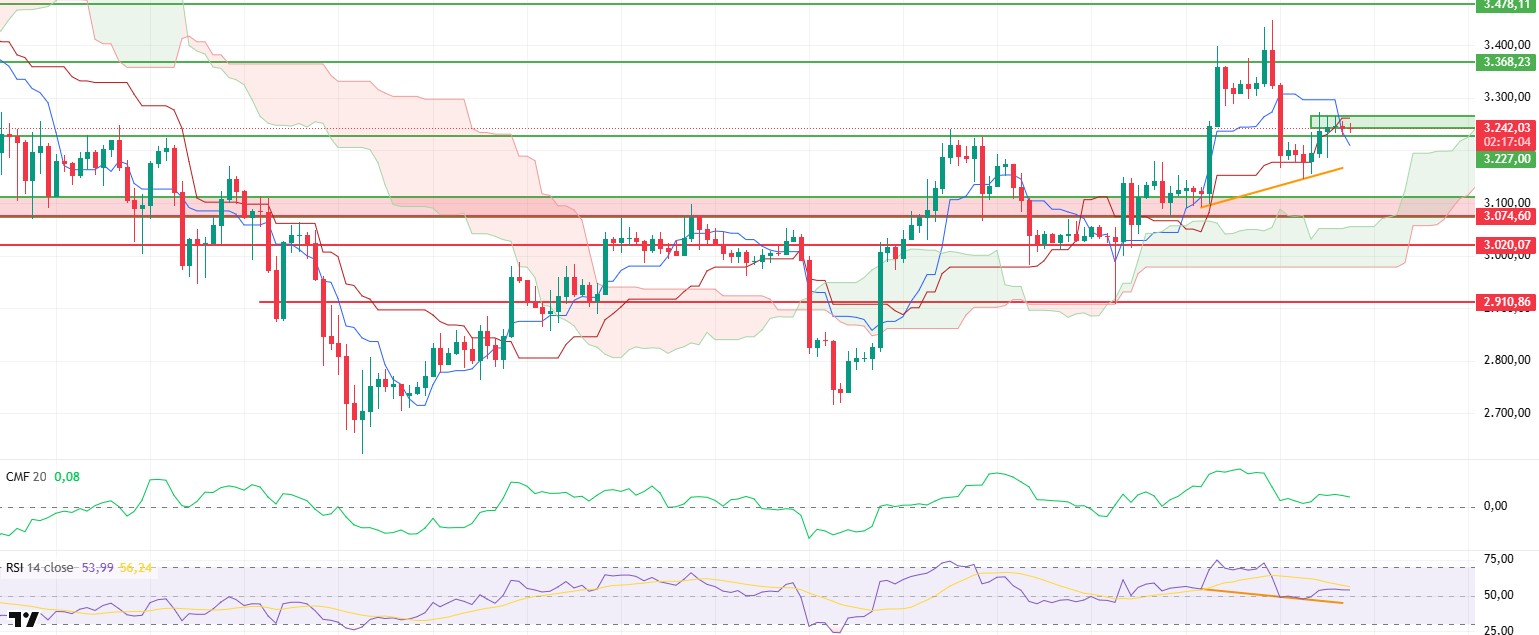
The ETH price struggled to find direction during the day and traded sideways without settling above the $3,250 level. The weakening momentum compared to the morning hours indicates cautious waiting on the buyer side. Although the price held in the high range, the slowdown in upward momentum points to short-term fragility.
A noticeable slowdown in liquidity is evident. The Chaikin Money Flow (CMF) indicator turning slightly negative reveals that capital inflows into the market have weakened and that current upward attempts are not yet supported by sufficient liquidity. This structure stands out as an important factor explaining why the price is struggling to break through resistance levels.
On the momentum side, the Relative Strength Index (RSI) continues to move horizontally above the 50 level. While the RSI holding in this region does not indicate a completely negative picture, it shows that a strong momentum for a new upward wave has not yet formed. Momentum is being maintained, but it has not produced a clearer signal for determining the direction.
Short-term technical pressure has increased in the Ichimoku indicator. The price losing the Kijun level and the Tenkan line cutting the Kijun downward creates a short-term sell signal. In this environment of low volume, it seems more likely that this signal will work. Nevertheless, the price still remaining above the kumo cloud indicates that the medium-term trend has not completely broken down and the main structure has not shifted to the negative side.
As we enter the evening hours, the $3.227 level retains its critical importance. A breach of this support could increase short-term selling pressure and bring lower levels into focus. Conversely, if the price manages to hold above $3.227 and liquidity inflows regain strength, the potential for a recovery towards the $3.330 region remains intact. The decisive factor in terms of trend will be price behavior around this support level and the direction of liquidity.
Supports: 3,074 – 3,020 – 2,910
Resistances: 3,227 – 3,368 – 3,478
XRP/USDT
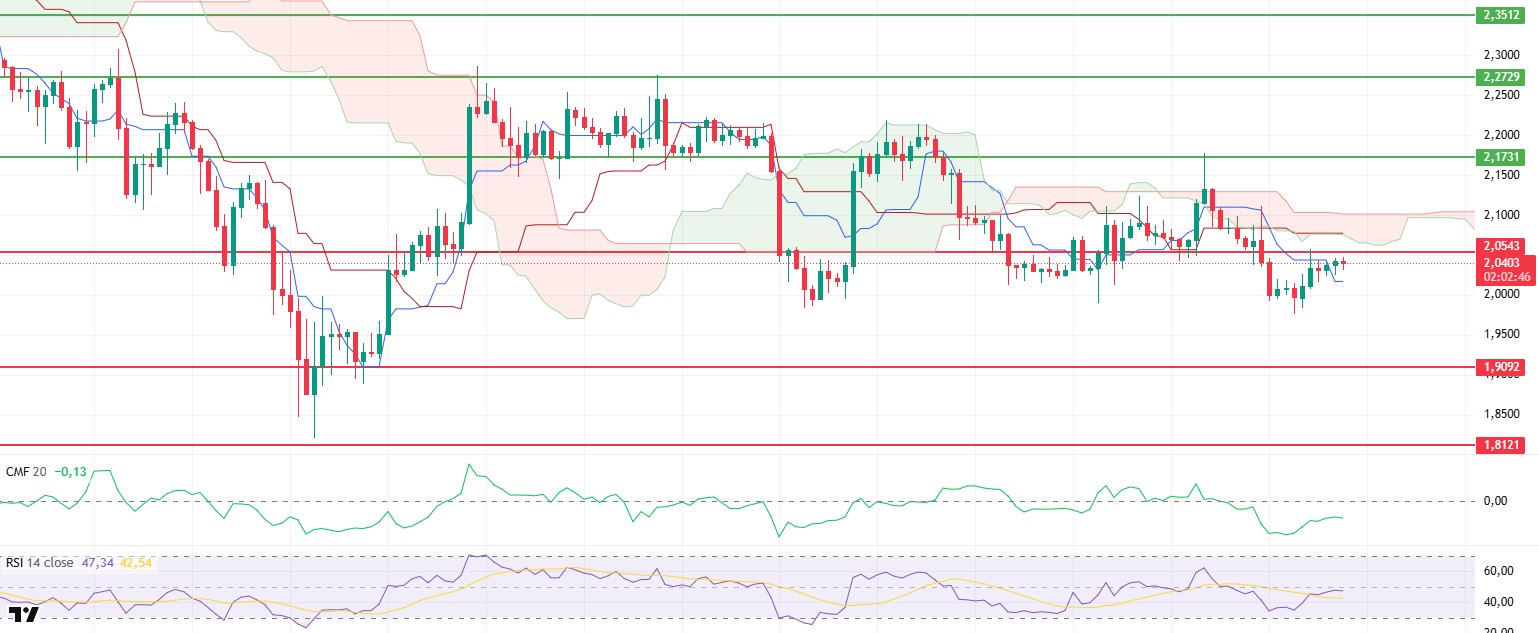
The XRP price struggled to produce a clear direction throughout the day and remained flat, unable to approach the $2.055 resistance. The failure of the morning recovery attempt to continue indicates that buyers remained cautious during the day and that the market is still in a decision phase. The price being stuck in a narrow range signals that the upward momentum has not yet found sufficient strength.
On the liquidity side, a limited but noteworthy balance is being maintained. Although the Chaikin Money Flow (CMF) indicator remains in negative territory, it continues its upward trend. This structure indicates that sharp sell-offs have weakened and that gradual liquidity inflows from low levels have not completely ceased. However, this flow is not yet strong enough to push the price to resistance levels.
There is a relatively more balanced picture on the momentum front. It continues to stay above the Relative Strength Index (RSI)-based MA line, indicating that the morning’s weakness has not deepened on the momentum side. While this hold in the RSI signals that the price has been able to build some resistance against downward pressure, a strong bullish signal has not yet been generated.
The technical structure on the Ichimoku side has not changed. The price continues to trade below the kumo cloud, and the Tenkan and Kijun levels have still not been breached. This outlook explains why upward attempts remained limited as the evening hours approached and reveals that recovery efforts are fragile.
In the current scenario, the $2,055 level maintains its position as the key short-term threshold. Unless this area is breached, the price is likely to continue its sideways and pressured movement. If liquidity inflows strengthen significantly and the recovery in the RSI continues, it may be possible to test this resistance again. In the opposite scenario, however, the downside risk cannot be completely ruled out, and the possibility of the price coming under pressure again towards the lower support zones remains on the table.
Supports: 1.9092 – 1.8121 – 1.6224
Resistances: 2.0543 – 2.1731 – 2.2729
SOL/USDT
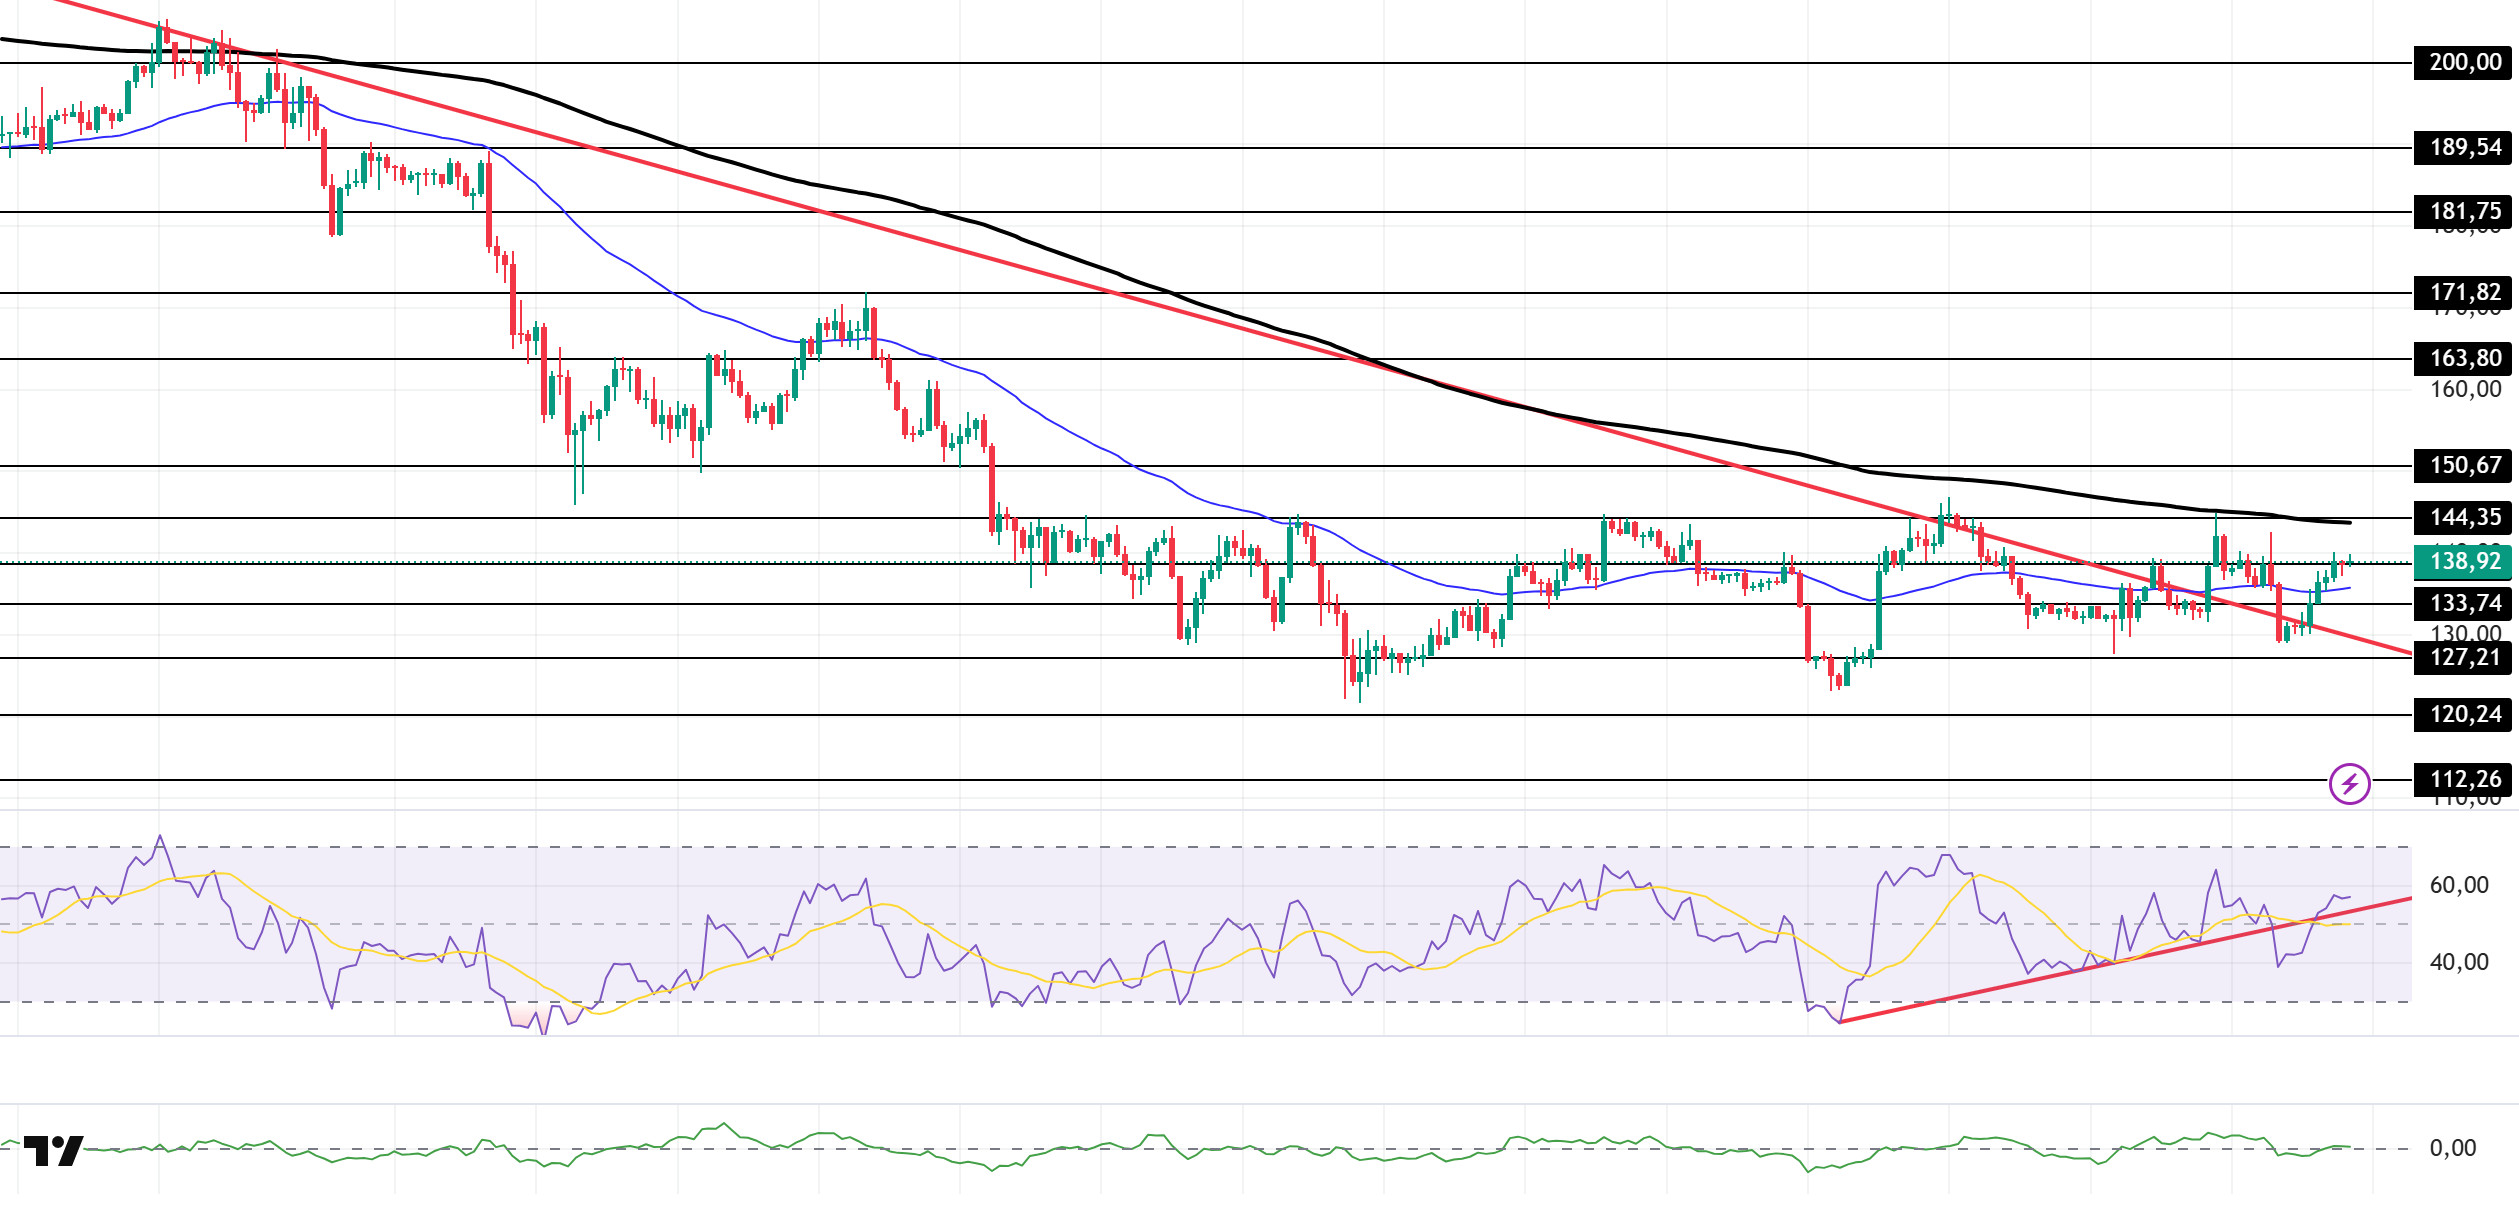
The SOL price traded sideways during the day. The asset continued to trade above the downward trend that began on October 6 and the 50 EMA (Blue Line) moving average. Currently maintaining its level, the price is preparing to test the 200 EMA (Black Line) moving average as resistance. If it closes above this moving average, it could test the $150.67 level as resistance. In case of a pullback, it could test the 50 EMA (Blue Line) moving average as support.
On the 4-hour chart, it remained below the 50 EMA (Exponential Moving Average – Blue Line) and 200 EMA (Black Line). This indicates a possible downtrend in the medium term. At the same time, the price being between the two moving averages indicates that the asset is in a decision phase in the short term. The Chaikin Money Flow (CMF-20) has moved into positive territory. However, the balance of money inflows and outflows may keep the CMF in positive territory. The Relative Strength Index (RSI-14) has risen to the middle of the positive zone. It also continues to be in the upper region of the upward trend that began on December 1. This indicates that buying pressure is building. If there is an uptrend due to macroeconomic data or positive news related to the Solana ecosystem, the $150.67 level stands out as a strong resistance point. If this level is broken upwards, the uptrend is expected to continue. If there are pullbacks due to developments in the opposite direction or profit-taking, the $120.24 level may be tested. A decline to these support levels could increase buying momentum, presenting a potential opportunity for an upward move.
Supports: 138.73 – 133.74 – 127.21
Resistances: 144.35 – 150.67 – 163.80
DOGE/USDT
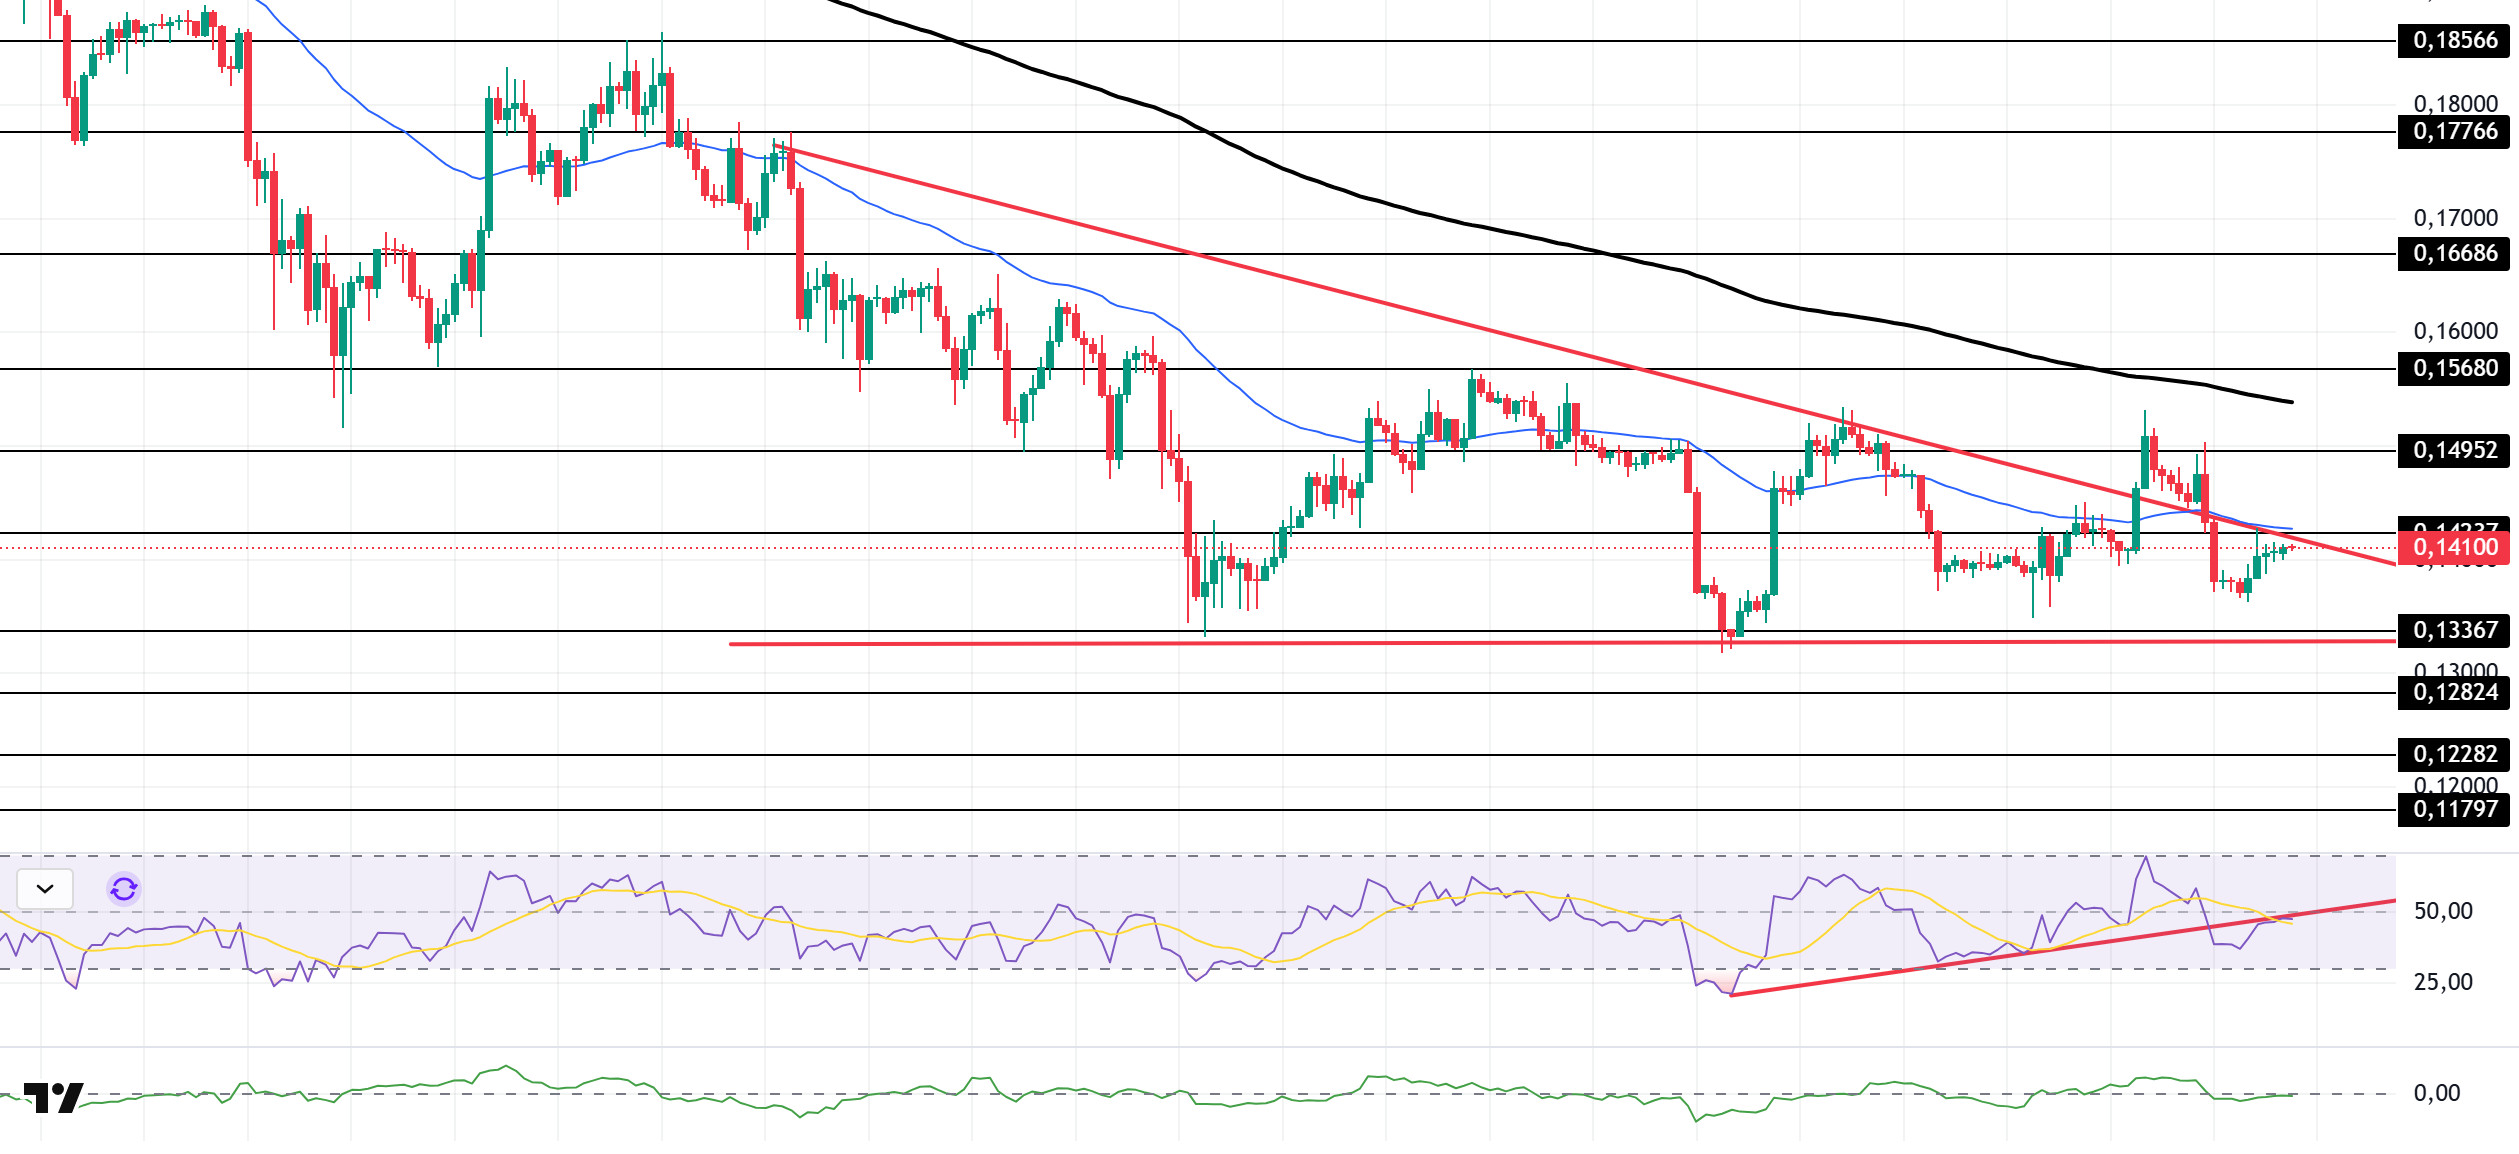
The DOGE price traded sideways during the day. The asset is currently testing the ceiling level of the descending triangle formation that began on November 13 and the 50 EMA (Blue Line) moving average as resistance. The asset, which is gaining momentum, may test the 200 EMA (Black Line) moving average as resistance if the uptrend continues. If a pullback begins, it may test the base level of the descending triangle formation.
On the 4-hour chart, the 50 EMA (Exponential Moving Average – Blue Line) remained below the 200 EMA (Black Line). This indicates that the downtrend may continue in the medium term. The price being below both moving averages suggests a downward trend in the short term. The Chaikin Money Flow (CMF-20) is at a neutral level. Additionally, the balance of money inflows and outflows may keep the CMF at a neutral level. The Relative Strength Index (RSI-14) remained at a neutral level. At the same time, it is testing the resistance level of the upward trend that began on December 1. If it breaks through this level, buying pressure may increase. In the event of an uptrend driven by political developments, macroeconomic data, or positive news flow in the DOGE ecosystem, the $0.15680 level stands out as a strong resistance zone. Conversely, in the event of negative news flow, the $0.13367 level could be triggered. A decline to these levels could increase momentum and initiate a new wave of growth.
Supports: 0.13367 – 0.12824 – 0.12282
Resistances: 0.14237 – 0.14952 – 0.15680
AVAX/USDT
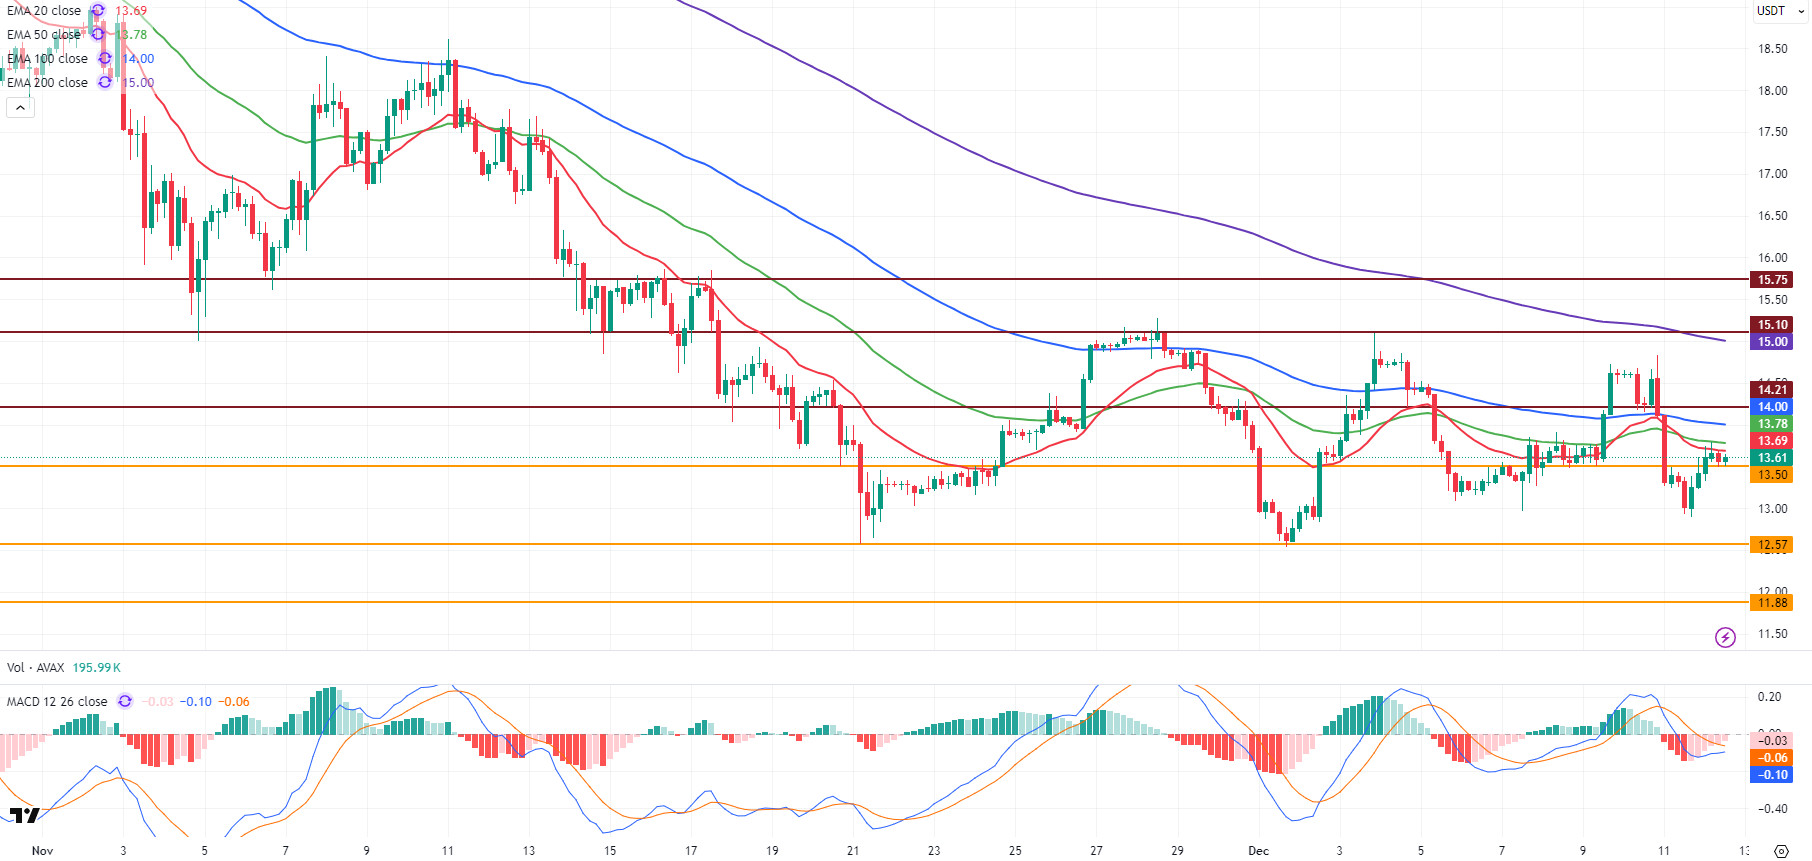
Starting the day at $13.42, AVAX broke through the $13.50 resistance level in the first half of the day, giving a short-term positive signal. Following yesterday’s sharp sell-off across the crypto market, AVAX also saw upward reaction buying during the day, in line with the limited recovery. However, after testing the 20 and 50-period Exponential Moving Average (EMA) levels during its rise, it experienced a decline due to selling pressure in these areas. AVAX continues to move within a horizontal band in the second half of the day due to weak momentum.
On the 4-hour chart, the Moving Average Convergence/Divergence (MACD) line continues to trade below the signal line and in negative territory. The horizontal direction of the MACD indicates that although selling pressure has eased, a strong buying momentum has not yet formed. This outlook limits upward attempts to resistance levels. On the EMA side, AVAX is still below the EMA20, EMA50, and EMA100 levels. Sales formed at the EMA20 and EMA50 levels during the intraday rise confirmed that these areas are acting as strong resistance in the short term. Remaining below critical EMA levels leads to a cautious technical outlook.
From a technical perspective, the first critical resistance zone for AVAX’s rise is the $14.21 level, along with the band formed by the EMA levels. If this region is broken upwards, the upward momentum could accelerate, and AVAX could move towards and test the EMA200, $15.10, and $15.75 resistance levels. In a downward scenario, the $13.50 level is the first important support position. If this level is broken downward again, selling pressure may increase, and AVAX may retreat towards the $12.57 and $11.88 support levels. In the overall outlook, the MACD remaining in negative territory and AVAX trading below all critical EMA levels indicates a cautious short-term outlook. Although there have been rebound purchases during the day, as long as sustainability above the EMA levels is not achieved, upward attempts are likely to remain limited in the resistance zones.
(EMA20: Red Line, EMA50: Green Line, EMA100: Blue Line, EMA200: Purple Line)
Supports: 13.50 – 12.57 – 11.88
Resistances: 14.21 – 15.10 – 15.75
LINK/USDT
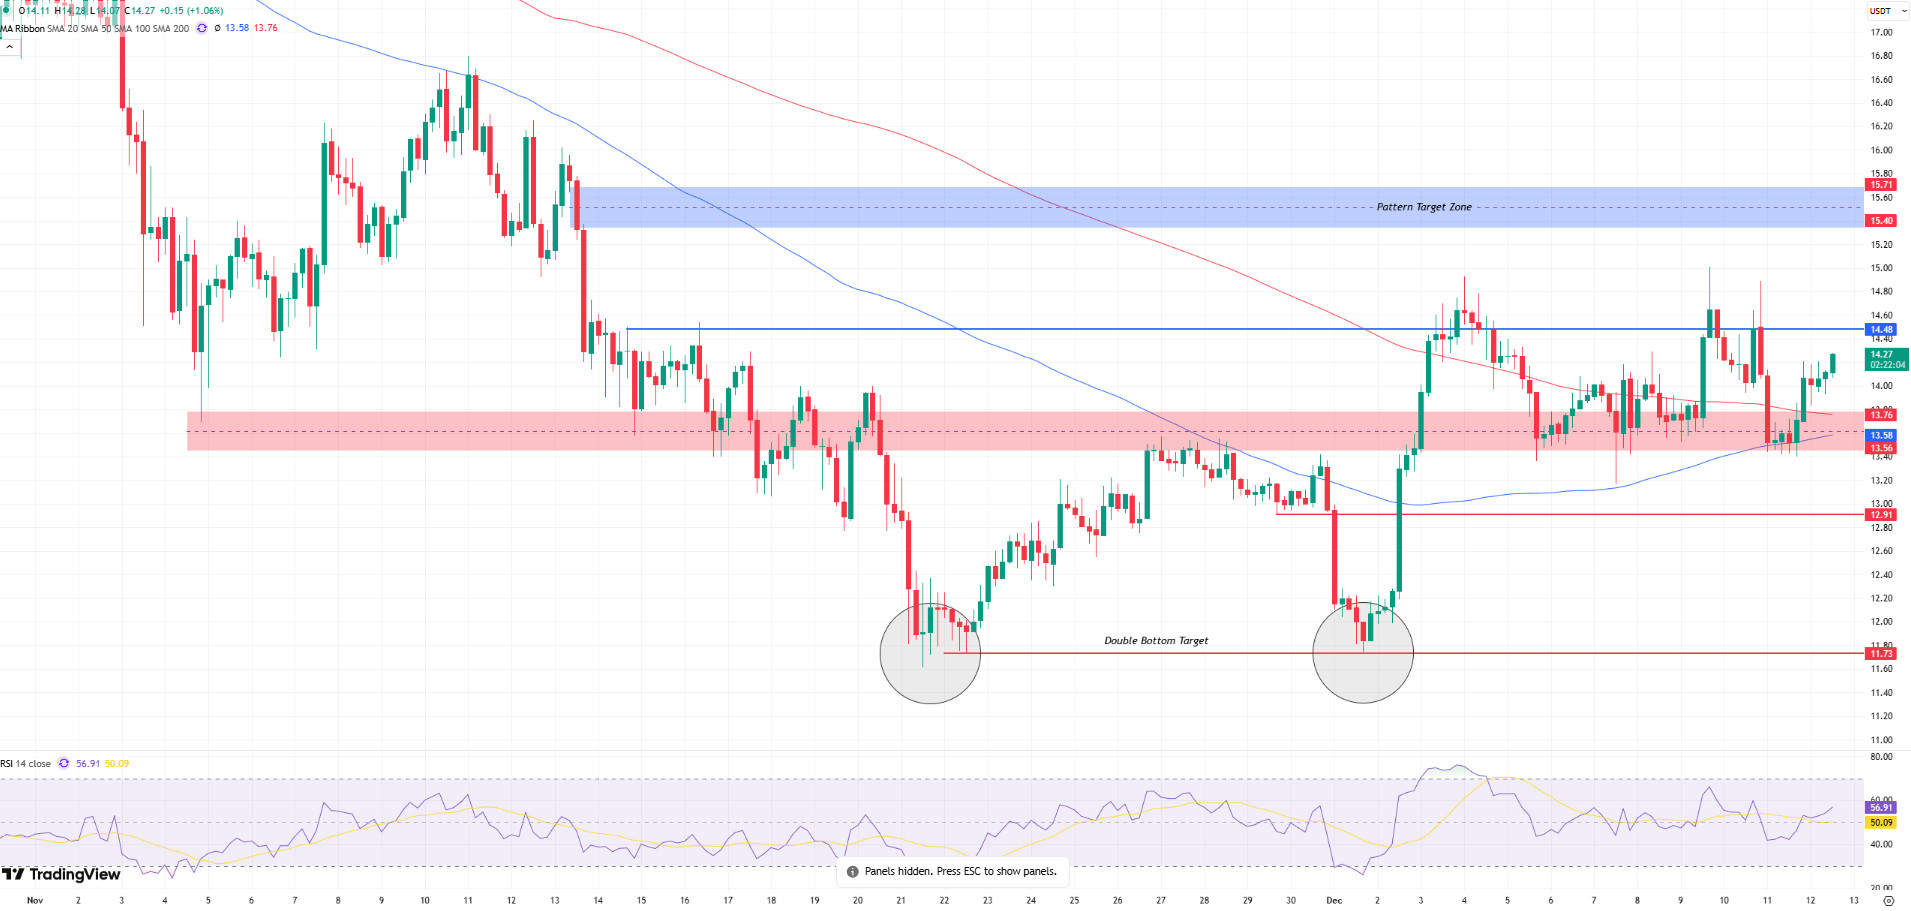
Following the recent downward movement, the price returned to the 13.30–13.50 range, forming a strong demand base in this area. The double bottom formation in the 11.73–11.80 range on the chart remains structurally valid, and we can say that buyers have regained momentum with the price breaking out of the current horizontal squeeze. However, closes below the 13.50 level could weaken the momentum provided by the formation and put the short-term outlook under negative pressure.
The main threshold the market must overcome for the upward movement to gain strength is the 14.45–14.48 resistance band. Although the price has tested this level several times in recent days, there has not yet been a breakout that proves the dominance of buyers. Four-hour closes above this area will only bring the target zone of the double bottom pattern back into focus. In particular, a market structure forming above 15.40 could significantly shift the medium-term trend picture to positive.
On the downside, the most critical defense line for the price is the 13.30–13.56 demand zone. Losing this zone increases the risk of the market retreating first to the 12.91 support and then to the 11.73 level, which is the lower boundary of the double bottom formation. Closes below 12.91, in particular, could significantly break the resistance of the current uptrend and confirm that sellers have regained control.
We see that the Relative Strength Index (RSI) has settled in positive territory at 56.91. This provides an important clue that the price’s upside potential has not yet been exhausted. However, the oscillator’s position alone is not sufficient to confirm a strong trend reversal. The price must remain above 14.48. Until this happens, even if there is a recovery trend in the market, we may continue to see more of a sideways-biased consolidation behavior.
Supports: 13.56 – 12.91 – 11.73
Resistances: 14.48 – 15.40 – 15.71
Legal Notice
The investment information, comments, and recommendations contained herein do not constitute investment advice. Investment advisory services are provided individually by authorized institutions taking into account the risk and return preferences of individuals. The comments and recommendations contained herein are of a general nature. These recommendations may not be suitable for your financial situation and risk and return preferences. Therefore, making an investment decision based solely on the information contained herein may not produce results in line with your expectations.

