
Technical Analysis
BTC/USDT
The Fed cut its policy rate by 25 basis points to a range of 3.75–4.00%, but Powell adopted a more hawkish tone than expected, signaling that another cut in December is “not certain.” The bank also announced it would end its balance sheet reduction process on December 1. During the same period, the Bank of Japan kept its rate steady at 0.5% and decided to continue its expansionary policy. On the diplomatic front, Trump and Xi Jinping met in Busan, South Korea; the parties discussed trade and security issues in a “friendly and constructive” atmosphere. Following the summit, the US and South Korea signed a total of $350 billion in investment agreements. The corporate earnings season presented a mixed picture for tech giants: Microsoft saw its shares fall despite an 18% increase in revenue due to weakness in cloud revenues; Google exceeded expectations; Meta reported a sharp decline in net income due to high tax expenses.
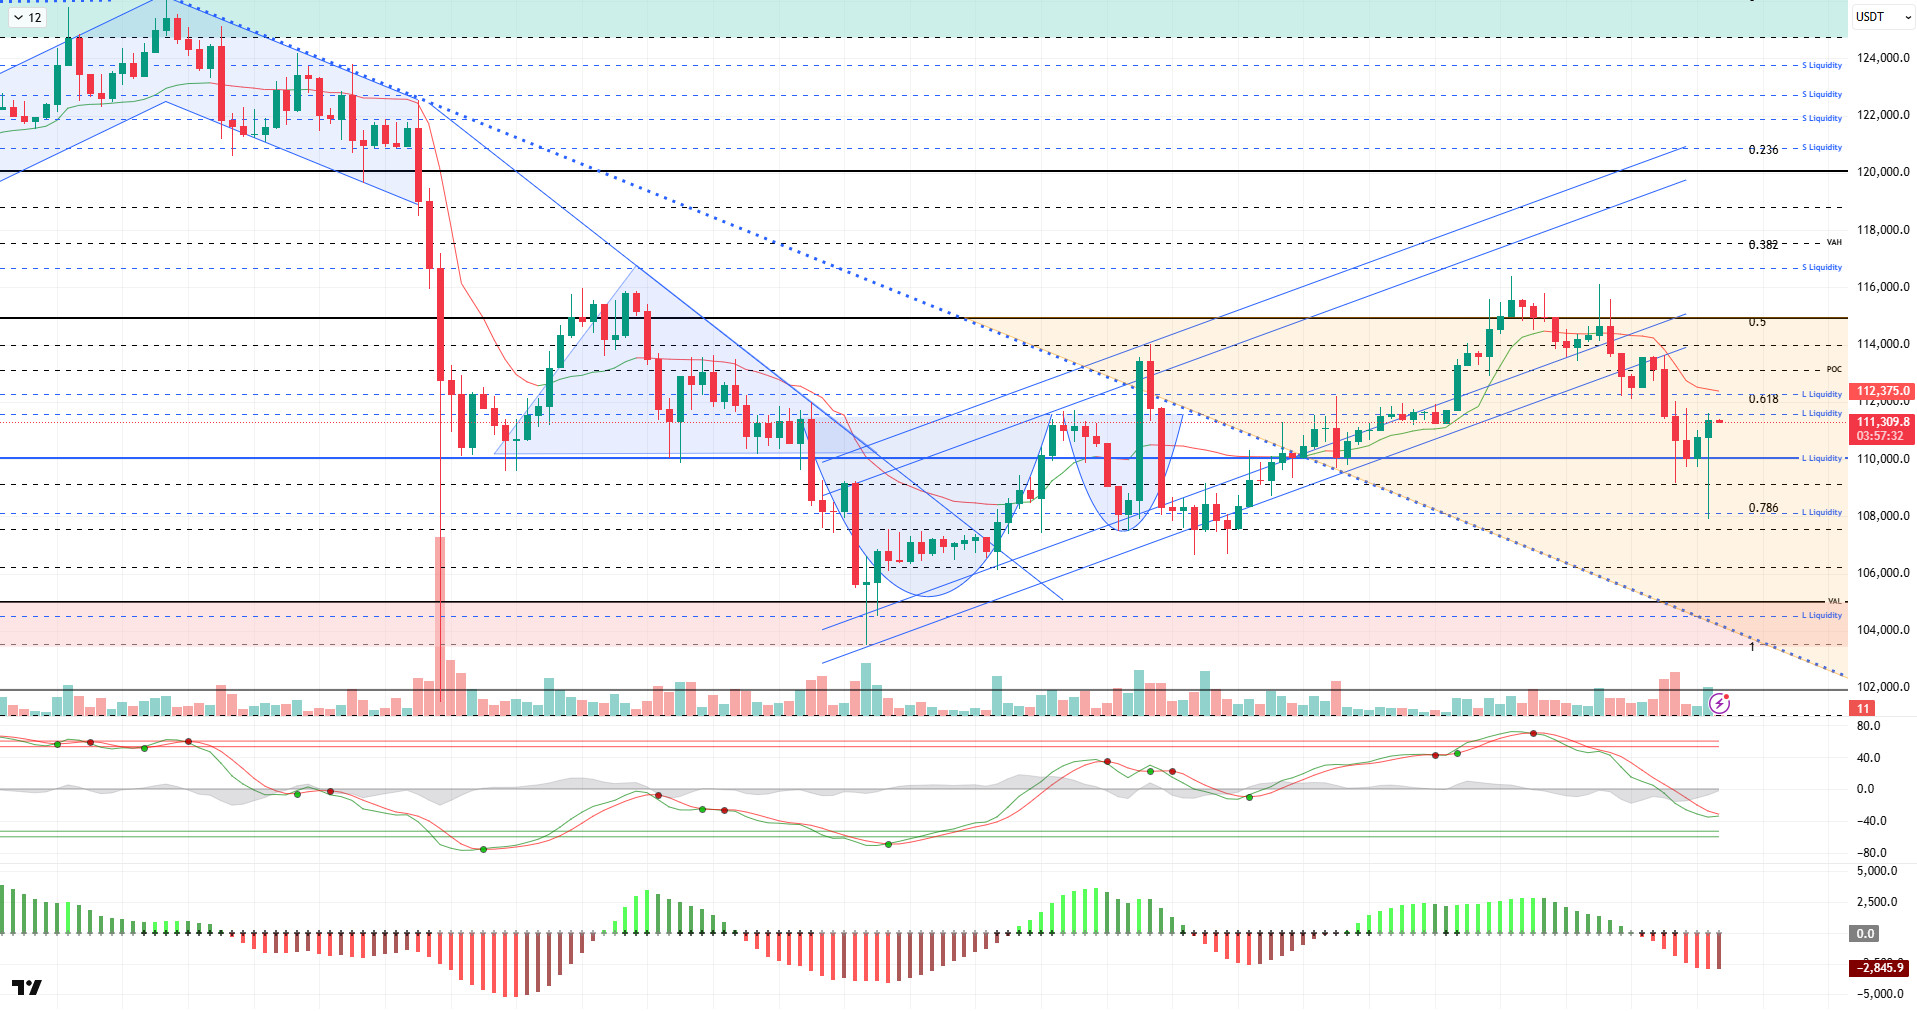
From a technical perspective, BTC lost the upward channel it had captured since October 17. The price, which occasionally exceeded the 116,000 level, failed to hold there. Losing the 115,000 level we were tracking as a reference, BTC faced heavy selling pressure due to fundamental developments. With the decline, the price also lost the 110,000 level and spiked to the 108,000 levels. Then, recovering again, BTC continues to test the 111,400 resistance within the orange band at the time of writing.
Technical indicators show the Wave Trend (WT) oscillator has moved just above the overbought zone, parallel to the sell signal it gave in the oversold zone. The histogram on the Squeeze Momentum (SM) indicator continues to weaken within the negative zone. The Kaufman moving average (KAMA) is currently at $112,400, positioned above the price.
According to liquidation data, the buy level recorded fragmented density in the 108,000 – 111,000 band, with intense liquidation occurring at the 112,450 level, where accumulation increased. In contrast, the selling level is concentrated at $113,000 in the short term, while a broader time frame shows $116,400 as an area of high liquidity. Total liquidation in the market over the last 24 hours was recorded at $824 million.
In summary, while the talks between the US and China took place in a constructive atmosphere on the fundamental side, Fed Chairman Powell’s uncertain stance on interest rate cuts next month emerged as a factor weighing on the markets. On the technical side, BTC lost its upward channel and moved into a horizontal band range. In liquidity data, balanced transactions, along with the recent decline, brought the selling level to the fore. In the coming period, 110,000 will continue to be monitored as a critical reference area, and pricing above this level will remain critical for regaining momentum. Following the recovery, resistance levels of 111,400 and then 112,600 will be monitored. In the event of a potential new selling pressure, the 110,000 level will continue to serve as a critical support.
Supports: 110,000 – 108,600 – 107,500
Resistances: 111,400 – 112,600 – 114,000
ETH/USDT
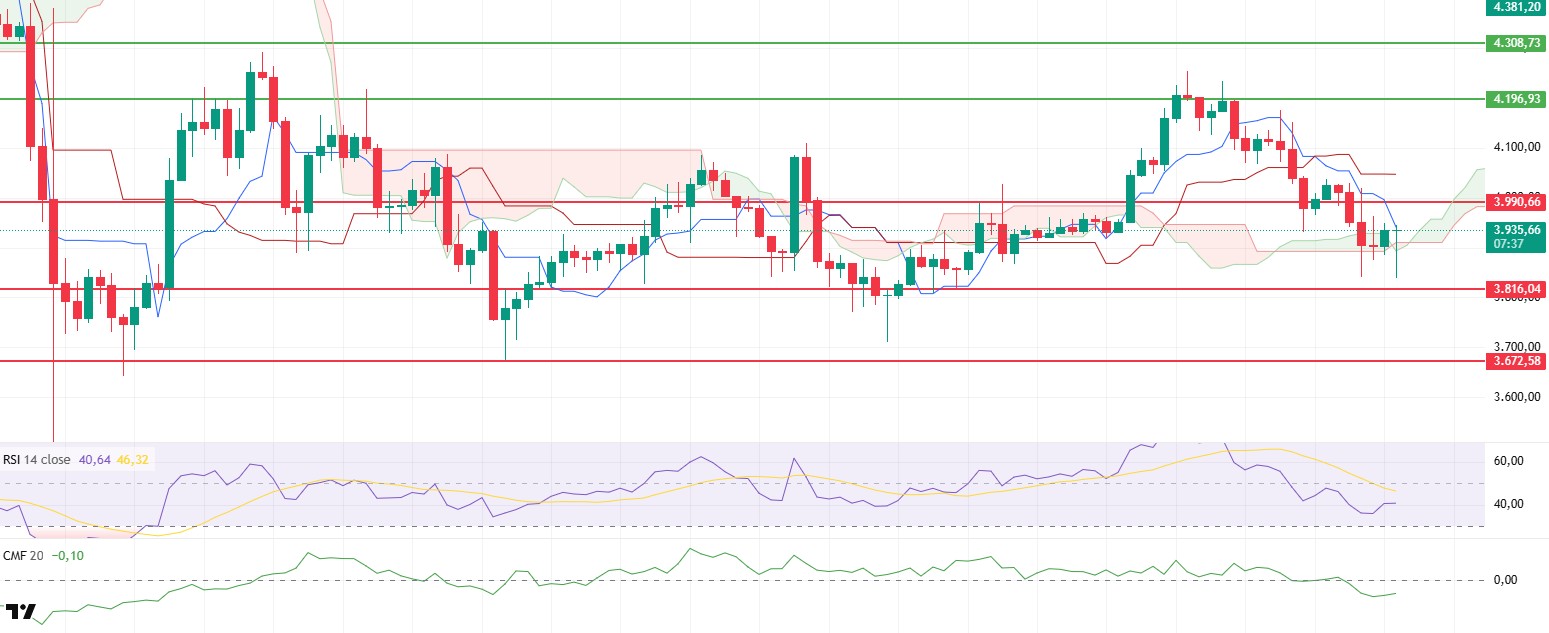
The Ethereum price struggled to maintain its upside potential mentioned in Tuesday’s analysis. While the Fed’s decision to cut interest rates by 25 basis points initially created short-term optimism in the market, uncertainty increased when Powell stated that another rate cut in December was not certain. This development led to strong selling pressure on the Ethereum price, causing it to fall to the $3,830 level. However, with buying from this area, the price managed to recover to the $3,940 level.
The CMF indicator fell sharply and entered negative territory. This indicates a significant outflow of liquidity from the market and a weakening of buyers. With the RSI indicator also falling below the 50 level, momentum is weakening, signaling that the short-term downtrend may continue for some time.
In the Ichimoku indicator, the price losing both the Tenkan and Kijun levels indicates that short-term weakness persists. However, the price remaining above the kumo cloud signals that the medium-term positive trend has not been completely broken. This structure shows that the main uptrend is technically being preserved despite short-term pressure.
The technical outlook generally points to a cautious stance. The upper band of the kumo cloud at the $3,928 level stands out as a critical short-term support. If the price remains above this level, a rebound towards the $3,990 resistance could be seen. However, if the price closes below the $3,928 level, selling pressure may increase, and the price may retreat to the $3,850 – $3,800 range. In summary, although Ethereum is showing a weak outlook in the short term, it has the potential to maintain its medium-term uptrend as long as it remains above the kumo cloud.
Top of Form
Below the Form
Supports: 3,928 – 3,816 – 3,672
Resistances: 3,990 – 4,196 – 4,308
XRP/USDT
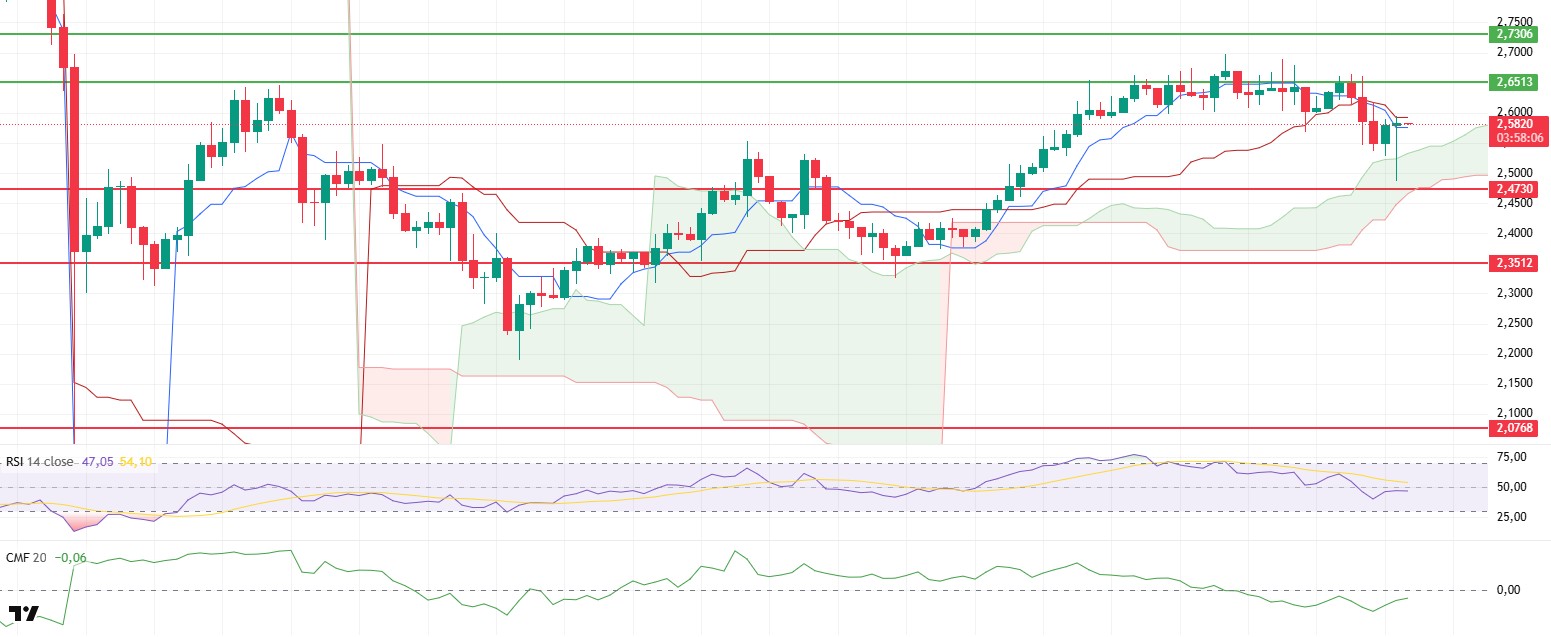
The XRP price failed to maintain the narrow range movement indicated in Tuesday’s analysis and followed a volatile course after the Fed’s decision. The FED’s decision to cut interest rates by 25 basis points initially created short-term optimism in the market, but Powell’s statement that another rate cut in December was not certain increased uncertainty. Following this statement, the XRP price fell to the $2.48 level. However, with buying from this area, the price managed to recover and rise above the $2.55 level.
Although the CMF indicator has remained in negative territory for some time, it has started to move upward in recent hours. This development, albeit limited, signals the start of renewed liquidity inflows. The fact that the buyer side is starting to regain strength, albeit weakly, supports the potential for a short-term recovery.
The RSI indicator is also showing an upward movement. If the index exceeds the 50 level, buying signals are expected to strengthen. This scenario increases the likelihood of the price regaining positive momentum in the short term.
The Ichimoku indicator shows that the price is moving below the Tenkan and Kijun levels, indicating that short-term risks persist. However, the price managing to stay above the kumo cloud confirms that the medium-term main trend is still positive. This outlook shows that the overall direction remains upward despite short-term fluctuations.
From a technical perspective, partial improvements in XRP indicators are noteworthy. The price has the potential to retest the $2.65 resistance level. If this level is clearly broken, the upward momentum could accelerate, and a new move towards the $2.72 level could be seen. The $2.47 level, on the other hand, maintains its critical support position. If the price falls below this level, selling pressure could increase again, and the price could retreat to the $2.40 region.
Supports: 2.4730 – 2.3512 – 2.2100
Resistances: 2.6513 – 2.7306 – 2.8576
SOL/USDT
VanEck submitted the Sixth Amendment filing for its proposed Solana ETF. Grayscale announced the Solana Trust as the largest spot Solana fund in the US. Bitwise and Canary Capital officially launched their own Solana ETFs on October 28. Western Union will launch its Solana-based stablecoin. Grayscale’s Solana Trust ETF (GSOL) begins trading today on the New York Stock Exchange Arca. Fidelity recently updated its S-1 filing for the SOL ETF, removing the ‘delay amendment’ that previously blocked automatic registration.
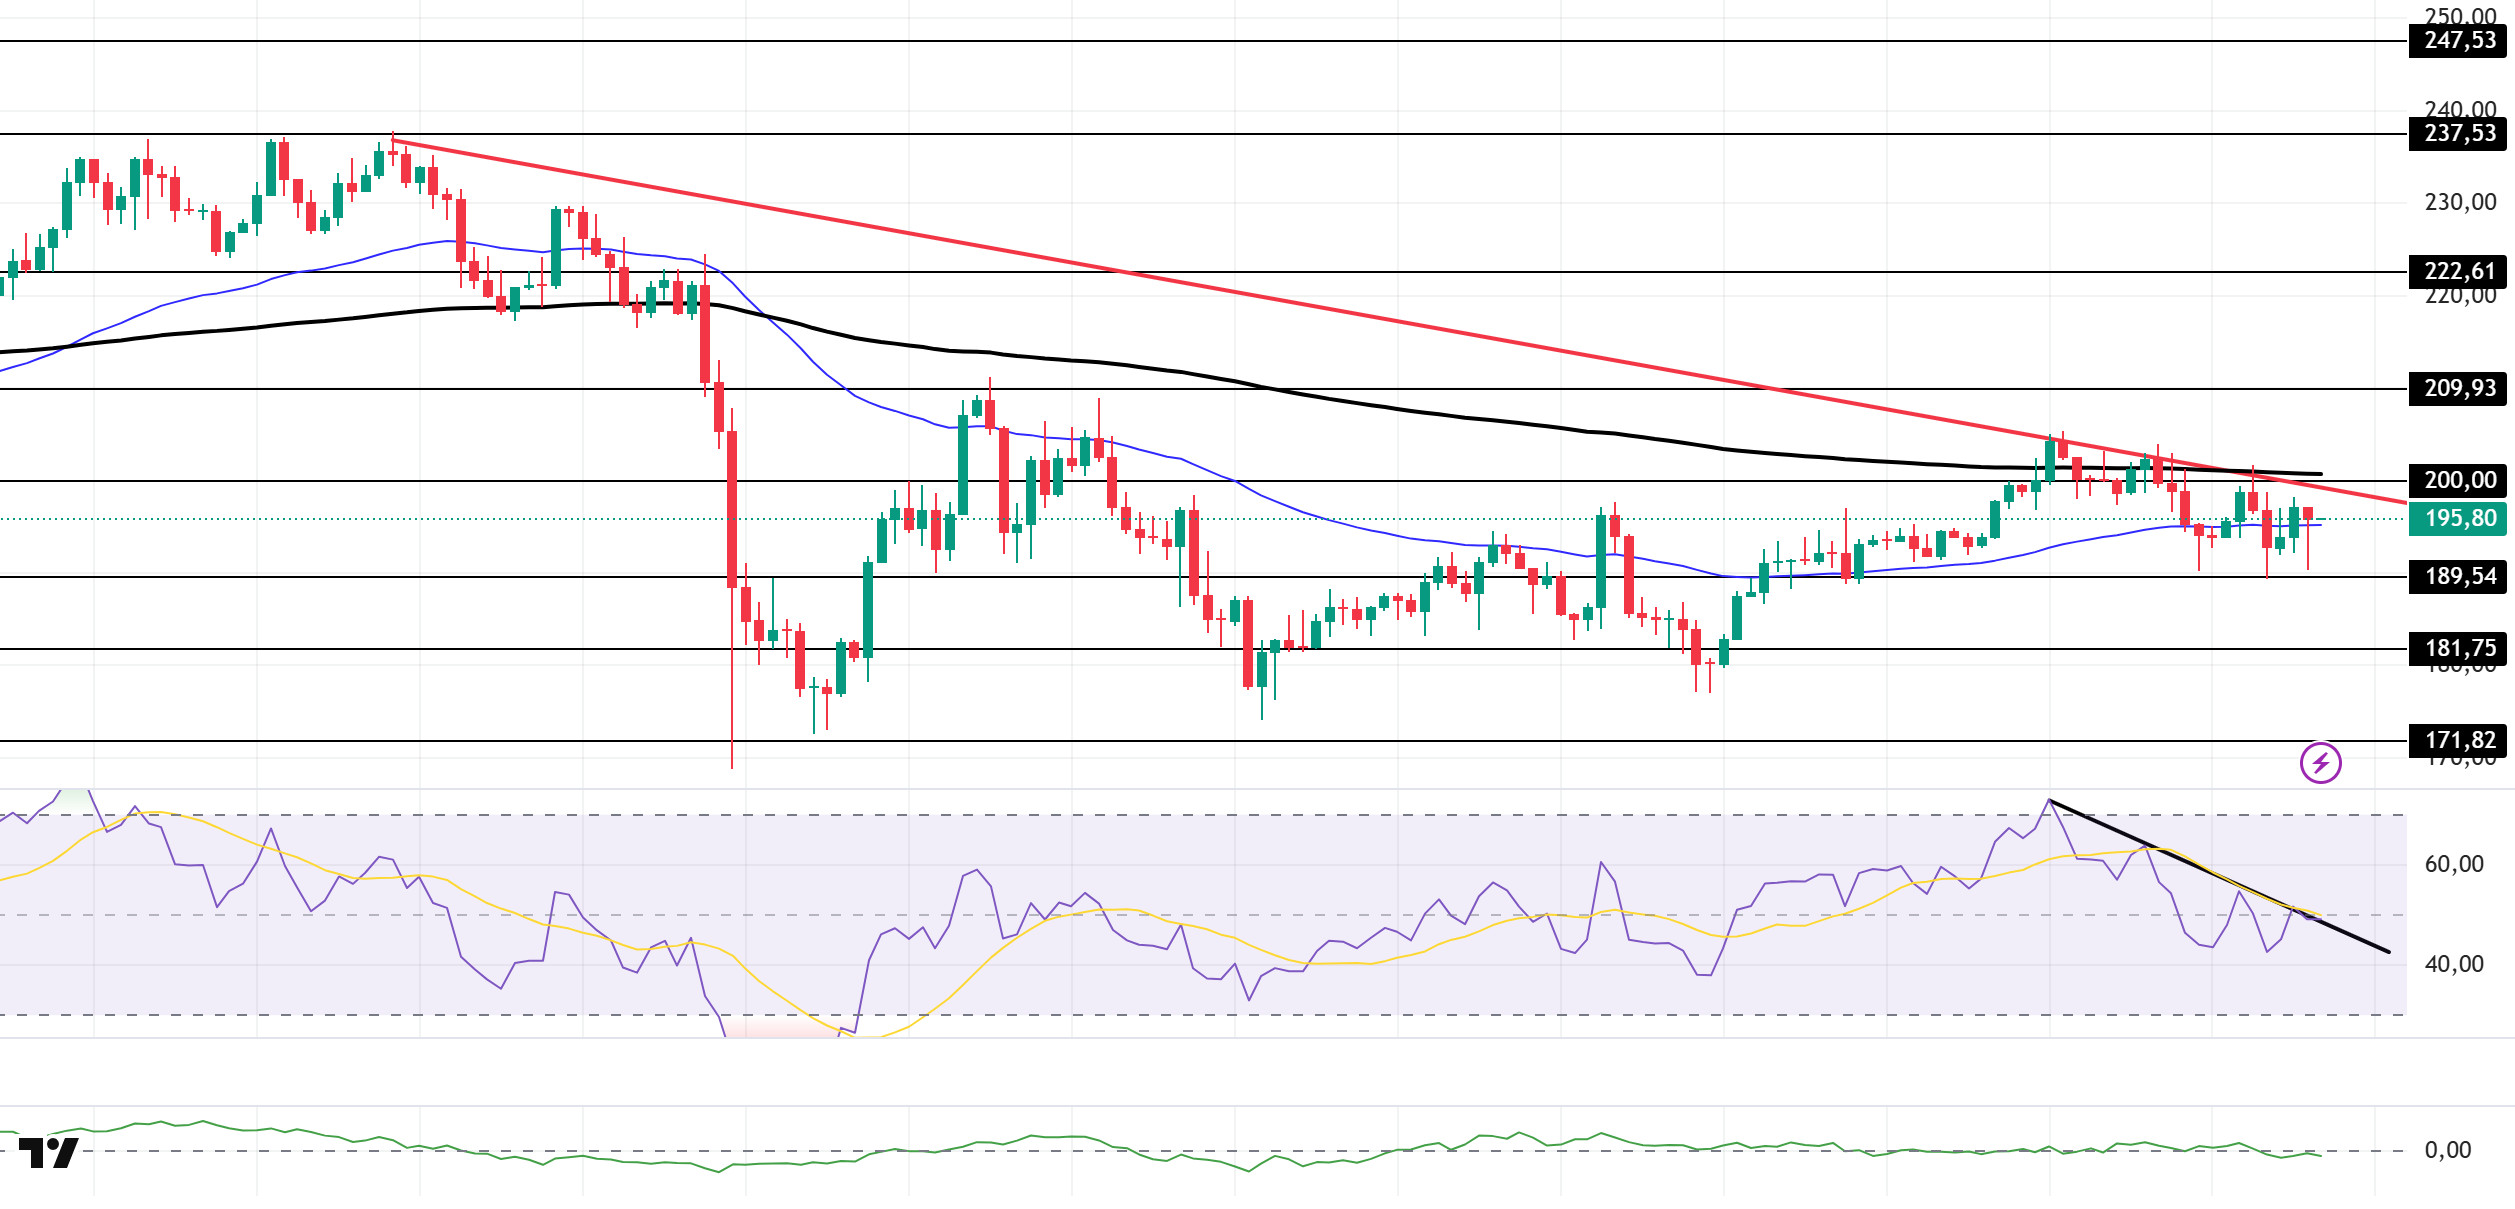
The SOL price continued its sideways trend. The asset tested the 200 EMA (Black Line) moving average and the downtrend that began on October 6 as resistance but failed to break through and experienced a pullback. It tested the strong support level of $189.54 and experienced a slight uptick. Currently testing the 50 EMA (Blue Line) moving average as support, the price could test the $189.54 level if the pullback continues. If the uptrend continues, the 200 EMA moving average should be monitored.
The price remained below the 50 EMA (Exponential Moving Average – Blue Line) and 200 EMA (Black Line) on the 4-hour chart. This indicates a possible downtrend in the medium term. At the same time, the price being below both moving averages shows us that the asset is trending downward in the short term. The Chaikin Money Flow (CMF-20) remained in the negative zone, close to the neutral level. However, the decrease in money inflows could push the CMF deeper into the negative zone. The Relative Strength Index (RSI-14) is in the negative zone. It also remained below the downward trend that began on October 27. This signaled increased selling pressure. If there is an upturn due to macroeconomic data or positive news related to the Solana ecosystem, the $209.93 level stands out as a strong resistance point. If this level is broken upwards, the uptrend is expected to continue. In case of pullbacks due to developments in the opposite direction or profit-taking, the $181.75 level could be tested. A decline to these support levels could increase buying momentum, presenting a potential upside opportunity.
Supports: 189.54 – 181.75 – 171.82
Resistances: 200.00 – 209.93 – 222.61
DOGE/USDT
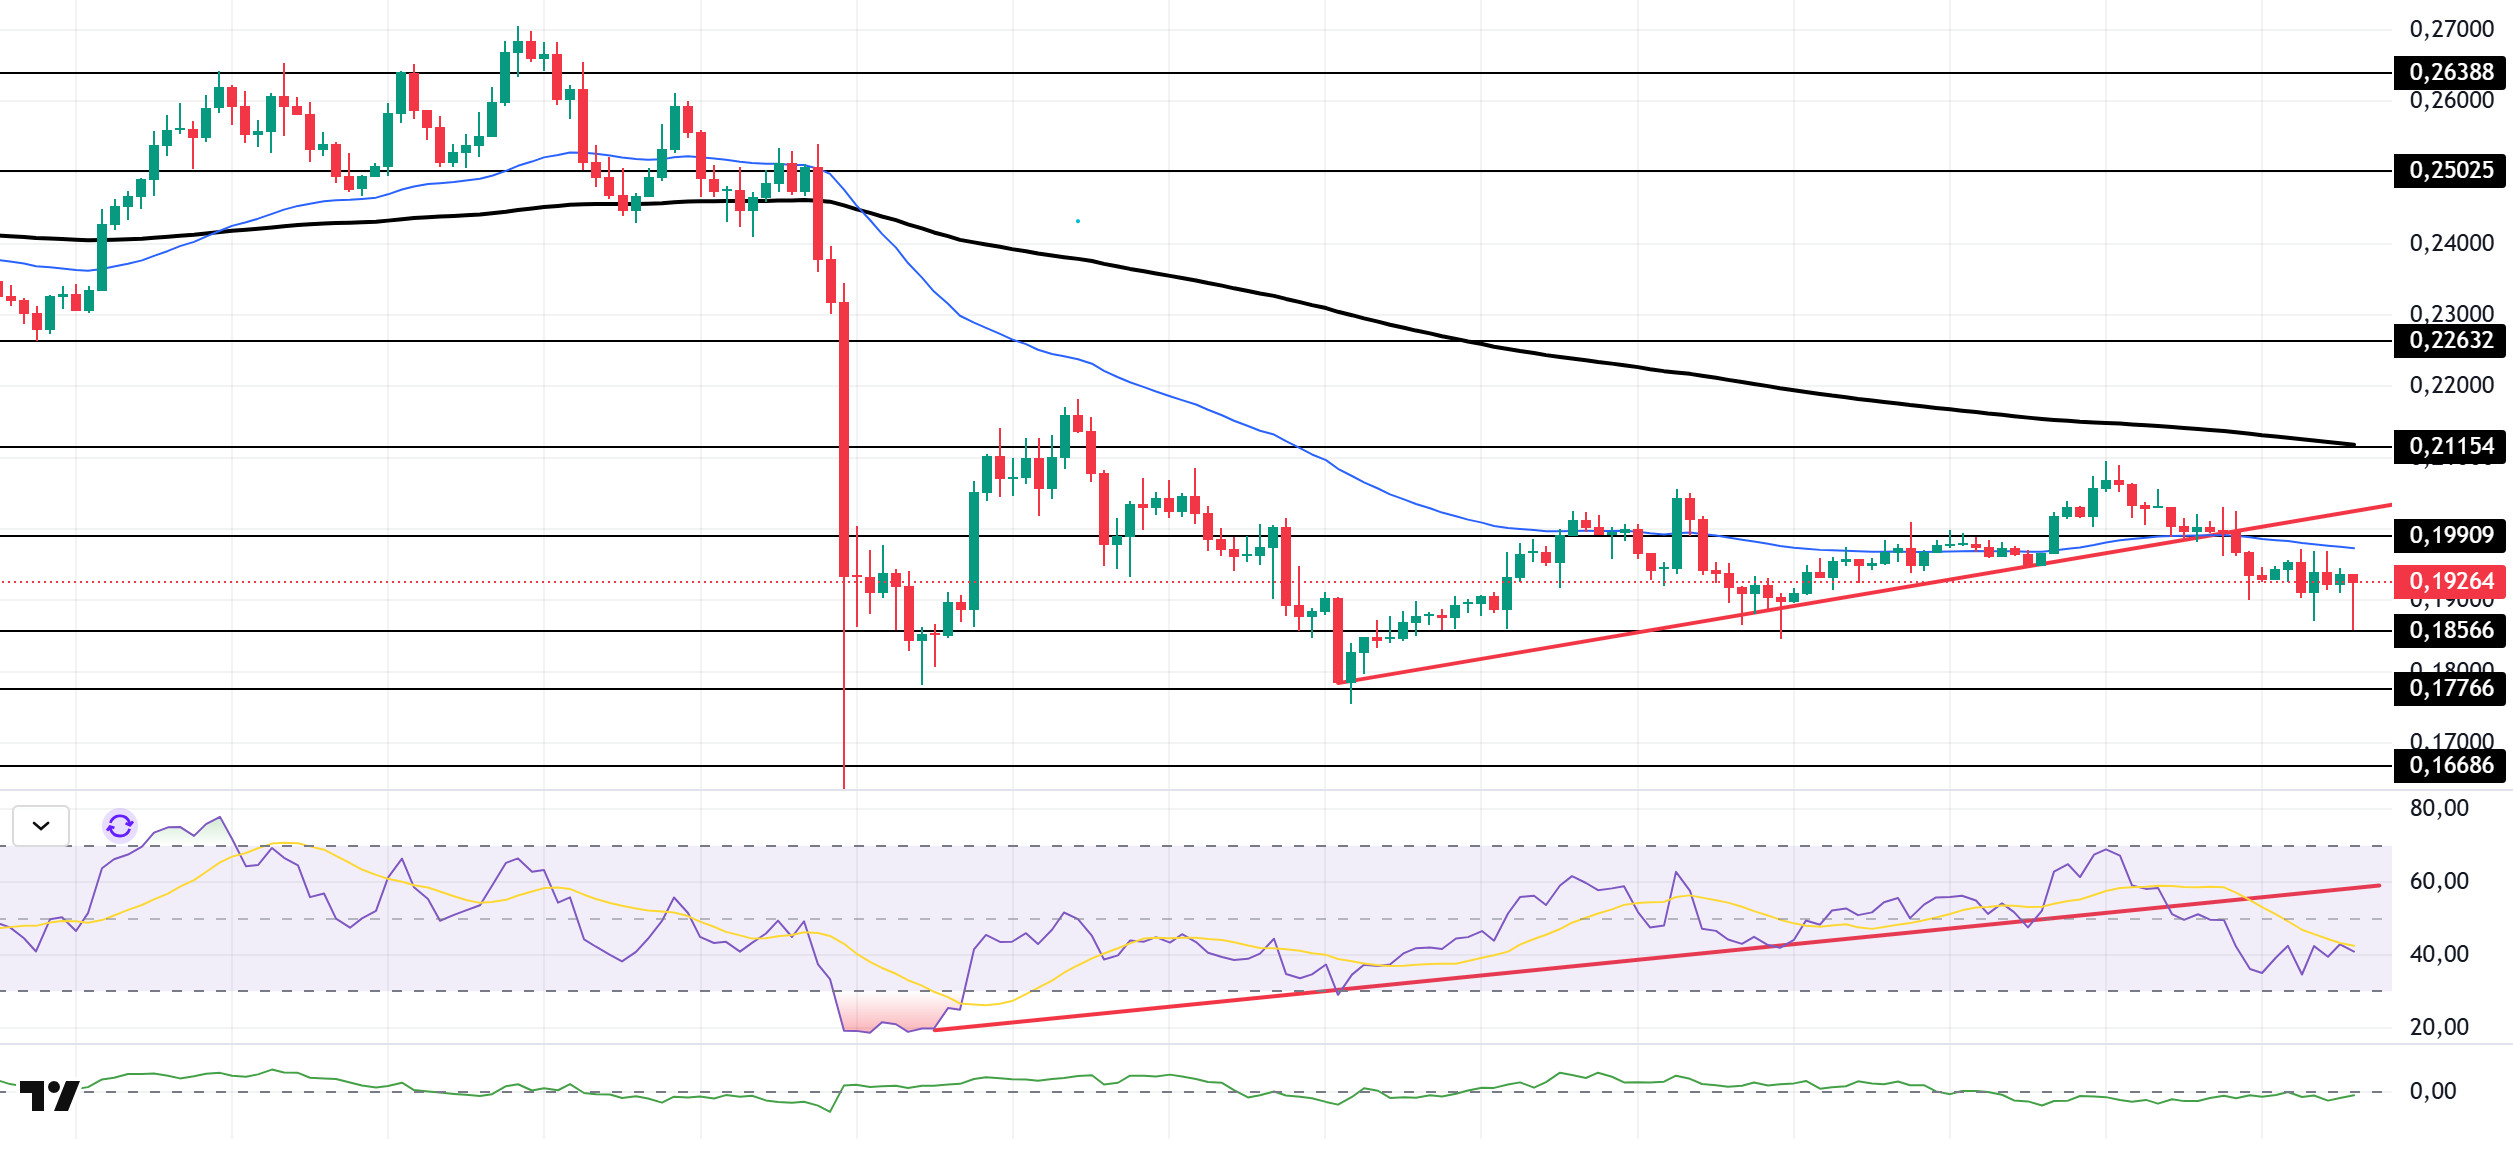
The DOGE price experienced a slight decline. The asset moved into the lower region of the upward trend that began on October 17. This signaled increased downward pressure. Currently, the asset, supported by the strong support level of $0.18566, experienced a slight increase and is preparing to test the 50 EMA (Blue Line) moving average as resistance. If the increase continues, it may test the rising trend as resistance. In case of a pullback, it may test the $0.17766 level.
On the 4-hour chart, the 50 EMA (Exponential Moving Average – Blue Line) remained below the 200 EMA (Black Line). This indicates that a downtrend may begin in the medium term. The price being below both moving averages shows that the price is trending downward in the short term. The Chaikin Money Flow (CMF-20) also remained in negative territory. Additionally, a decline in money inflows could push the CMF deeper into negative territory. The Relative Strength Index (RSI-14) began trading below the upward trend that started on October 12. This could bring selling pressure. It is also trading in the middle of negative territory. In the event of potential increases driven by political developments, macroeconomic data, or positive news flow within the DOGE ecosystem, the $0.21154 level stands out as a strong resistance zone. Conversely, in the event of negative news flow, the $0.17766 level could be triggered. A decline to these levels could increase momentum and initiate a new wave of growth.
Support levels: $0.18566 – $0.17766 – $0.16686
Resistances 0.19909 – 0.21154 – 0.22632
LINK/USDT
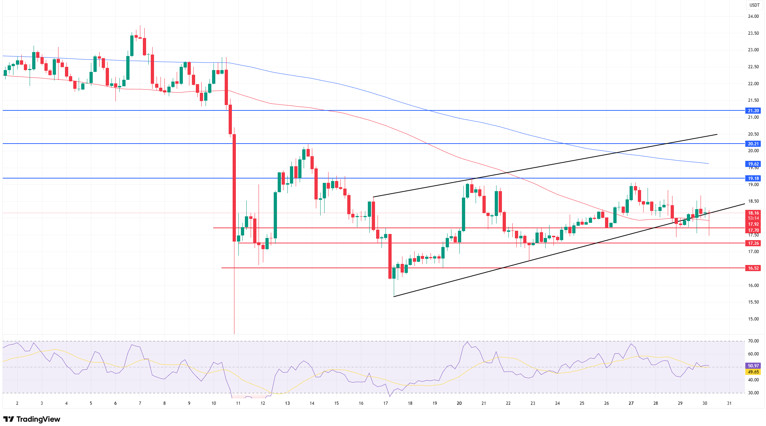
The price is attempting to hold at the critical equilibrium point we mentioned in our previous analysis. As seen in our chart, LINK has touched the lower band of the ascending channel and the area where the 100-day moving average passes. In our previous analysis, we noted that a 4-hour close below $17.70 could weaken the short-term positive structure. Indeed, the price partially confirmed our analysis’ risk scenario by dipping towards this region. However, efforts to hold above this level are continuing.
The price maintaining the $17.70–18.00 band remains critical for the continuation of the short-term upward structure. A possible rebound from this region could pave the way for the price to gain momentum towards the $19 resistance again. For the upward movement to gain strength, it is necessary to maintain stability above the $19.18 level and then break through the $20.21 band. Otherwise, if the lower band of the rising channel is broken, the risk of the price falling first to $17.26 and then to $16.52 will remain alive. It is important to note that if the price closes below our 100-day moving average, especially after losing the $17.70 level, the trend could deepen downward, potentially triggering a strong selling wave.
The Relative Strength Index (RSI) is currently hovering around 54. This indicates that the balance between buyers and sellers has neutralized and the market is searching for direction. If the RSI remains below 50, it could signal a resurgence of selling pressure, while a move above 55 could indicate that upward momentum could be regained in the short term.
The critical levels we mentioned above, namely the $17.70 support level, remain valid. If the price stays above this level, a recovery towards the $19–20 range can be expected. However, a 4-hour close below this support could trigger a move that could bring the price back to the $16.52 range.
Supports: 17.70 – 17.26 – 16.52
Resistances: 19.18 – 20.21 – 21.20
Legal Notice
The investment information, comments, and recommendations contained herein do not constitute investment advice. Investment advisory services are provided individually by authorized institutions taking into account the risk and return preferences of individuals. The comments and recommendations contained herein are of a general nature. These recommendations may not be suitable for your financial situation and risk and return preferences. Therefore, making an investment decision based solely on the information contained herein may not produce results in line with your expectations.


