Technical Analysis
BTC/USDT
U.S. Treasury Secretary Bessent said that rare earth elements, certain chemicals, and aircraft engines could be subject to negotiation in talks with China. Bessent stated that the government investment in Intel was confirmed by Nvidia’s moves and that progress had been made on Fannie Mae and Freddie Mac. While emphasizing that the government shutdown next week remains uncertain, he revealed that they are working on a plan for jobs that will be lost due to artificial intelligence. Bessent said that the Fed’s interest rates have been high for a long time and that we have entered a cycle of easing, finding it surprising that Powell has not yet given an interest rate target.
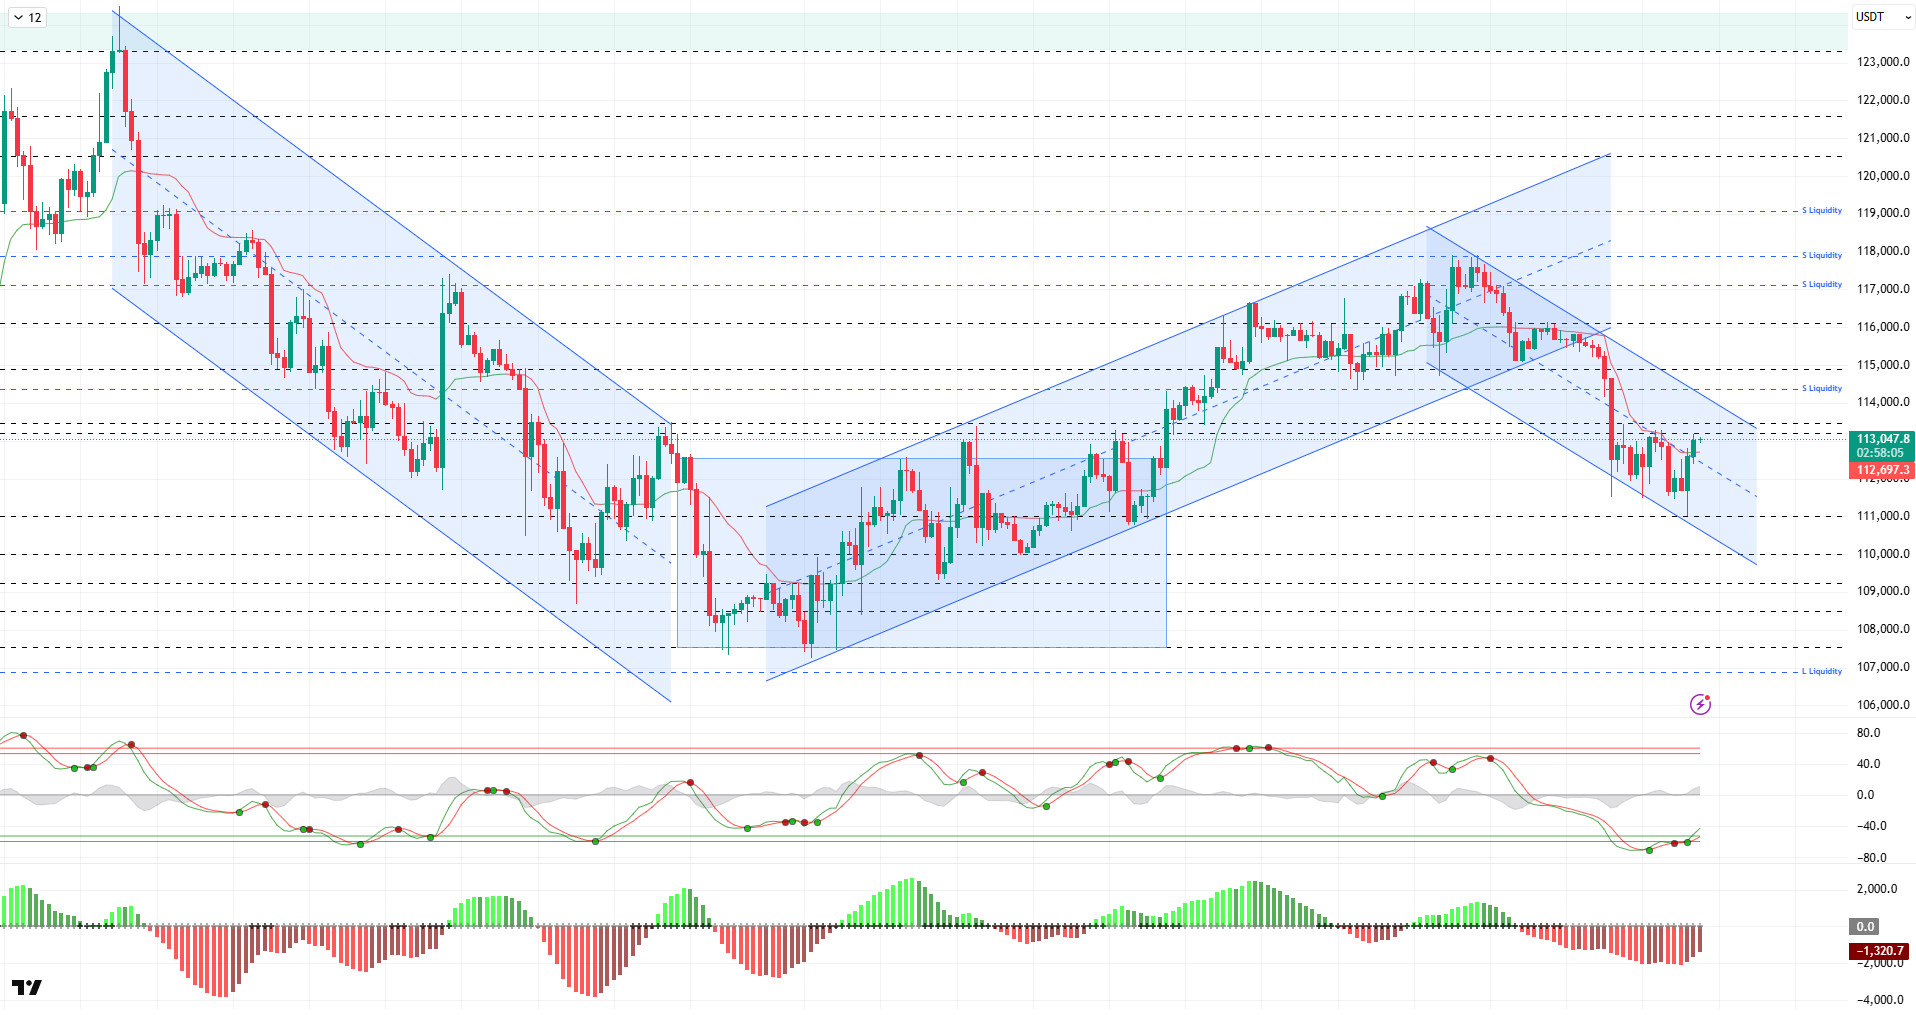
Looking at the technical picture, BTC, which tested the 113,000 level in the previous analysis, is struggling to break above this level. With the lack of catalysts for its price continuing, BTC continues to trade at 113,100 on the declining trend line at the time of writing.
Technical indicators show the Wave Trend oscillator (WT) signaling a buy in the oversold zone, preparing for a trend reversal, while the Squeeze Momentum (SM) indicator’s histogram is gaining momentum in negative territory. The Kaufman moving average is currently trading below the price at the 112,600 level.
Looking at the liquidation data, short-term transactions began to intensify around 111,000, but with yesterday’s movement, the region was liquidated again. On the sell side, there is slight concentration in the 113,500 – 114,000 range, while on the long side, there is significant concentration in the 117,800 – 119,000 range. Over the last 24 hours, the total liquidation amount was $288 million, with buy-side trades at $204 million and sell-side trades at $83 million.
In summary, while there is no clear fundamental catalyst for recent sales, the decline in futures-driven selling pressure appears to be deepening the downturn. Overall, the medium-term outlook for the market remains positive. On the technical side, a minor downward channel is being tracked, and a break above the upper level of the channel could signal a new uptrend. In terms of liquidity data, the recent decline has completely cleared the buying levels, while a significant increase in selling levels stands out. In this context, for the price to recover, it may be necessary to regain the 114,000 level in the first stage, followed by closes above 115,000. However, if selling pressure persists and the 112,600 level is broken, the next important support level to watch will be 111,400.
Support levels: 112,600 – 111,400 – 110,000
Resistance levels: 114,000 -115,000 -116,100
ETH/USDT
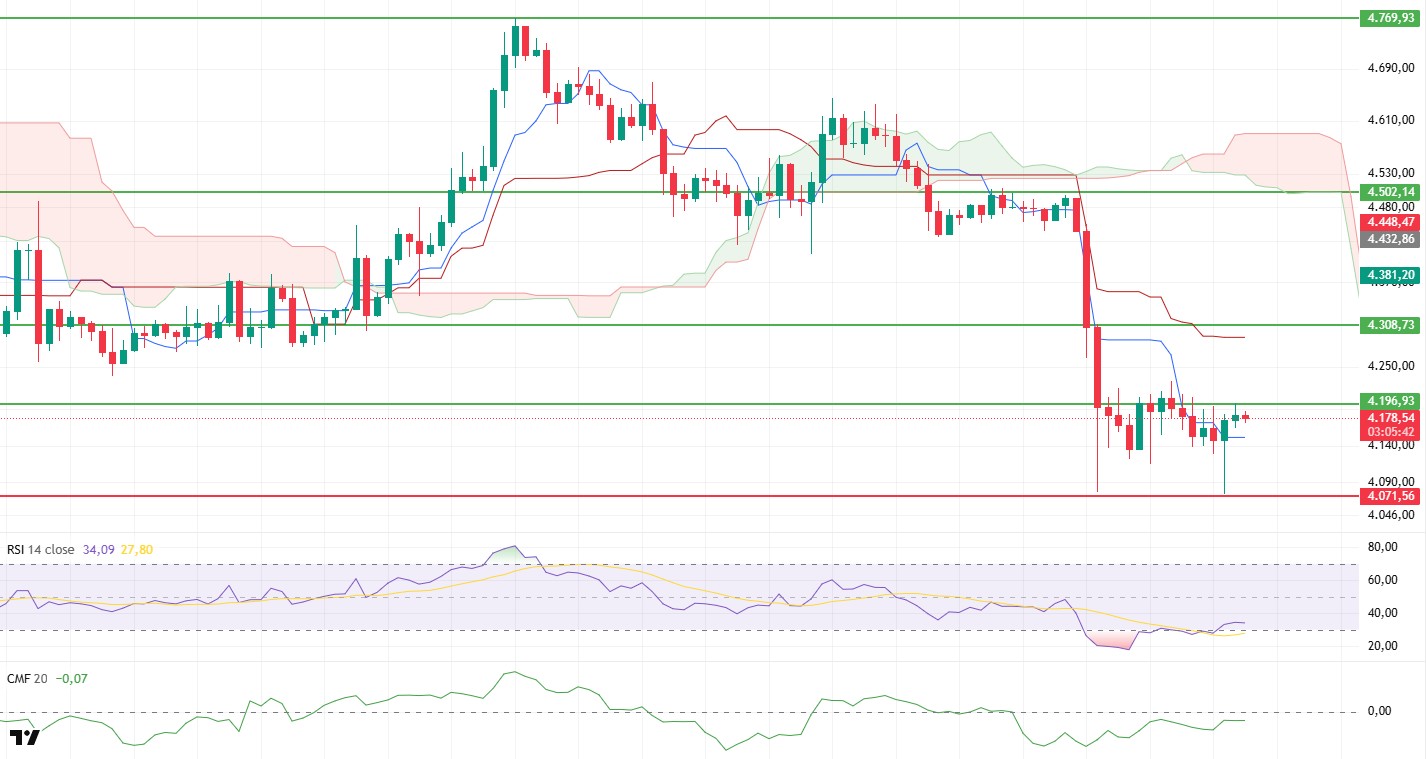
ETH found support at the $4,070 level in the morning hours and reacted upward, testing the $4,196 resistance level during the day. However, it failed to break through this level. While the gap being filled is considered positive from a technical perspective, the price struggling at the critical resistance level indicates that the market is seeking equilibrium in the short term. That said, signs of recovery seen in on-chain data suggest that the market is slowly shifting in favor of buyers.
On the momentum side, it is noteworthy that the Relative Strength Index (RSI) indicator has moved out of the oversold zone and maintained its upward momentum. This outlook confirms that the market is beginning to move away from its weak trend and that buyers are increasingly entering the market. As long as this trend in the RSI continues, the likelihood of upward movements being supported will remain high.
On the liquidity flow side, the Chaikin Money Flow (CMF) indicator approaching the zero line indicates that the rate of funds leaving the market is slowing down and that buyers’ appetite is increasing significantly. If the CMF crosses above the zero line, buyers are expected to take stronger control. This scenario provides important data supporting a short-term recovery scenario.
The fact that the price remains below the Ichimoku cloud indicates that the primary trend has not yet turned positive. However, if the Tenkan level is breached, it can be said that the upward movement could gain momentum in the short term. If the price sustains above the Tenkan level, the Kijun level may also be tested, and if the price breaks above the Ichimoku cloud, this would provide strong confirmation of a trend reversal.
In the overall view, the $4,196 level stands out as the most critical resistance point in the evening hours. If the price rises above this region, a move towards the $4,308 level can be expected. On the downside, the $4,070 support continues to maintain its importance. As long as this support level is not broken, the validity of the bullish scenario will be preserved.
Top of Form
Below the Form
Support levels: 4,196 – 4,071 – 3,940
Resistance levels: 4,308 – 4,502 – 4,769
XRP/USDT
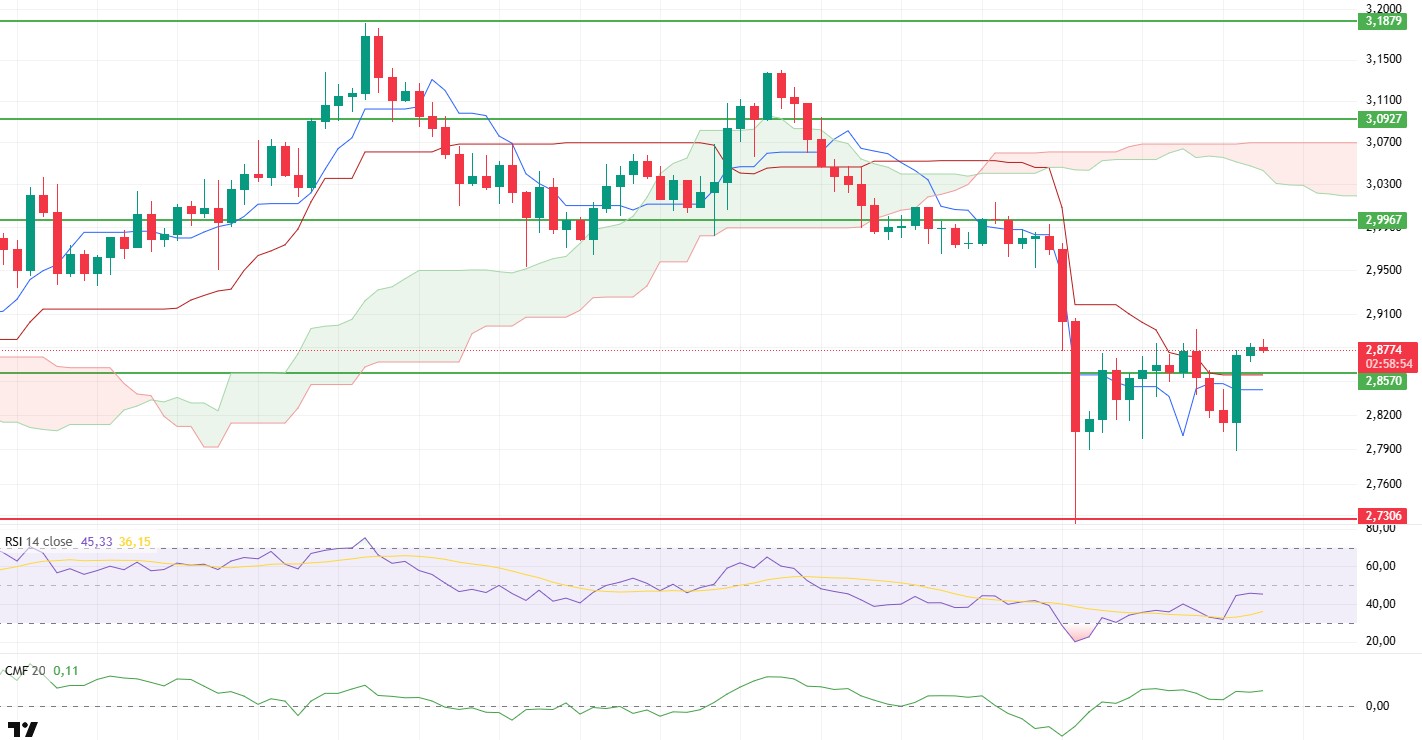
XRP dipped slightly yesterday evening to 2.79, regained the 2.85 support level this morning thanks to strong buying, and is now trading at 2.88. Holding the 2.85 level indicates that buyers have become active again, and it appears that the recovery signals observed in the morning analysis continued into the evening hours.
The Relative Strength Index (RSI) indicator continues its upward movement after exiting the oversold zone, signaling that momentum is strengthening. The Chaikin Money Flow (CMF) indicator remaining in positive territory and maintaining its upward momentum confirms that liquidity inflows are continuing and capital flows are concentrated on the buyer side. The alignment between RSI and CMF strengthens the technical foundation for short-term upward movements.
In the Ichimoku indicator, the price being above the Tenkan and Kijun levels supports the short-term positive scenario. The Kumo cloud still stands as a resistance zone that needs to be overcome, but if the price remains above the Tenkan and Kijun, buyers’ control will become more pronounced. A sustainable settlement above the Kumo cloud will provide stronger confirmation for a trend reversal.
From a technical perspective, 2.85 stands out as the most critical short-term support level; as long as it remains above this level, attempts towards 2.92 and then 2.99 can be expected. A sustained break above 2.99 could open the door to a broader uptrend in the medium term. On the other hand, closes below 2.85 indicate that momentum may be weakening and increase the likelihood of a pullback towards the 2.73 support level.
Support levels: 2.8570 – 2.7306 – 2.6513
Resistance levels: 2.9967 – 3.0927 – 3.1879
SOL/USDT
Fitness equipment retailer Fitell Corporation (NASDAQ: FTEL) is turning to the cryptocurrency sector with a $100 million Solana treasury and changing its brand name to “Solana Australia Corporation.”
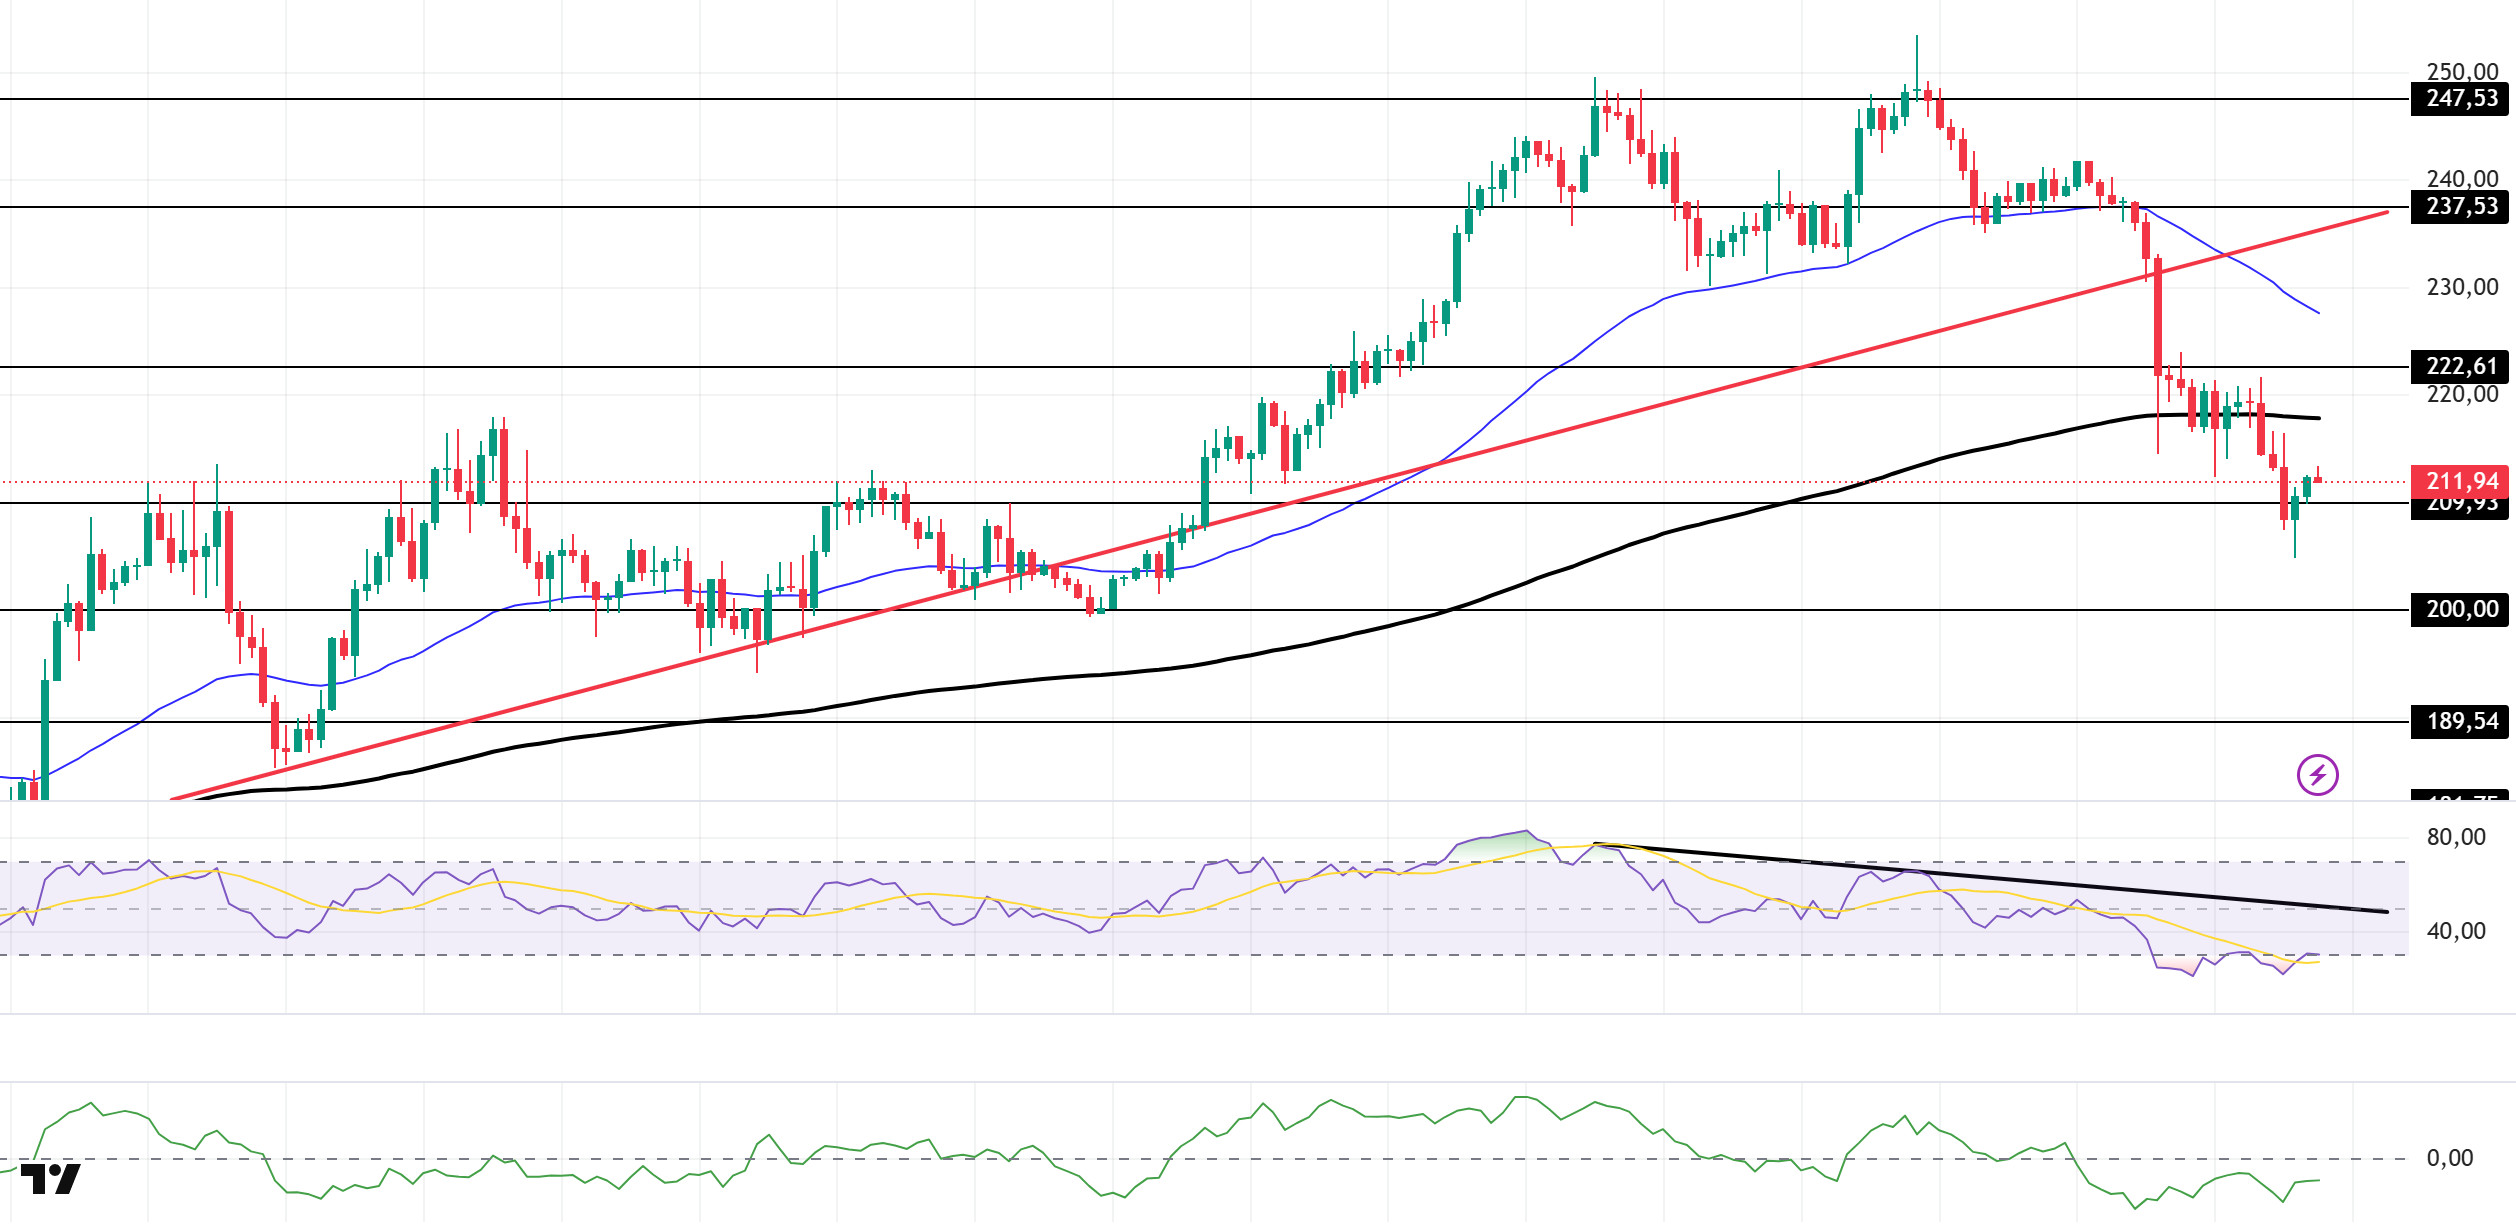
The SOL price experienced a slight increase during the day. The asset remained in the lower region of the upward trend that began on August 22. As of now, the price has broken above the strong resistance level of $209.93. If the pullback continues, it could test the $200.00 level. If the price closes above the 200 EMA, the $222.61 level could be targeted.
The price remained above the 50 EMA (Exponential Moving Average – Blue Line) and 200 EMA (Black Line) on the 4-hour chart. This indicates that the upward trend may continue in the medium term. At the same time, the price being below both moving averages shows us that the market is trending downward in the short term. The Chaikin Money Flow (CMF-20) remained in negative territory. However, an increase in cash inflows could push the CMF into positive territory. The Relative Strength Index (RSI-14) remained in oversold territory. This could lead to minor corrections. At the same time, it continued to remain below the downward trend that began on September 14, indicating that selling pressure continues. If there is an upturn due to macroeconomic data or positive news related to the Solana ecosystem, the $222.61 level stands out as a strong resistance point. If this level is broken upwards, the uptrend is expected to continue. If there are pullbacks due to developments in the opposite direction or profit-taking, the $200.00 level could be tested. A decline to these support levels could increase buying momentum, presenting a potential upside opportunity.
Support levels: 209.93 – 200.00 – 189.54
Resistance levels: 222.61 – 237.53 – 247.53
DOGE/USDT
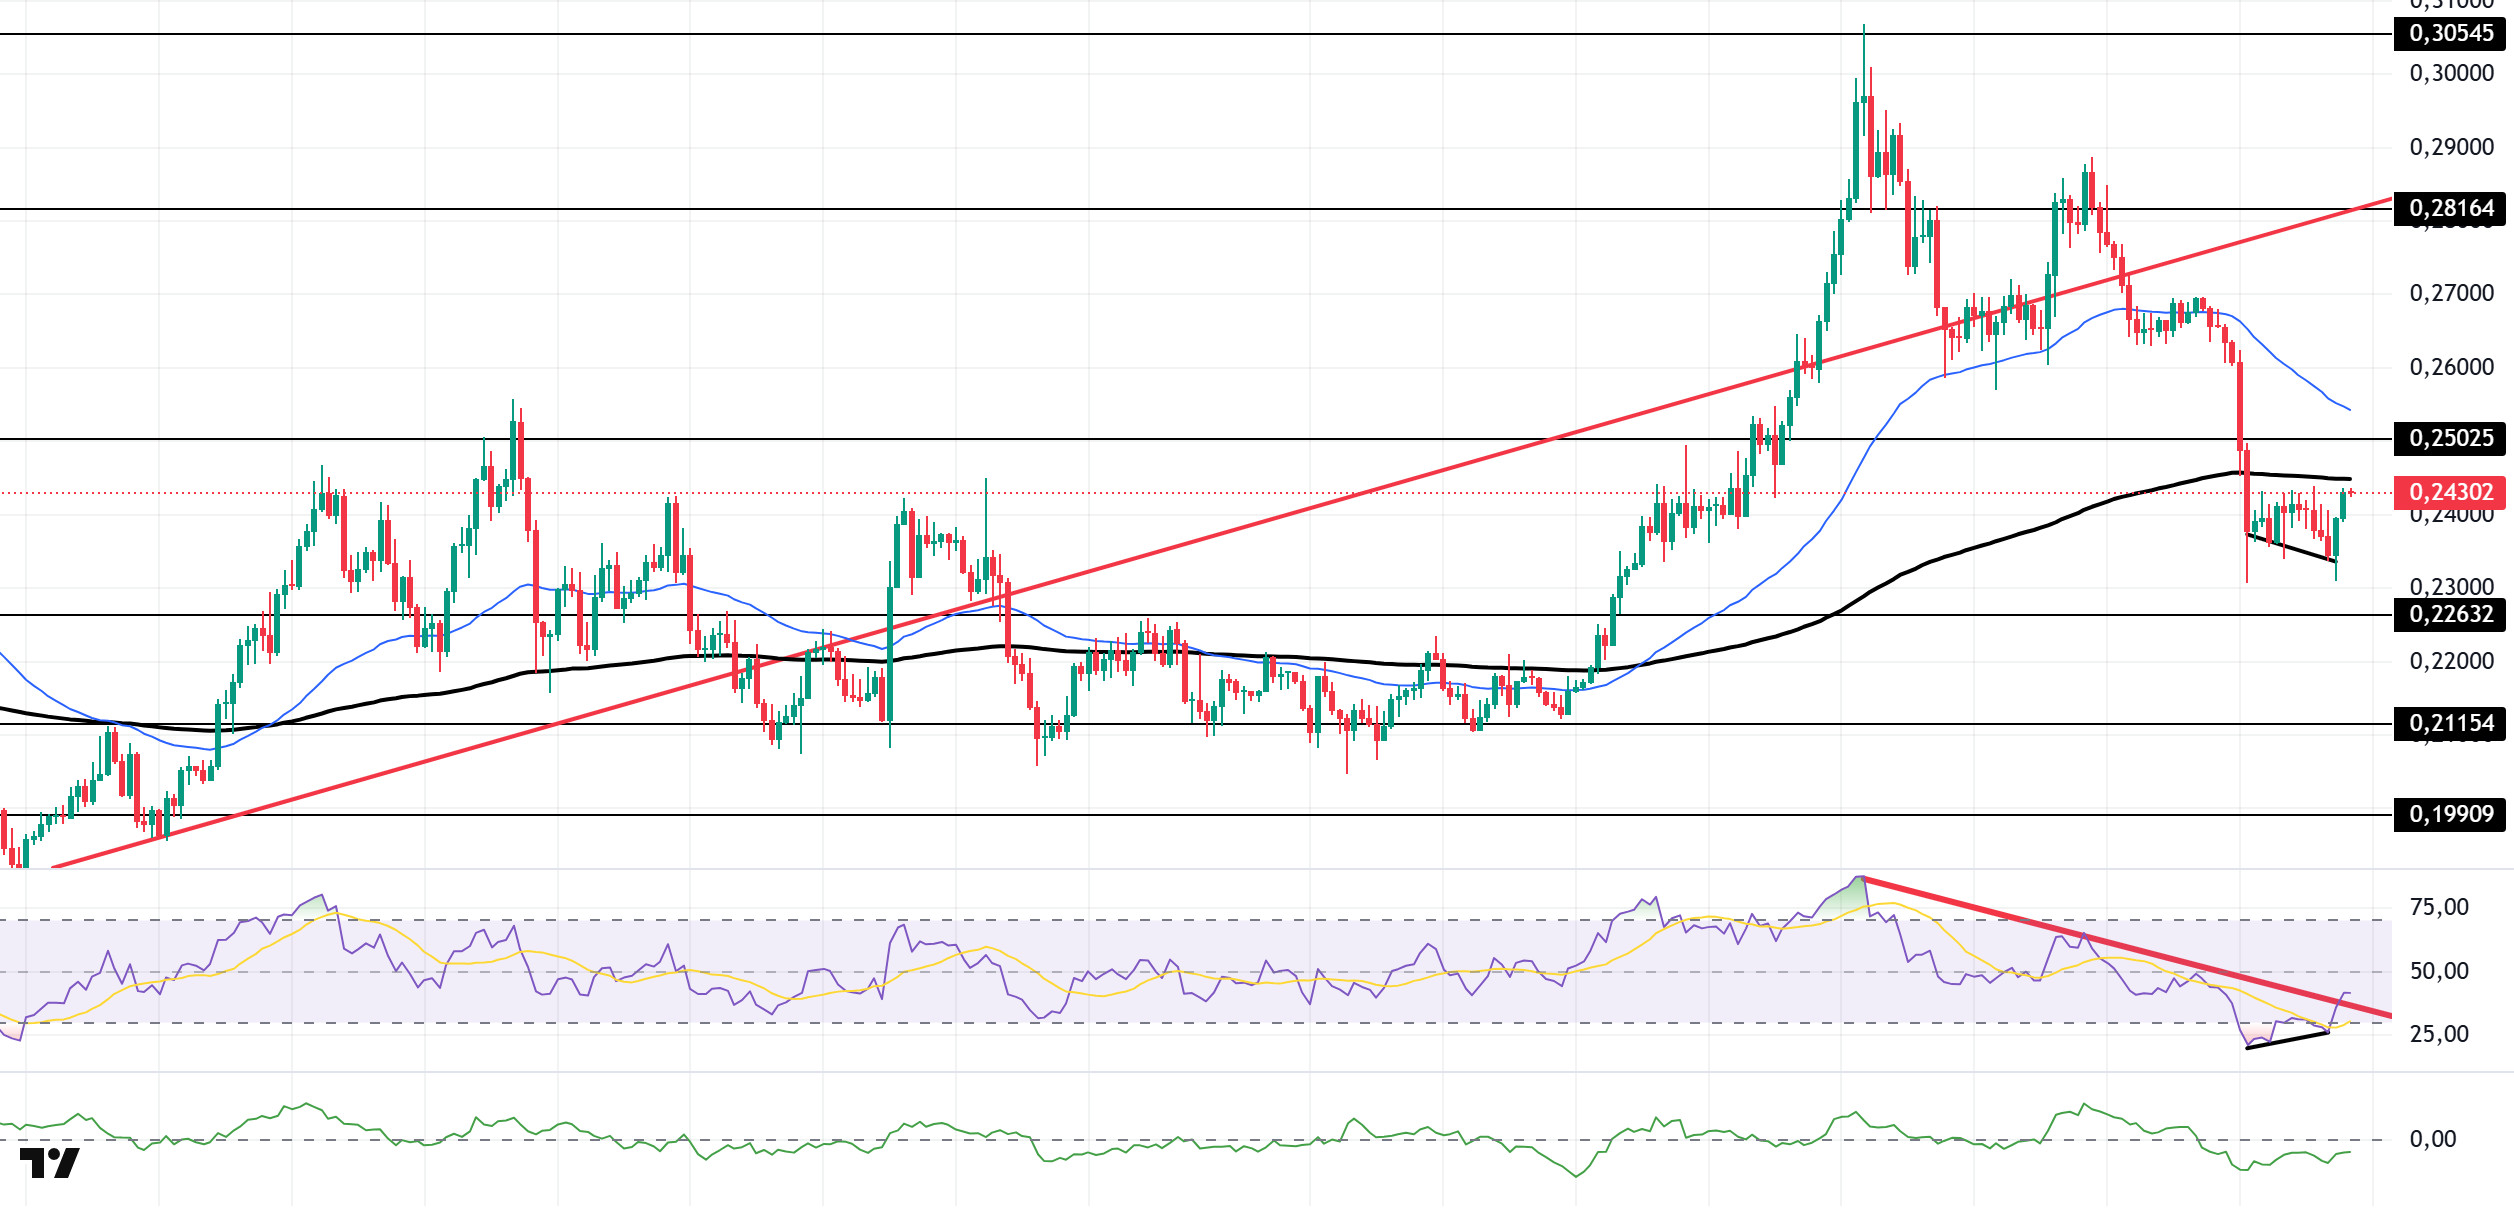
The DOGE price showed an upward trend during the day. The asset tested the strong support level of $0.25025 and broke below it, moving into the lower region of the 200 EMA (Exponential Moving Average – Black Line). Currently testing the 200 EMA moving average as resistance, the price could test the $0.25025 level if it closes above the 200 EMA. If the pullback continues, it could test the $0.22632 level.
On the 4-hour chart, the 50 EMA (Exponential Moving Average – Blue Line) remained above the 200 EMA (Black Line). This indicates that the medium-term upward trend is continuing. The price being below both moving averages indicates a downward trend in the short term. The Chaikin Money Flow (CMF-20) remained in negative territory. Additionally, an increase in money inflows could push the CMF into positive territory. The Relative Strength Index (RSI-14) rose from the oversold zone to the middle of the negative zone. At the same time, it signaled the formation of buying pressure by moving to the upper region of the downtrend that began on September 13. However, positive divergence could strengthen the upward movement. In the event of a rise due to political developments, macroeconomic data, or positive news flow in the DOGE ecosystem, the $0.28164 level stands out as a strong resistance zone. Conversely, in the event of negative news flow, the $0.21154 level could be triggered. A decline to these levels could increase momentum and initiate a new wave of growth.
Support levels: $0.22632 – $0.21154 – $0.19909
Resistance levels: 0.25025 – 0.28164 – 0.30545
TRX/USDT
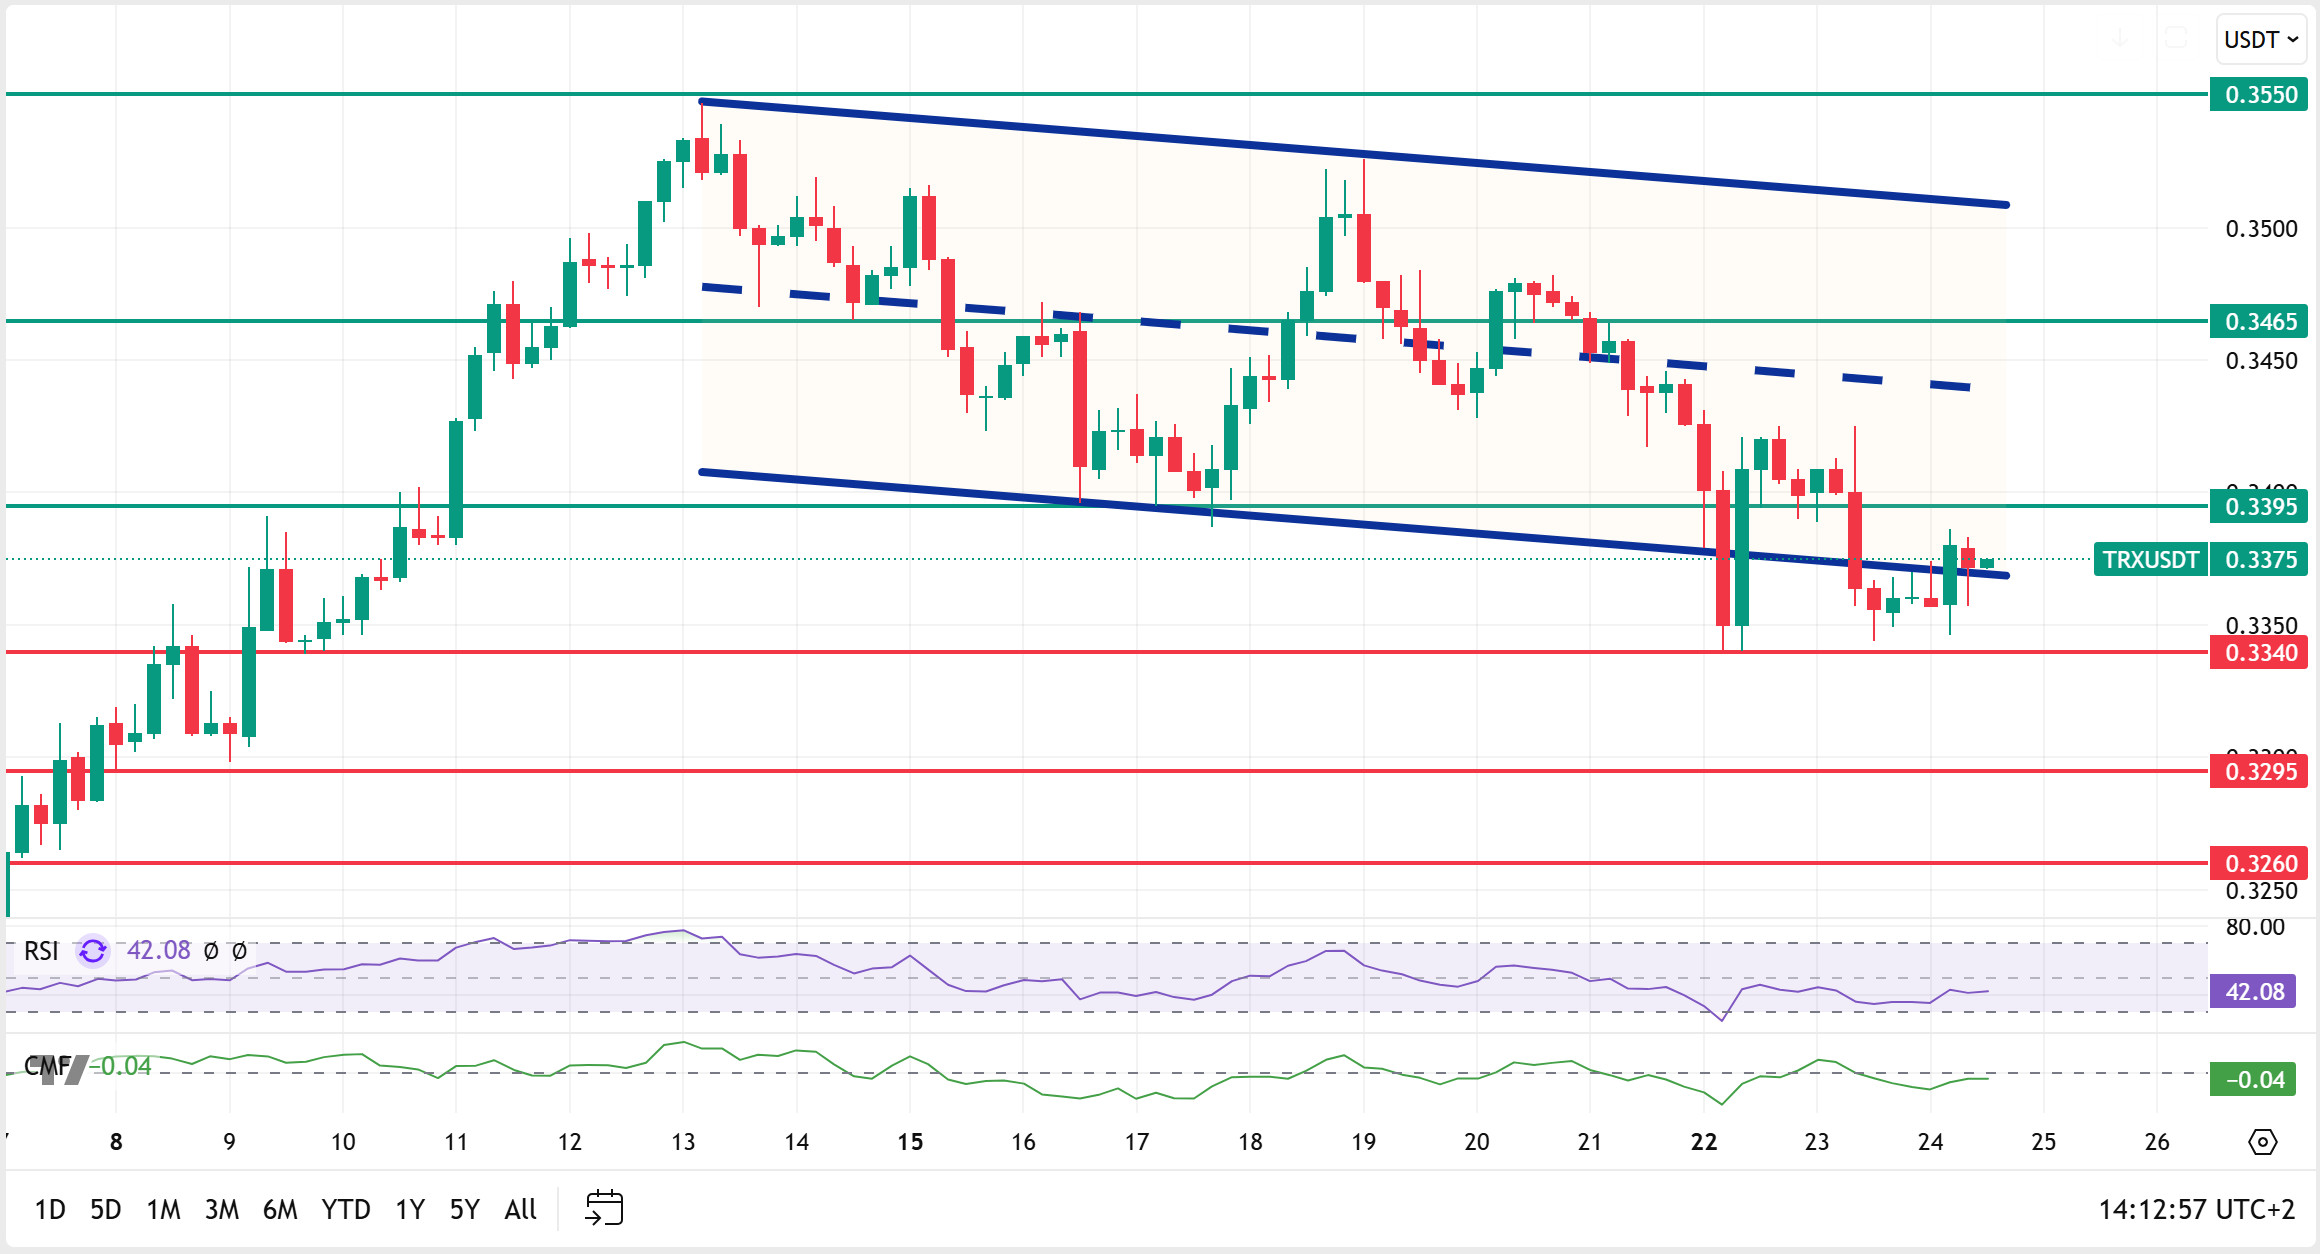
As mentioned in this morning’s analysis, TRX managed to stay above the 0.3340 support level after the decline and is currently trading at 0.3375, supported by the lower band of the bearish channel. Currently just above the lower band of the bearish channel, TRX is trading very close to the 0.3395 resistance level on the 4-hour chart. The Relative Strength Index (RSI) value of 42 indicates that it is in the sell zone. In addition, the Chaikin Money Flow (CMF) indicator continues to remain below zero with a value of -0.04, indicating a decrease in cash inflows. The CMF remaining in negative territory can be considered an indicator that the price may experience a decline.
In light of all these indicators, TRX may rise slightly in the second half of the day and move towards the middle band of the bearish channel. In this case, it may test the 0.3395 resistance level. If it closes above this resistance level, it may continue its upward movement and then test the 0.3465 resistance level after breaking through the middle band of the channel. If the candle does not close above the 0.3395 resistance level, the CMF may remain in negative territory, causing inflows to weaken significantly. Following a possible decline in price, it may test the 0.3340 support level.
On the 4-hour chart, 0.3260 is an important support level, and as long as it remains above this level, the upward momentum is expected to continue. If this support level is broken, selling pressure may increase.
Support levels: 0.3340 – 0.3295 – 0.3260
Resistance levels: 0.3395 – 0.3465 – 0.3550
Legal Notice
The investment information, comments, and recommendations contained herein do not constitute investment advice. Investment advisory services are provided individually by authorized institutions taking into account the risk and return preferences of individuals. The comments and recommendations contained herein are of a general nature. These recommendations may not be suitable for your financial situation and risk and return preferences. Therefore, making an investment decision based solely on the information contained herein may not produce results in line with your expectations.