
Technical Analysis
BTC/USDT
While technology CEOs gathered at a meeting held at the White House, Elon Musk did not attend. Trump called on Europe to stop buying Russian oil and wanted economic pressure to be applied to China. The SEC announced that it would focus on exemptions, safe harbors, and trading rules on national exchanges in its crypto policy agenda. On-chain data showed a donation of 10 BTC to an address linked to Ukraine. MARA Holdings produced 705 BTC in August, bringing its total stock to 52,477 BTC. August employment data showed ADP growth at 54,000, below expectations, while jobless claims rose to 237,000 and continuing claims approached 1.94 million. This weakness reinforced pricing for a 25-basis-point cut by the Fed in September. NY Fed President Williams stated that cuts are now appropriate, while Cleveland Fed’s Harker disagreed; Chicago Fed President Goolsbee described the September meeting as “live.” Today, all eyes will be on U.S. non-farm payroll and unemployment data. In the options market, 30,000 BTC and 300,000 ETH contracts will expire.
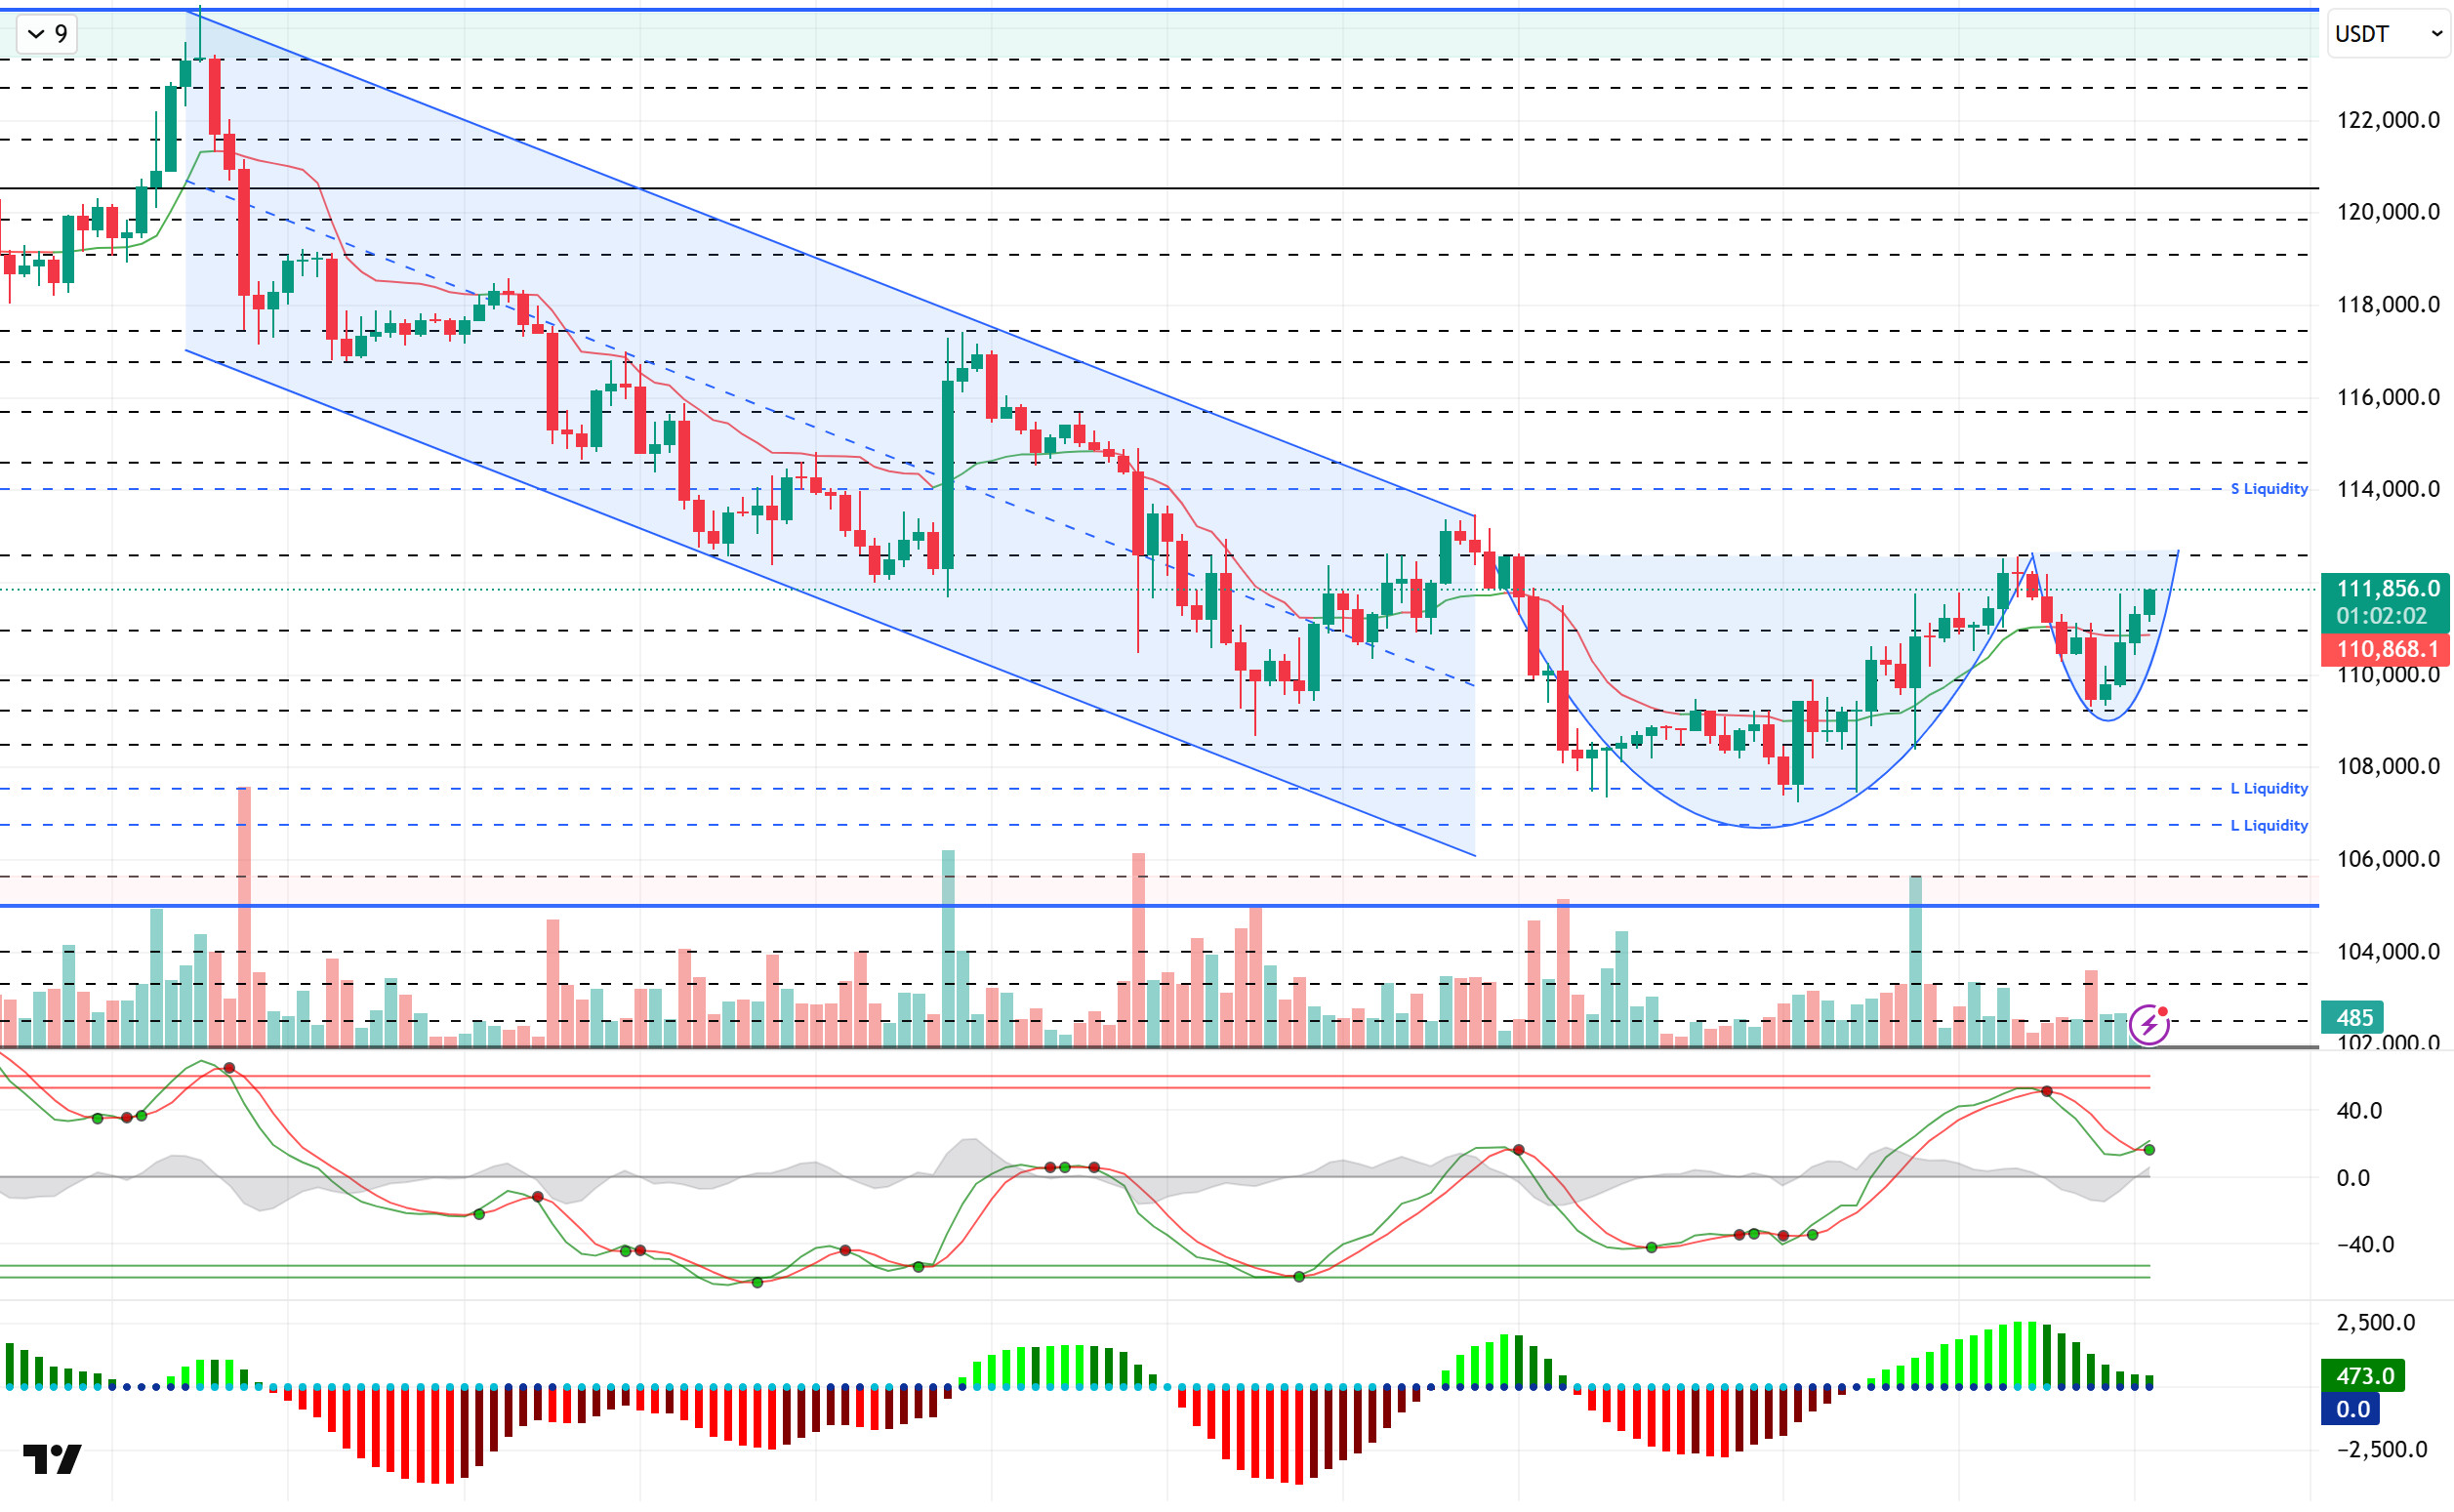
Looking at the technical picture, with the downward trend turning into a horizontal trend, the cup formation in BTC appears to be complete, while the handle part continues. Once the handle part of the formation is complete, upward movements could gain momentum. BTC, which exhibited volatile movements, had declined to the 109,000 level with a bearish outlook in the previous analysis. The price, which has rebounded again, continues to trade at the 111,600 level at the time of writing this analysis.
Technical indicators show the Wave Trend oscillator (WT) turning upward once again with a buy signal in the middle band of the channel, while the Squeeze Momentum (SM) indicator’s histogram continues to show weakness in positive territory. The Kaufman moving average is currently below the price, moving at the 110,800 level.
Looking at liquidity data, short-term accumulation of sell-side transactions has intensified once again at the 112,600 level. Sell-side accumulation in the broader time frame has thinned out at the 114,000 level. The buying level has started to accumulate at the 109,000 level in the short term, while the 106,500 – 107,500 band continues to be a more intense accumulation zone.
In summary, the disappearance of the recent optimistic mood due to fundamental developments, along with discussions among Fed members about interest rate cuts and new task distributions, and the continued presence of tariffs on the agenda, stand out as factors putting pressure on prices. Technically, while the formation of a suitable ground for a new upward movement created some recovery, it was noteworthy that the increases remained in the form of liquidity purchases. The upward movement could turn into a trend if new catalysts reappear in the market and create a driving force on the price. In this context, 112,600 stands out as a critical reference and liquidity area for the continuation of the upward movement. Breaking this level could allow the price to gain momentum and bring a movement towards the 114,000 level. In the event of potential selling pressure, a break below 110,000 could bring us to the 108,500 level.
Supports: 108,500 – 107,400 – 105,000
Resistances: 111,000 – 112,600 – 114,000
ETH/USDT
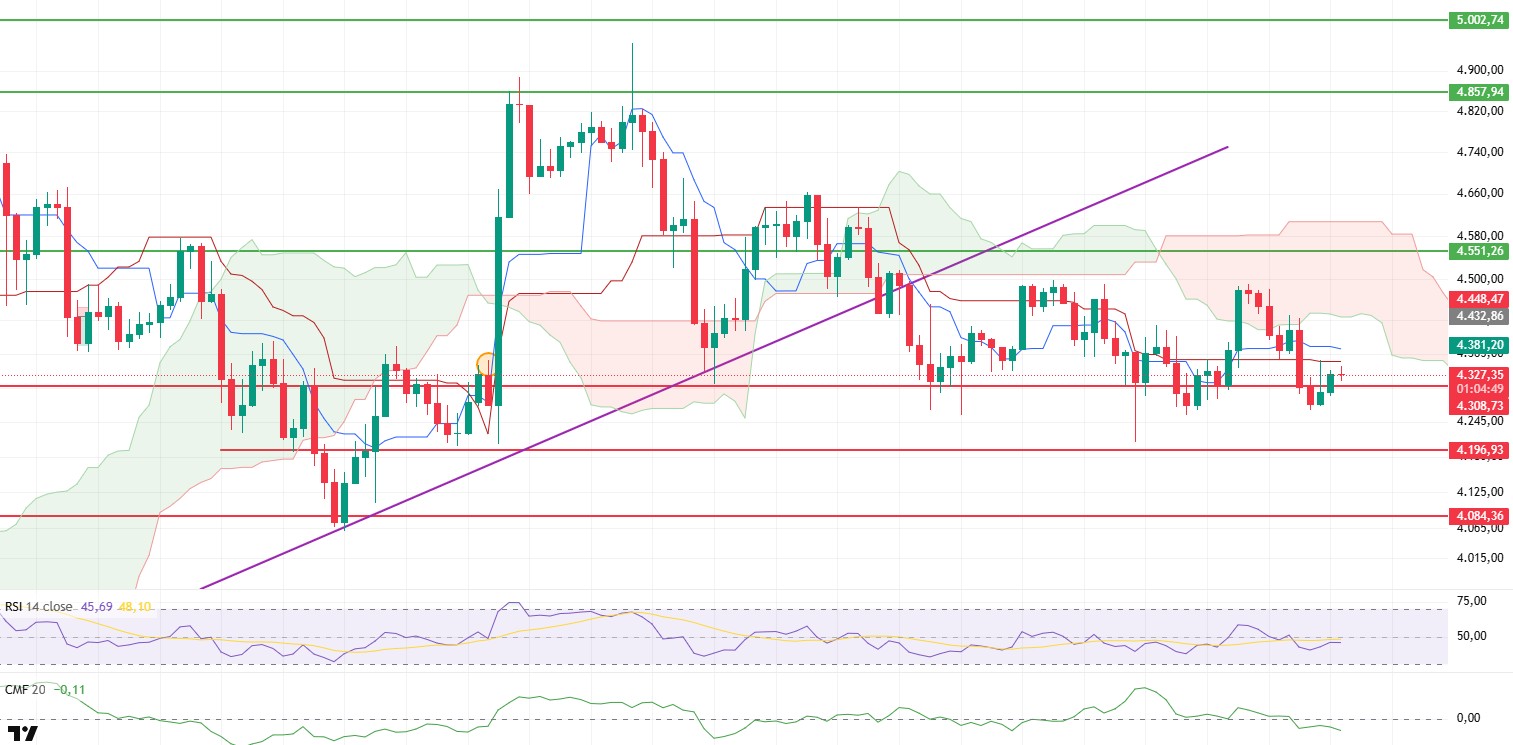
The ETH price came under selling pressure yesterday evening after being rejected from the lower band of the kumo cloud and quickly fell to the $4,260 level. Buyers stepped in at this level, allowing the price to recover and rise back above the $4,308 level. However, this recovery was limited, and the price continues to trade below critical levels, highlighting the fragility of the markets.
Looking at the Ichimoku indicator, the price staying below the Tenkan, Kijun, and kumo cloud shows that the negative trend is continuing. This view indicates that the price is under pressure in the short term and that upward movements are unlikely to be sustained without strong volume support. In particular, it seems difficult for the positive scenario to gain strength without closing above the cloud level.
On the liquidity side, the Chaikin Money Flow (CMF) indicator turning negative indicates that fund outflows are accelerating in the market and investors are beginning to avoid risk. This situation is particularly noteworthy ahead of today’s US non-farm payrolls data release. A deviation from expectations in the data could increase volatility and cause sharp price movements in ETH.
Technically, the $4,308 level stands out as short-term support. A drop below this level would increase the likelihood of a pullback towards the $4,260 and $4,196 levels. On the upside, $4,551 is being monitored as the main resistance. A sustained break above this level could enable the price to accelerate towards the $4,650 region. The ETH price is stuck between critical support and resistance levels. The negative technical outlook is making it difficult for buyers, while the uncertainty ahead of the US data is causing the market to move cautiously. During the day, the 4,308 support and 4,551 resistance levels stand out as the most critical thresholds that will determine the price’s direction.
Top of Form
Below the Form
Support levels: 4,308 – 4,196 – 4,084
Resistance levels: 4,551 – 5,857 – 5,000
XRP/USDT
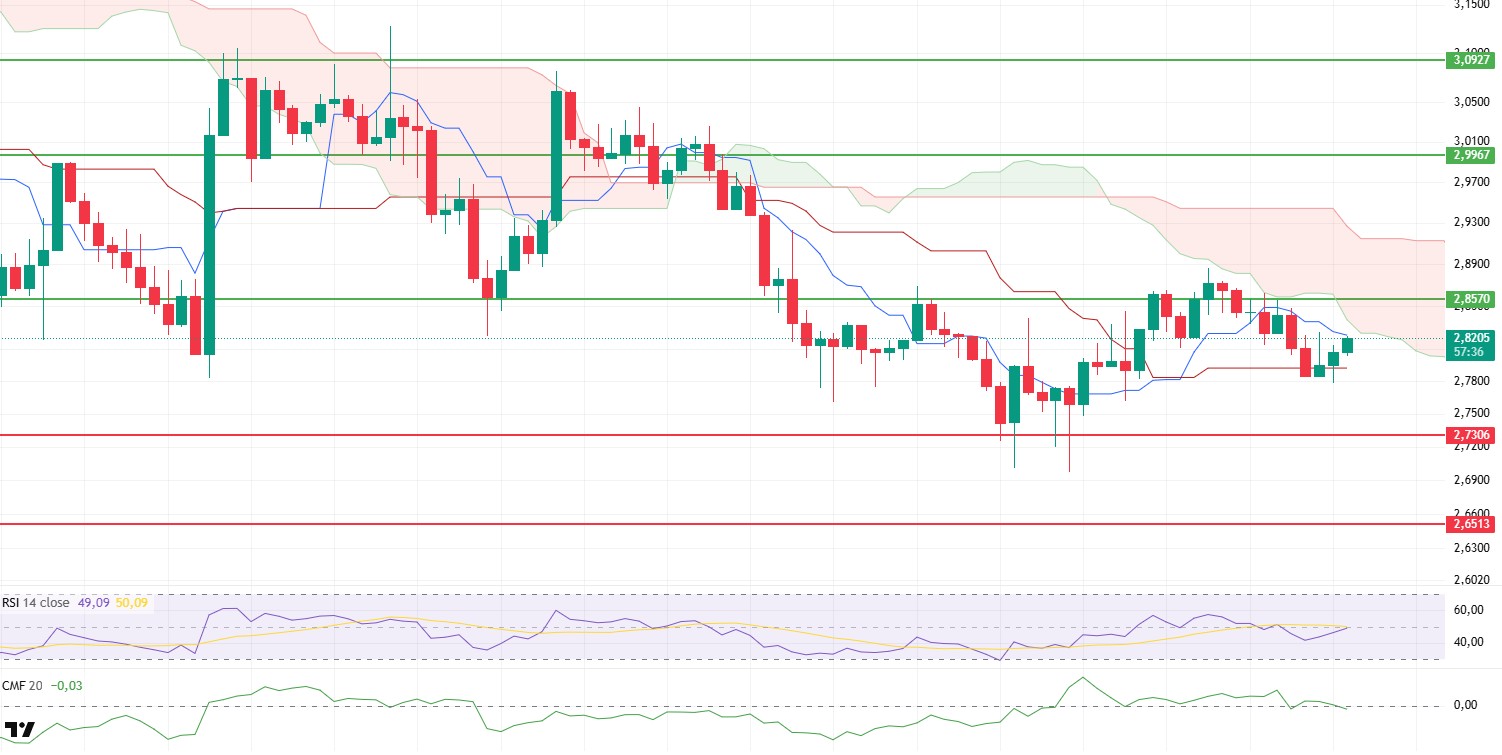
The XRP price retreated yesterday evening due to selling pressure from the $2.8570 resistance level, falling to the $2.78 level. The price recovered slightly with buying from this area and rose back above the $2.81 level. However, the limited movement maintains the cautious outlook in the market.
In the Ichimoku indicator, the price being squeezed between the Tenkan and Kijun levels presents an uncertain picture. In the short term, breaking above the lower band of the 2.83 dollar kumo cloud could accelerate the upward movement, while breaking below the 2.79 dollar Kijun level could increase selling pressure and deepen the decline.
On the momentum side, the Relative Strength Index (RSI) reaching both the 50 level and its moving average is a short-term positive signal. This outlook indicates that the price is starting to gather strength and supports a possible upward attempt.
On the liquidity side, the Chaikin Money Flow (CMF) indicator turning negative is noteworthy. This view reveals that investors are avoiding risk ahead of today’s US non-farm payrolls data release. If the data differs from expectations, it could increase volatility and play a decisive role in the price direction.
From a technical perspective, the $2.83 level stands out as a critical resistance point that could push the price back to $2.8570 and then to the $2.99 region if broken upwards. Below, the Kijun at the $2.79 level is the first support position. If this level is lost, pullbacks towards the $2.78 and $2.73 levels may come into play. Ahead of the US data, the $2.83 and $2.79 levels stand out as the most critical thresholds of the day.
Support levels: 2.7306 – 2.6513 – 2.4730
Resistance levels: 2.8570 – 2.9967 – 3.0927
SOL/USDT
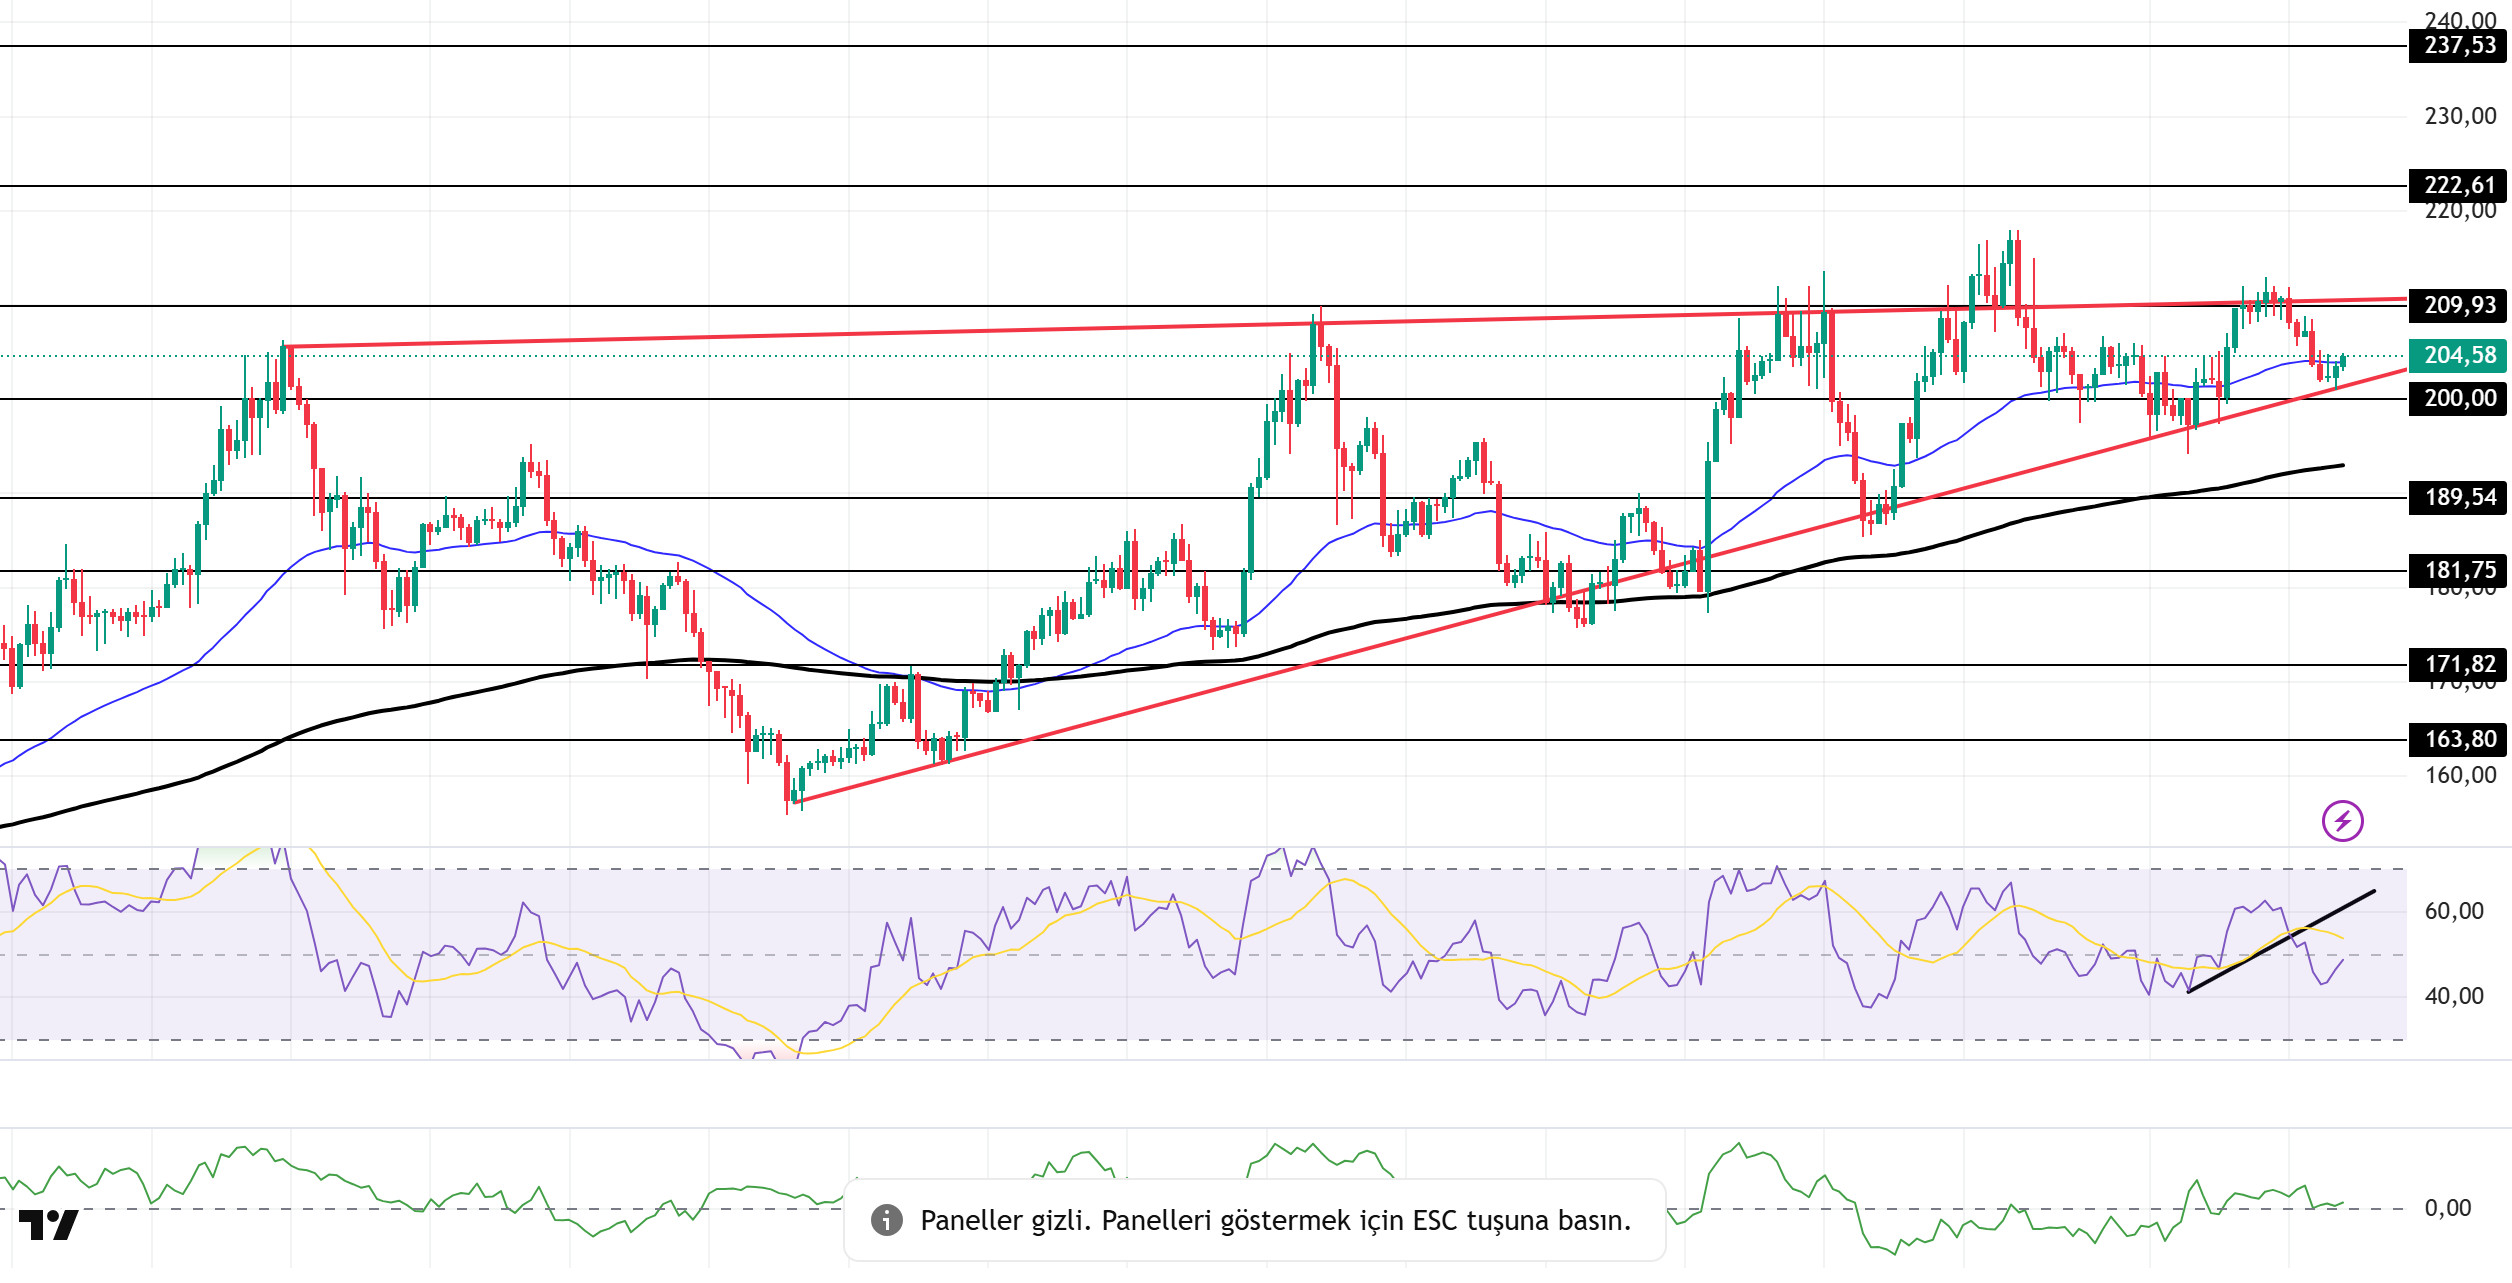
The SOL price continued to move within a narrow range. The asset remained within the ascending wedge formation that began on August 2. After encountering resistance at the top of the formation and retreating, the price is currently showing a slight increase, supported by the bottom of the formation, and is testing the 50 EMA (Exponential Moving Average – Blue Line), which is a strong resistance level. If the price closes below the 50 EMA, the $200.00 level can be monitored. If it experiences an upward movement, the $209.93 level could be triggered.
On the 4-hour chart, it remained above the 50 EMA (Exponential Moving Average – Blue Line) and 200 EMA (Black Line). This indicates that the medium-term upward trend may continue. At the same time, the price being between the two moving averages shows us that the market is in a decision phase in the short term. The Chaikin Money Flow (CMF-20) remained in positive territory. However, an increase in inflows could push the CMF to the upper levels of the positive zone. The Relative Strength Index (RSI-14) moved into negative territory. It also continues to be in the lower region of the upward trend that began on September 1. This indicates that selling pressure could build. If there is an uptrend due to macroeconomic data or positive news related to the Solana ecosystem, the $222.61 level stands out as a strong resistance point. If this level is broken upwards, the uptrend is expected to continue. If there are pullbacks due to developments in the opposite direction or profit-taking, the $189.54 level may be tested. A retreat to these support levels could increase buying momentum, presenting a potential opportunity for an uptrend.
Supports: 200.00 – 189.54 – 181.75
Resistances: 209.93 – 222.61 – 237.53
DOGE/USDT
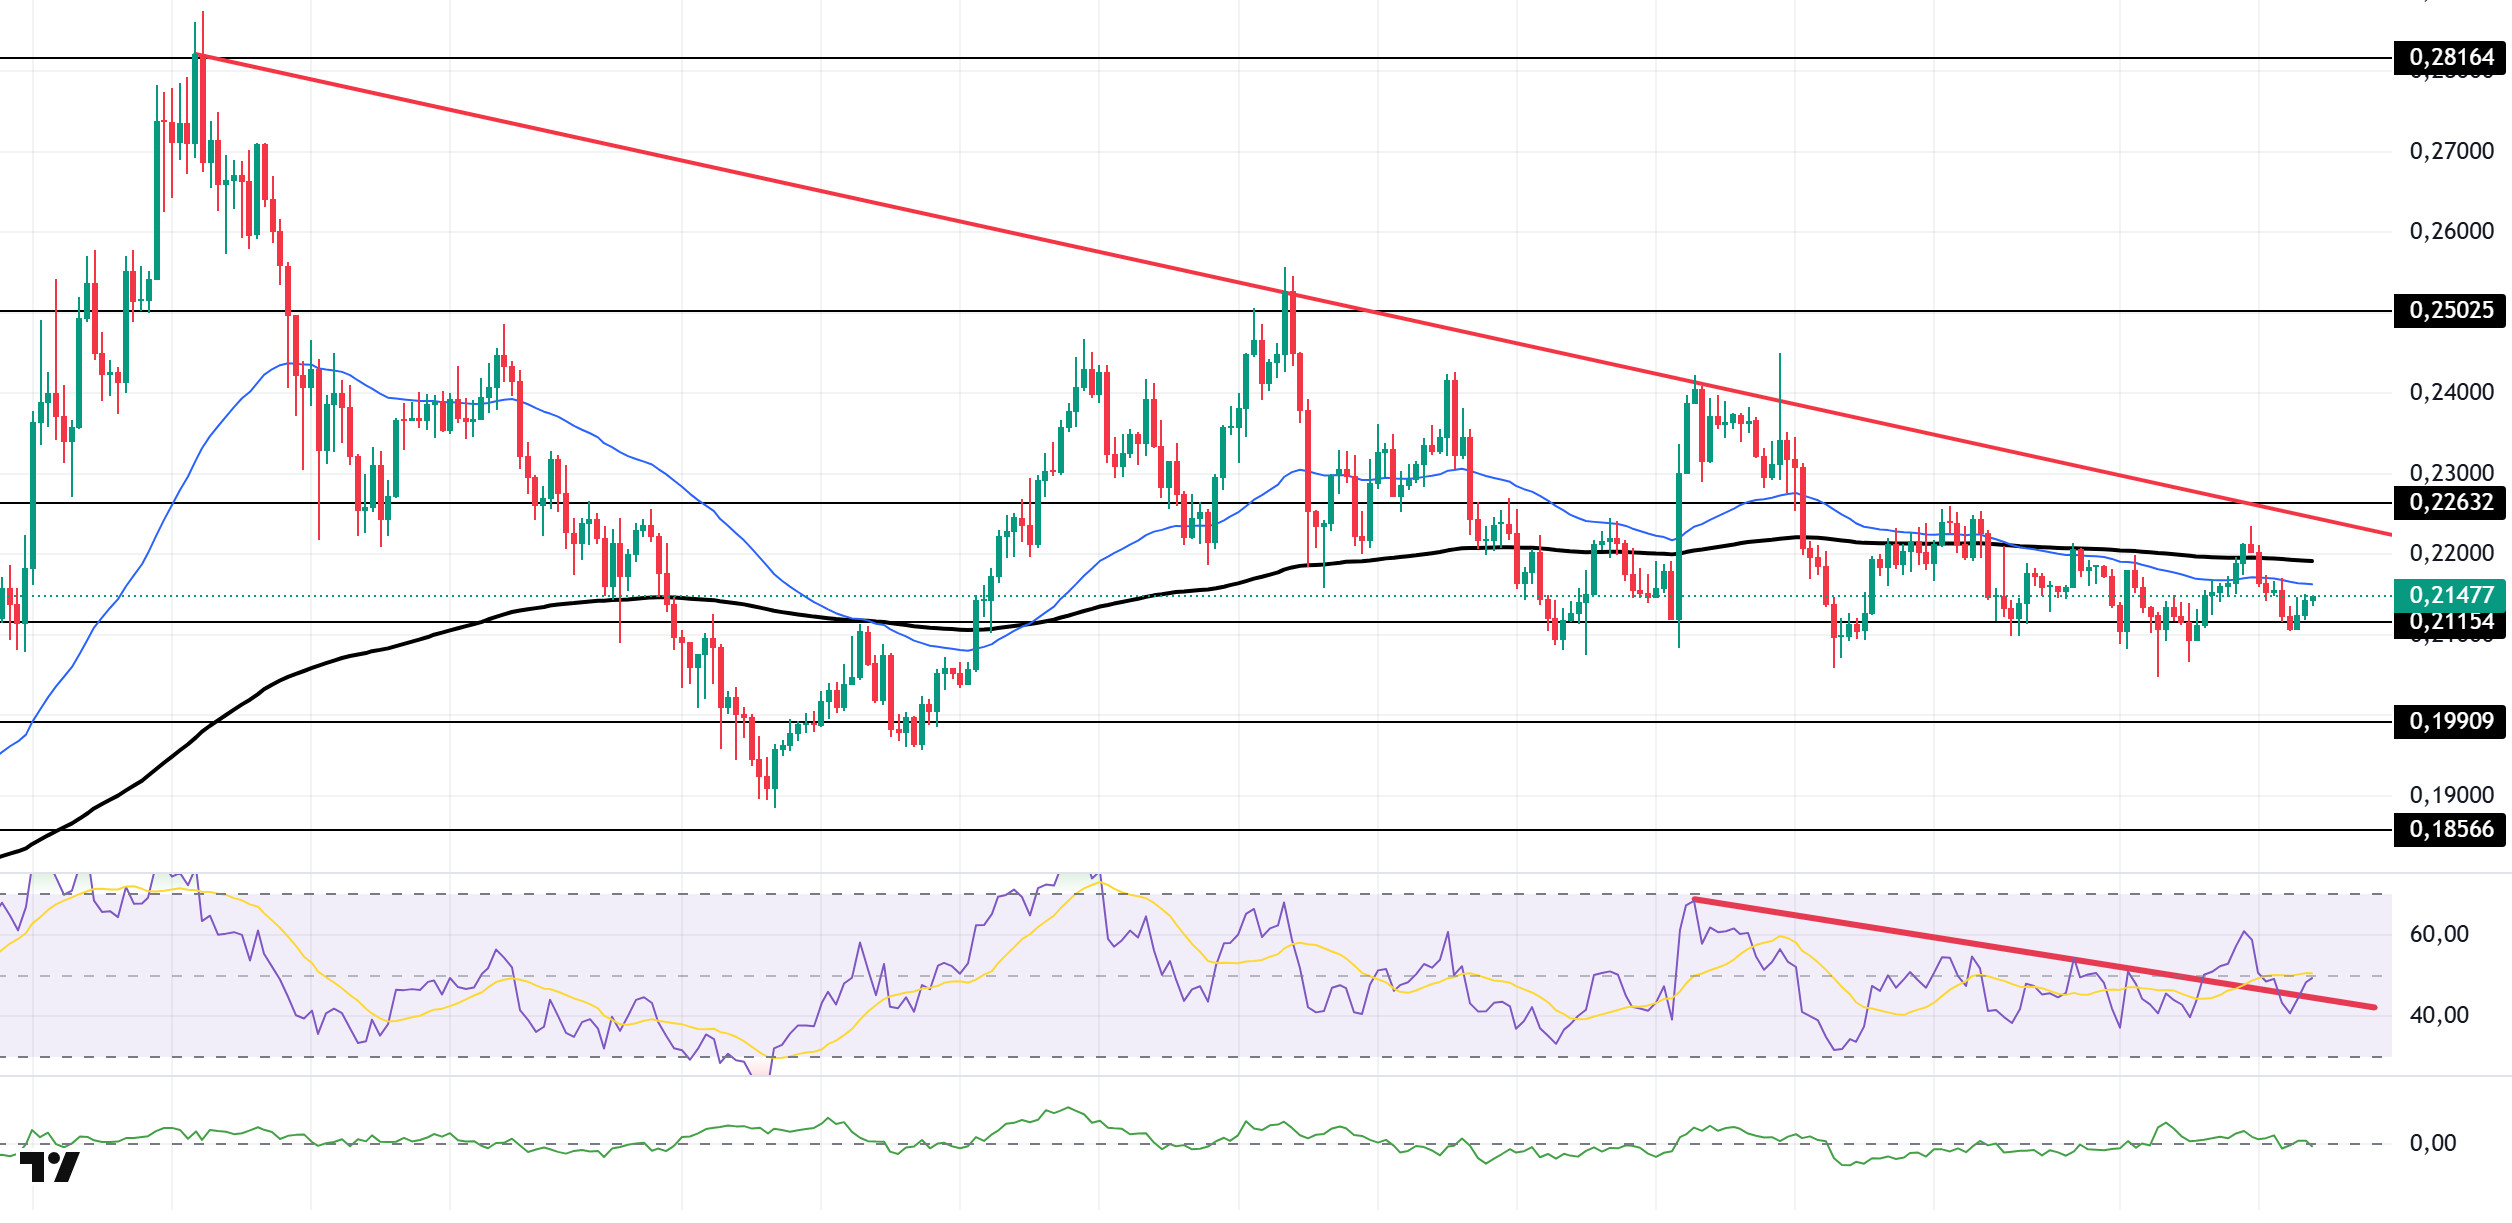
The DOGE price continued to move within a narrow range. The asset remained below the downtrend that began on July 21. The price, which faced resistance from the 50 EMA (Exponential Moving Average – Blue Line) and 200 EMA (Black Line) moving averages, experienced a decline and tested the strong support level of $0.21154, from which it saw a slight increase. If the upward movement continues, the $0.22632 level should be monitored. If the downward movement continues, the $0.19909 level should be monitored.
On the 4-hour chart, the 50 EMA (Blue Line) remained below the 200 EMA (Black Line). This indicates that a medium-term downward trend has begun. The price being below both moving averages also shows that the asset is in a downward trend in the short term. The Chaikin Money Flow (CMF-20) remains in neutral territory. Additionally, an increase in money inflows could push the CMF into positive territory. The Relative Strength Index (RSI-14) remained in the negative zone. At the same time, it continues to be in the upper region of the downward trend that began on August 22. This could trigger an uptrend. In the event of an uptrend driven by political developments, macroeconomic data, or positive news flow in the DOGE ecosystem, the $0.22632 level stands out as a strong resistance zone. Conversely, in the event of negative news flow, the $0.19909 level could be triggered. A decline to these levels could increase momentum and potentially initiate a new upward wave.
Supports: 0.21154 – 0.19909 – 0.18566
Resistances: 0.22632 – 0.25025 – 0.28164
LTC/USDT
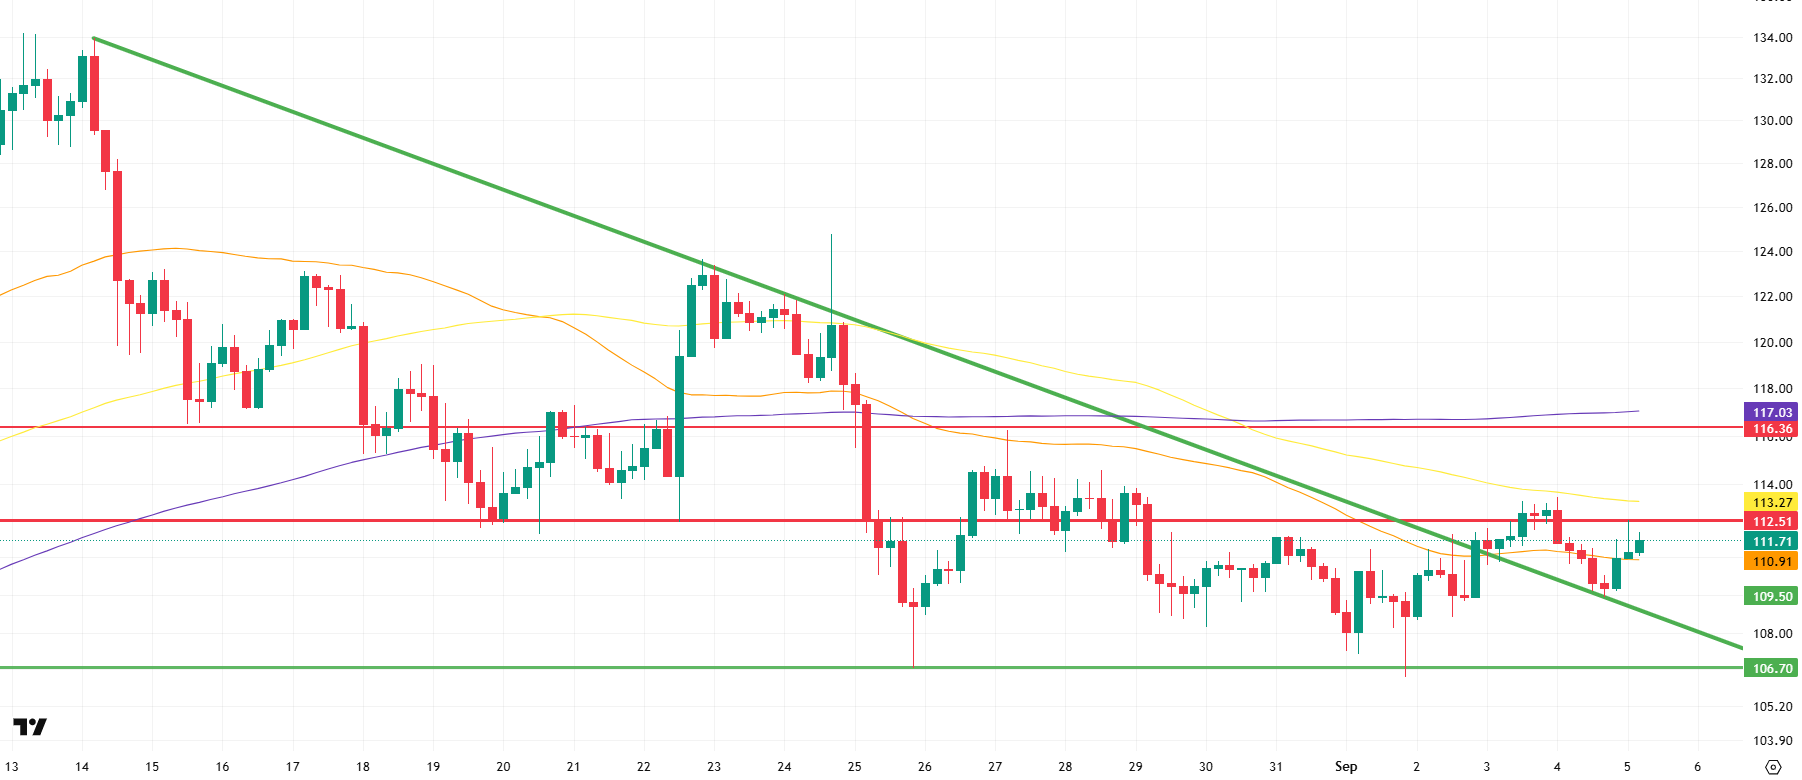
LTC lost 1.73% in value the previous day and also fell by 0.89% against Bitcoin. On the futures side, the long/short position ratio rising to 1.0429 in the last 24 hours indicates an upward trend in the expectations of derivatives market participants. The return of funding rates to positive territory also confirms the decline in short positions. This picture reveals that expectations of an uptrend are intensifying in the derivatives markets.
The technical picture looks quite strong in the anticipated upward scenario. First, the horizontal resistance at the 112.51 level signals short-term selling pressure. Breaking through this level with high trading volume will indicate that momentum is accelerating upward. Next, the 100-period moving average (yellow line) at 113.27 maintains its position as a major resistance. Breaking this barrier will be a clearer confirmation that the trend is gaining strength. Further up, the convergence of the horizontal resistance at 116.36 and the 200-period moving average (purple line) stands out as the most critical hurdle for buyers. Sustained closes above this zone would pave the way for the upward movement to spread to a much broader area.
If the price falls below the 50-period moving average (orange line) and fails to find support at this level, it can be considered a negative signal; if attempts to rise fail and the price remains below the average, selling pressure may increase. In such a scenario, the first level to watch is the 108.41 level, which is a retest of the downtrend. Next, the minor support at 106.70 will come into focus, and if the decline deepens, the 102.90 level will be monitored as critical support.
Supports: 108.41 – 106.70 – 102.90
Resistances: 112.51 – 113.27 – 116.36
Legal Notice
The investment information, comments, and recommendations contained herein do not constitute investment advice. Investment advisory services are provided individually by authorized institutions taking into account the risk and return preferences of individuals. The comments and recommendations contained herein are of a general nature. These recommendations may not be suitable for your financial situation and risk and return preferences. Therefore, making an investment decision based solely on the information contained herein may not produce results in line with your expectations.

