
Technical Analysis
BTC/USDT
Expectations for a 25 basis point interest rate cut at today’s Fed meeting remain high, while monetary policy uncertainty created by employment and inflation data remains the focus of the markets. Regarding institutional Bitcoin demand, American Bitcoin continues to purchase BTC. Meanwhile, Michael Saylor’s emphasis on digital capital transformation is resonating widely.
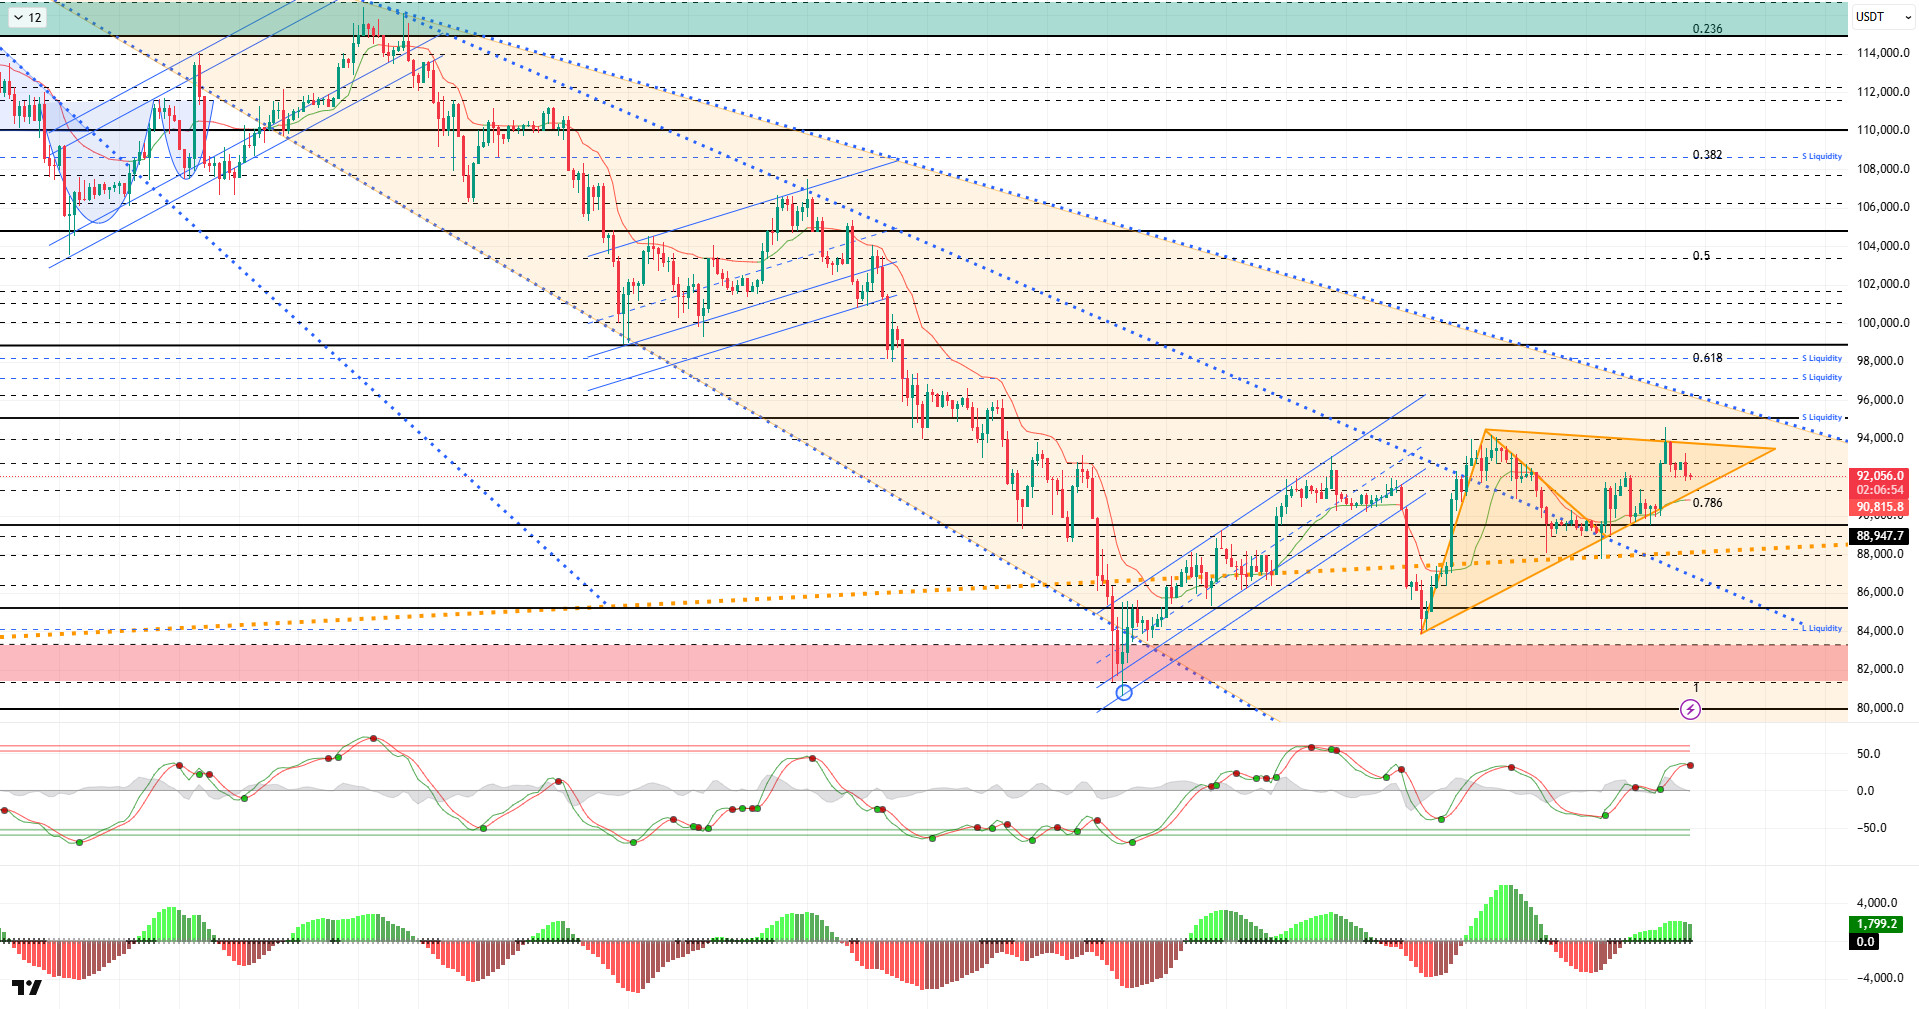
From a technical perspective, the price structure that produced higher lows and lower highs in the previous analysis pointed to a clear symmetrical triangle squeeze in BTC. Breaking this squeeze with an upward-trending, high-volume candle, BTC quickly tested the 94,500 level. With this move, the price formed a higher peak, creating a new upward channel within the orange band. At the time of writing, the price has retreated somewhat and continues to trade around the 92,000 level.
Technical indicators show the Wave Trend (WT) oscillator giving a sell signal just above the channel’s middle band, while the histogram on the Squeeze Momentum (SM) indicator is weakening in the positive zone. The Kaufman Moving Average (KAMA) is currently just below the price at the $90,800 level.
According to liquidation data, with the recent rise, sell-side transactions resulted in liquidation at the short-term level of 92,000 – 94,500. In the monthly view, it continues to maintain its intensity within the 97,000 – 98,000 band. Short-term transactions formed fragmented intensity within the 89,000 – 90,000 band.
In summary, while Trump’s statements regarding the next Fed chair remain in the spotlight, the markets’ main focus has shifted to today’s Fed interest rate decision. Powell’s signals regarding monetary expansion and forward-looking messages on the interest rate path will be decisive for market direction. On the technical side, BTC, which retreated to the 80,500 level following the downtrend that began after its ATH, rebounded strongly from this region. Subsequently, BTC settled above the 90,000 level and broke the symmetrical triangle consolidation pattern formed there, turning the structure into an upward channel with this breakout.Liquidity data shows that target zones are regaining importance and the market is finding equilibrium, while the intensity of the selling pressure is increasing. After this stage, the 90,000 level has become a critical point again for the price to maintain its momentum. Closings and price action above this level are important indicators for regaining momentum. In this context, 95,000 stands out as the next target area, and once it is passed, liquidity areas will be monitored again. In the event of possible selling pressure, 90,000 stands out again as the reference area, and in the event of a breakout, the 87,500 level, which is the point where the major uptrend passed, will be monitored.
Supports: 91,400 – 90,000 – 89,000
Resistances: 92,600 – 94,000 – 95,000
ETH/USDT
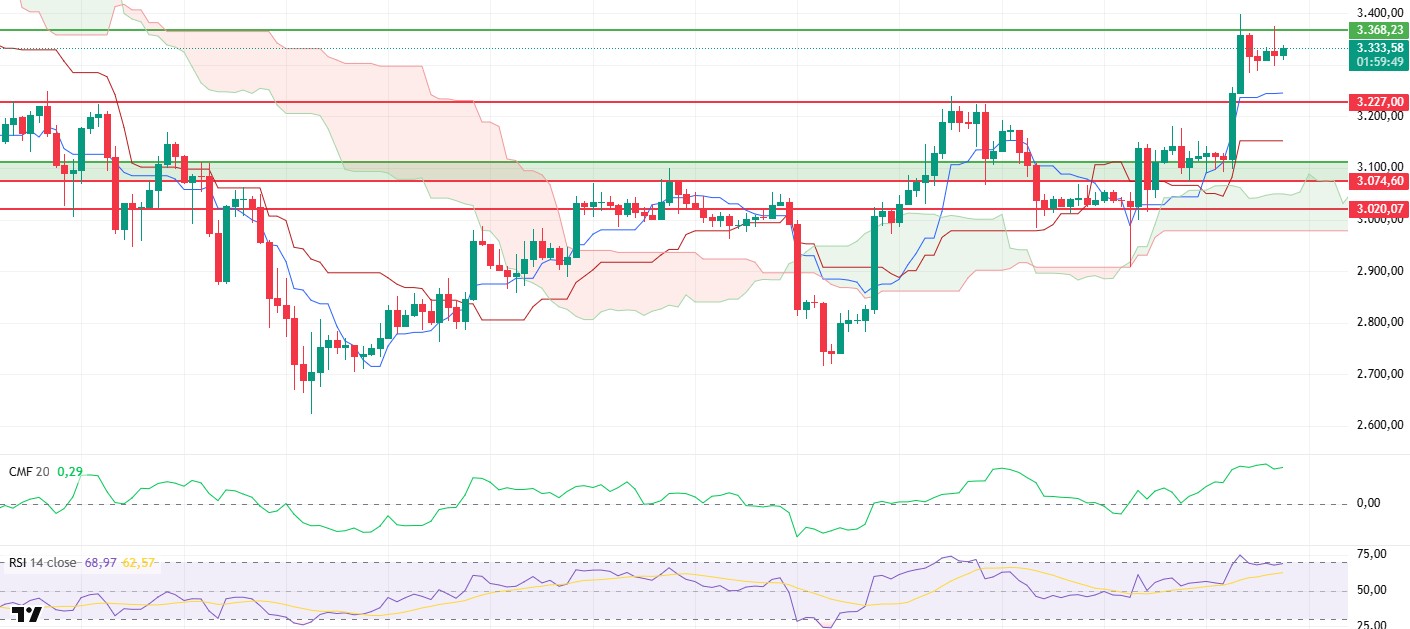
The Ethereum price continued its strong performance during the day, rising to $3,368, but experienced a slight pullback due to selling pressure at this resistance level. However, the price still holding in the upper regions indicates that buyers have not completely abandoned the market.
While the predicted funding rate remains negative, the Chaikin Money Flow (CMF) indicator steadily advancing in positive territory indicates that spot demand is being maintained and capital inflows are continuing. This support on the liquidity side paves the way for declines to remain limited and buyers to re-enter the market.
The Relative Strength Index (RSI) is moving sideways near the overbought zone. This suggests that, despite some short-term cooling, the upward momentum remains strong. If the RSI maintains its position in this zone, it could create room for the price to test the upper resistance levels again.
The Ichimoku chart has not changed its positive structure. The price remaining above the kumo cloud and the Tenkan and Kijun lines positioned supportively below confirm that the trend continues unbroken.
The overall technical structure remains bullish for Ethereum. As long as it holds above the $3,227 level, the price is expected to make further upward moves and test the $3,368 resistance once again. If a strong breakout occurs above this level, the $3,478 target could quickly come into focus. In a potential downward scenario, $3,227 remains an important support level, and closes below this level could increase the risk of a deeper correction. Buyers continue to dominate the market for now, and the possibility of a strong breakout increases slightly each time the price approaches the resistance line.
Supports: 3,227 – 3,074 – 3,020
Resistances: 3,368 – 3,478 – 3,672
XRP/USDT
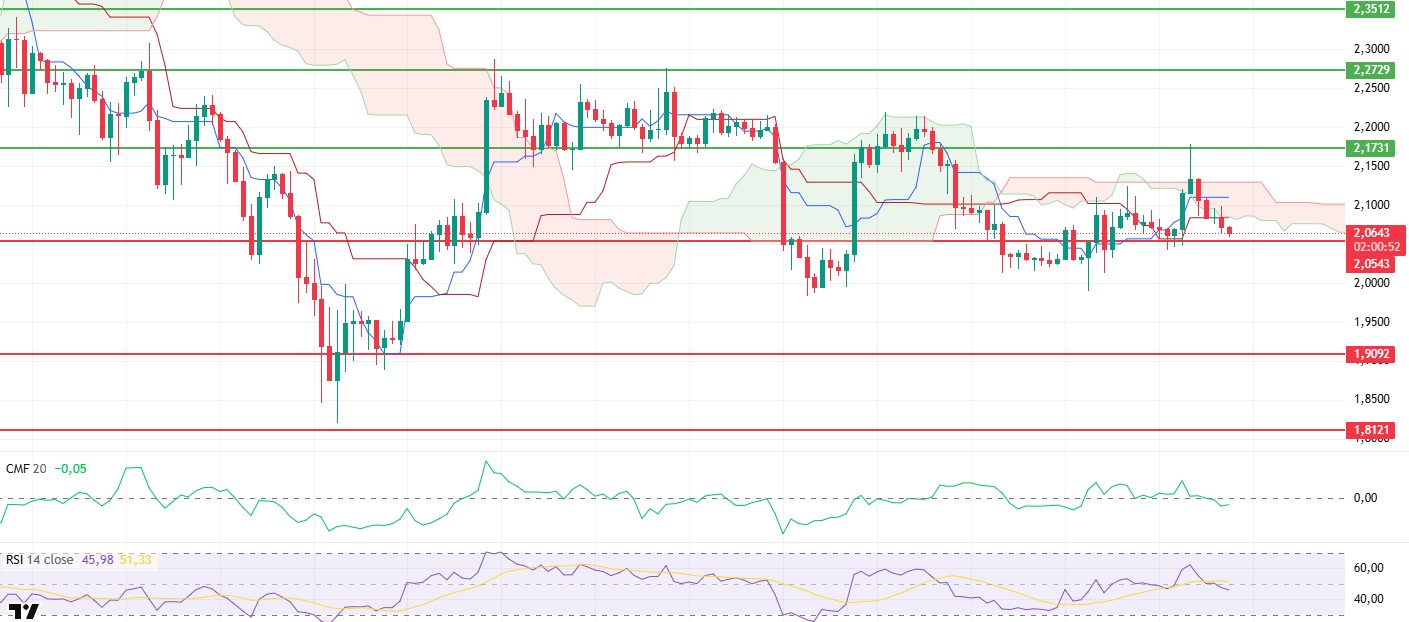
The downward trend in the XRP price continued throughout the day, with the price falling to the $2.06 level. The failure to break through the resistance zone after yesterday evening’s rapid rise attempt shows that sellers are still strong and buyers have not yet taken control of the market.
The Chaikin Money Flow (CMF) indicator remains in negative territory, signaling continued capital outflows. Weakening liquidity is causing rebound rallies to be short-lived and the market to succumb to renewed selling pressure.
The Relative Strength Index (RSI) indicator maintains its weak structure. The RSI’s inability to gain strength indicates that momentum is entirely on the sellers’ side and that a recovery will not be easy. The index remaining below the 50 level signals that upward attempts will be difficult.
The technical outlook on the Ichimoku indicator remains negative. The price trading below the cloud and the failure to break above the Tenkan and Kijun levels confirm that the trend direction remains downward. In the short term, selling pressure re-emerging with every upward attempt supports this structure.
XRP is currently trading very close to critical support levels. The $2.05 region is an important threshold; if lost, the decline could take on a faster pace. Closings below this level could drag the price towards the $1.98–$1.95 range. For the upside potential to regain strength, liquidity must first recover and the RSI must turn upward. Until these conditions are met, it is fair to say that buyers remain weak and sellers are in control.
Supports: 2.0543 – 1.9092 – 1.8121
Resistances: 2.1731 – 2.2729 – 2.3512
SOL/USDT
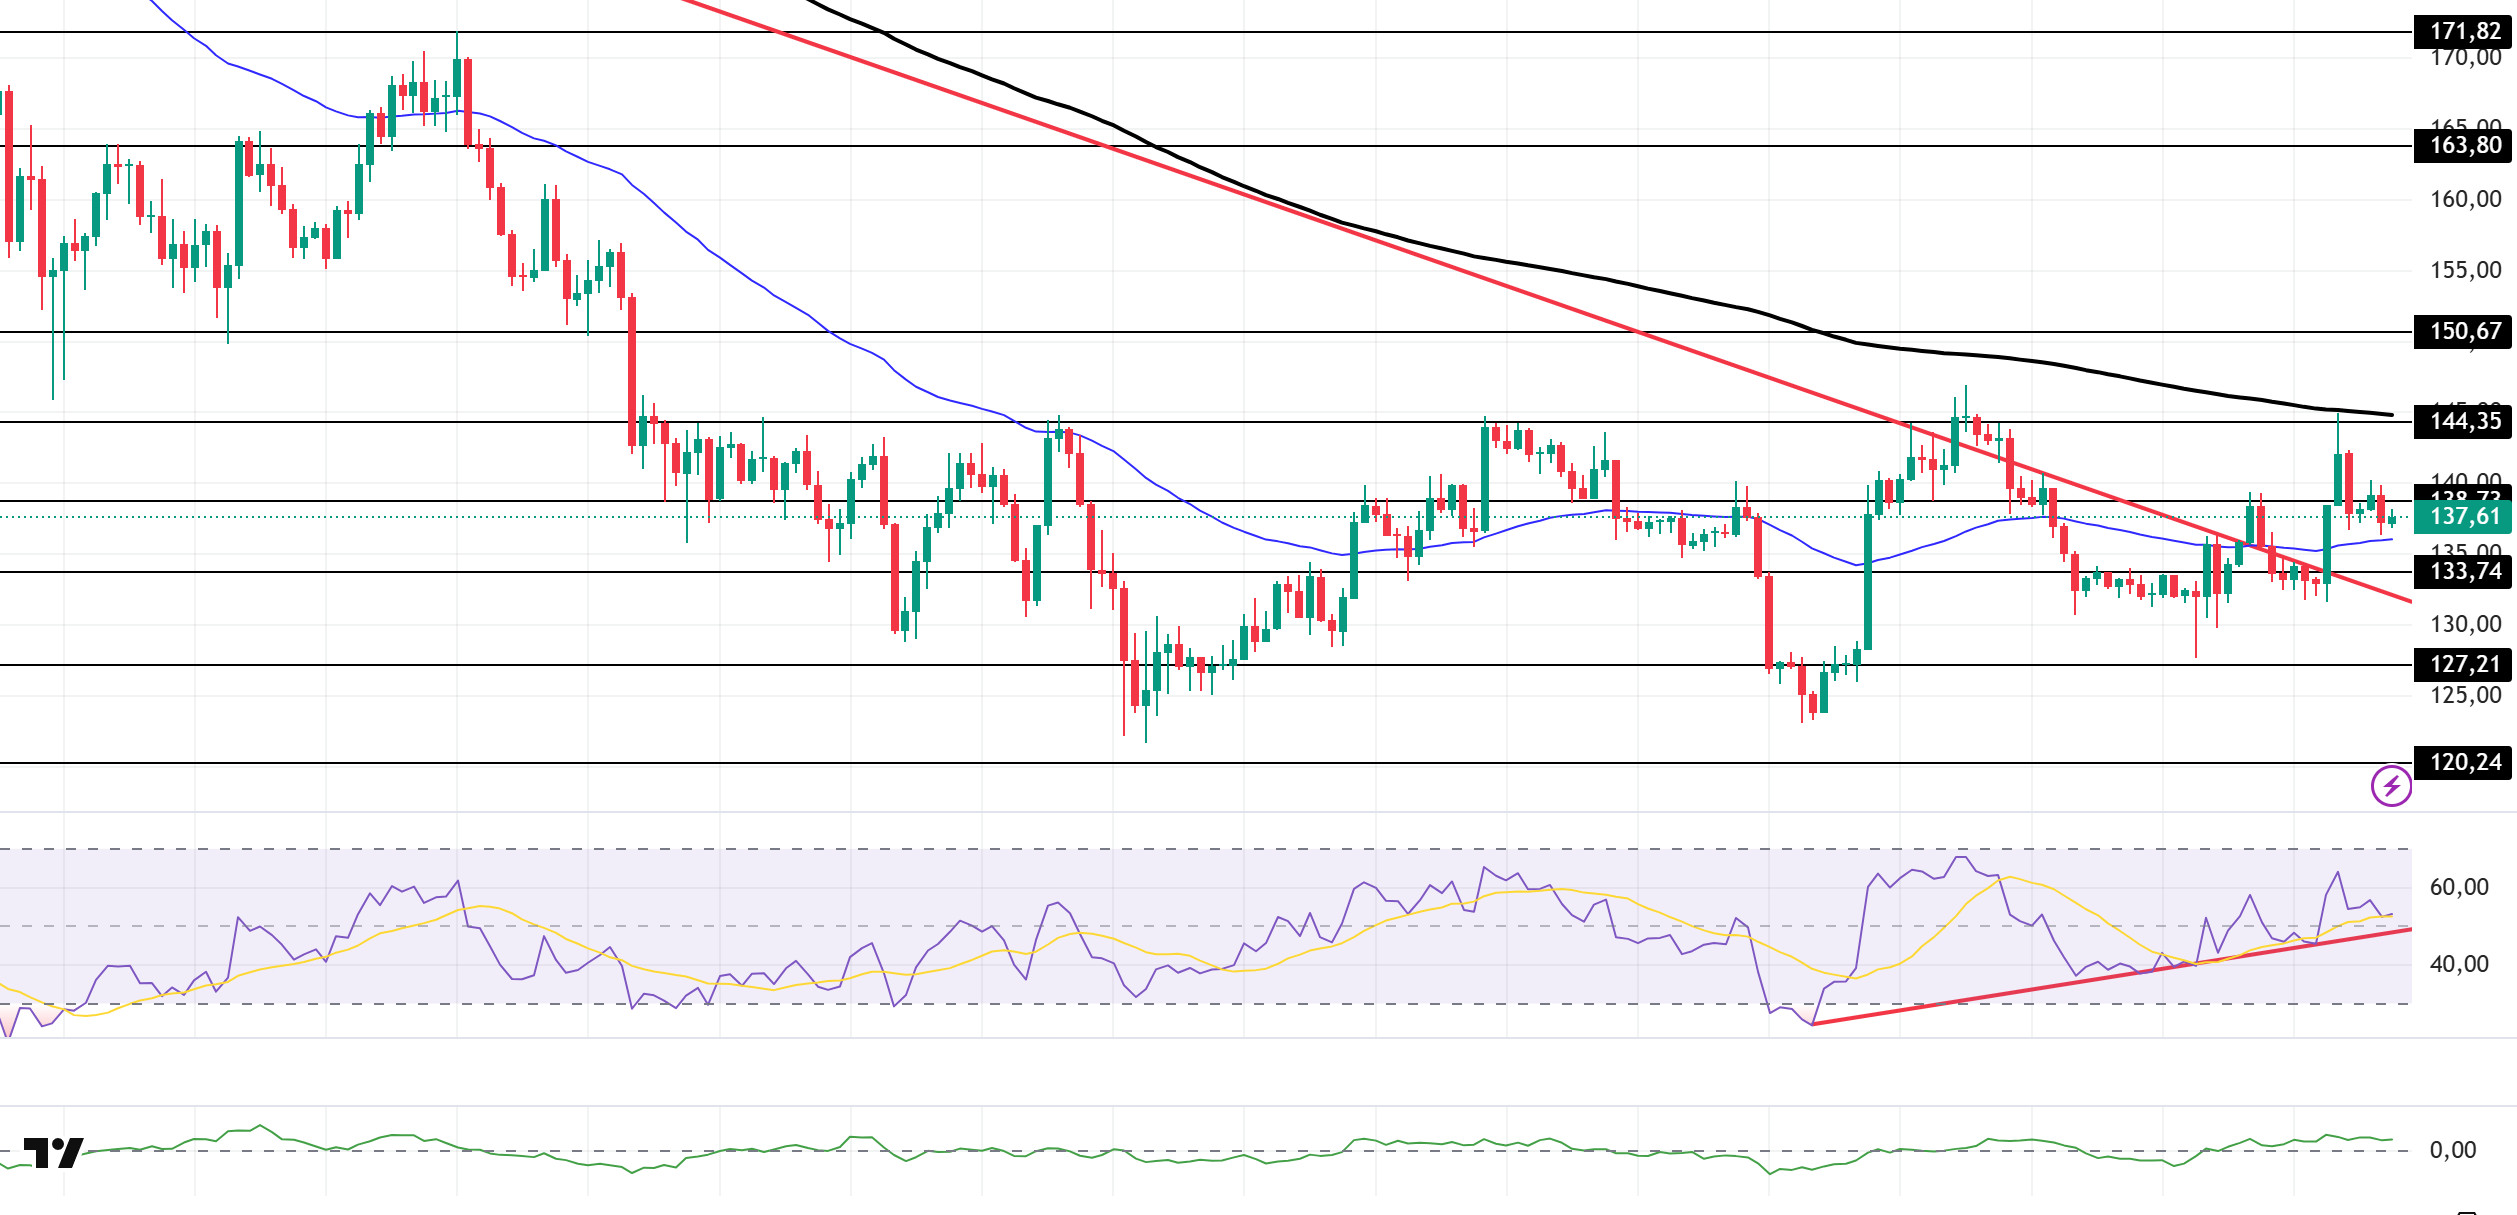
The SOL price remained flat during the day. The asset continued to stay in the upper region of the downward trend that began on October 6. As of now, the price is testing the 50 EMA (Blue Line) moving average as support. If the upward movement continues, it may retest the 200 EMA moving average. If the price closes below the 50 EMA moving average, it may test the downward trend as support.
On the 4-hour chart, it continued to remain below the 50 EMA (Exponential Moving Average – Blue Line) and 200 EMA (Black Line). This indicates that it may be in a medium-term downtrend. At the same time, the price being between the two moving averages indicates that the asset is in a decision phase in the short term. The Chaikin Money Flow (CMF-20) remained at a positive level. However, balanced cash inflows and outflows may keep the CMF in positive territory. The Relative Strength Index (RSI-14) is in the middle of the positive zone. It also remained above the rising line that began on December 1. This indicates that buying pressure continues. In the event of an uptrend driven by macroeconomic data or positive news related to the Solana ecosystem, the $150.67 level stands out as a strong resistance point. If this level is broken upwards, the uptrend is expected to continue. In the event of pullbacks due to developments in the opposite direction or profit-taking, the $120.24 level could be tested. A decline to these support levels could increase buying momentum, presenting a potential opportunity for an upward move.
Supports: 133.74 – 127.21 – 120.24
Resistances: 138.73 – 144.35 – 150.67
DOGE/USDT
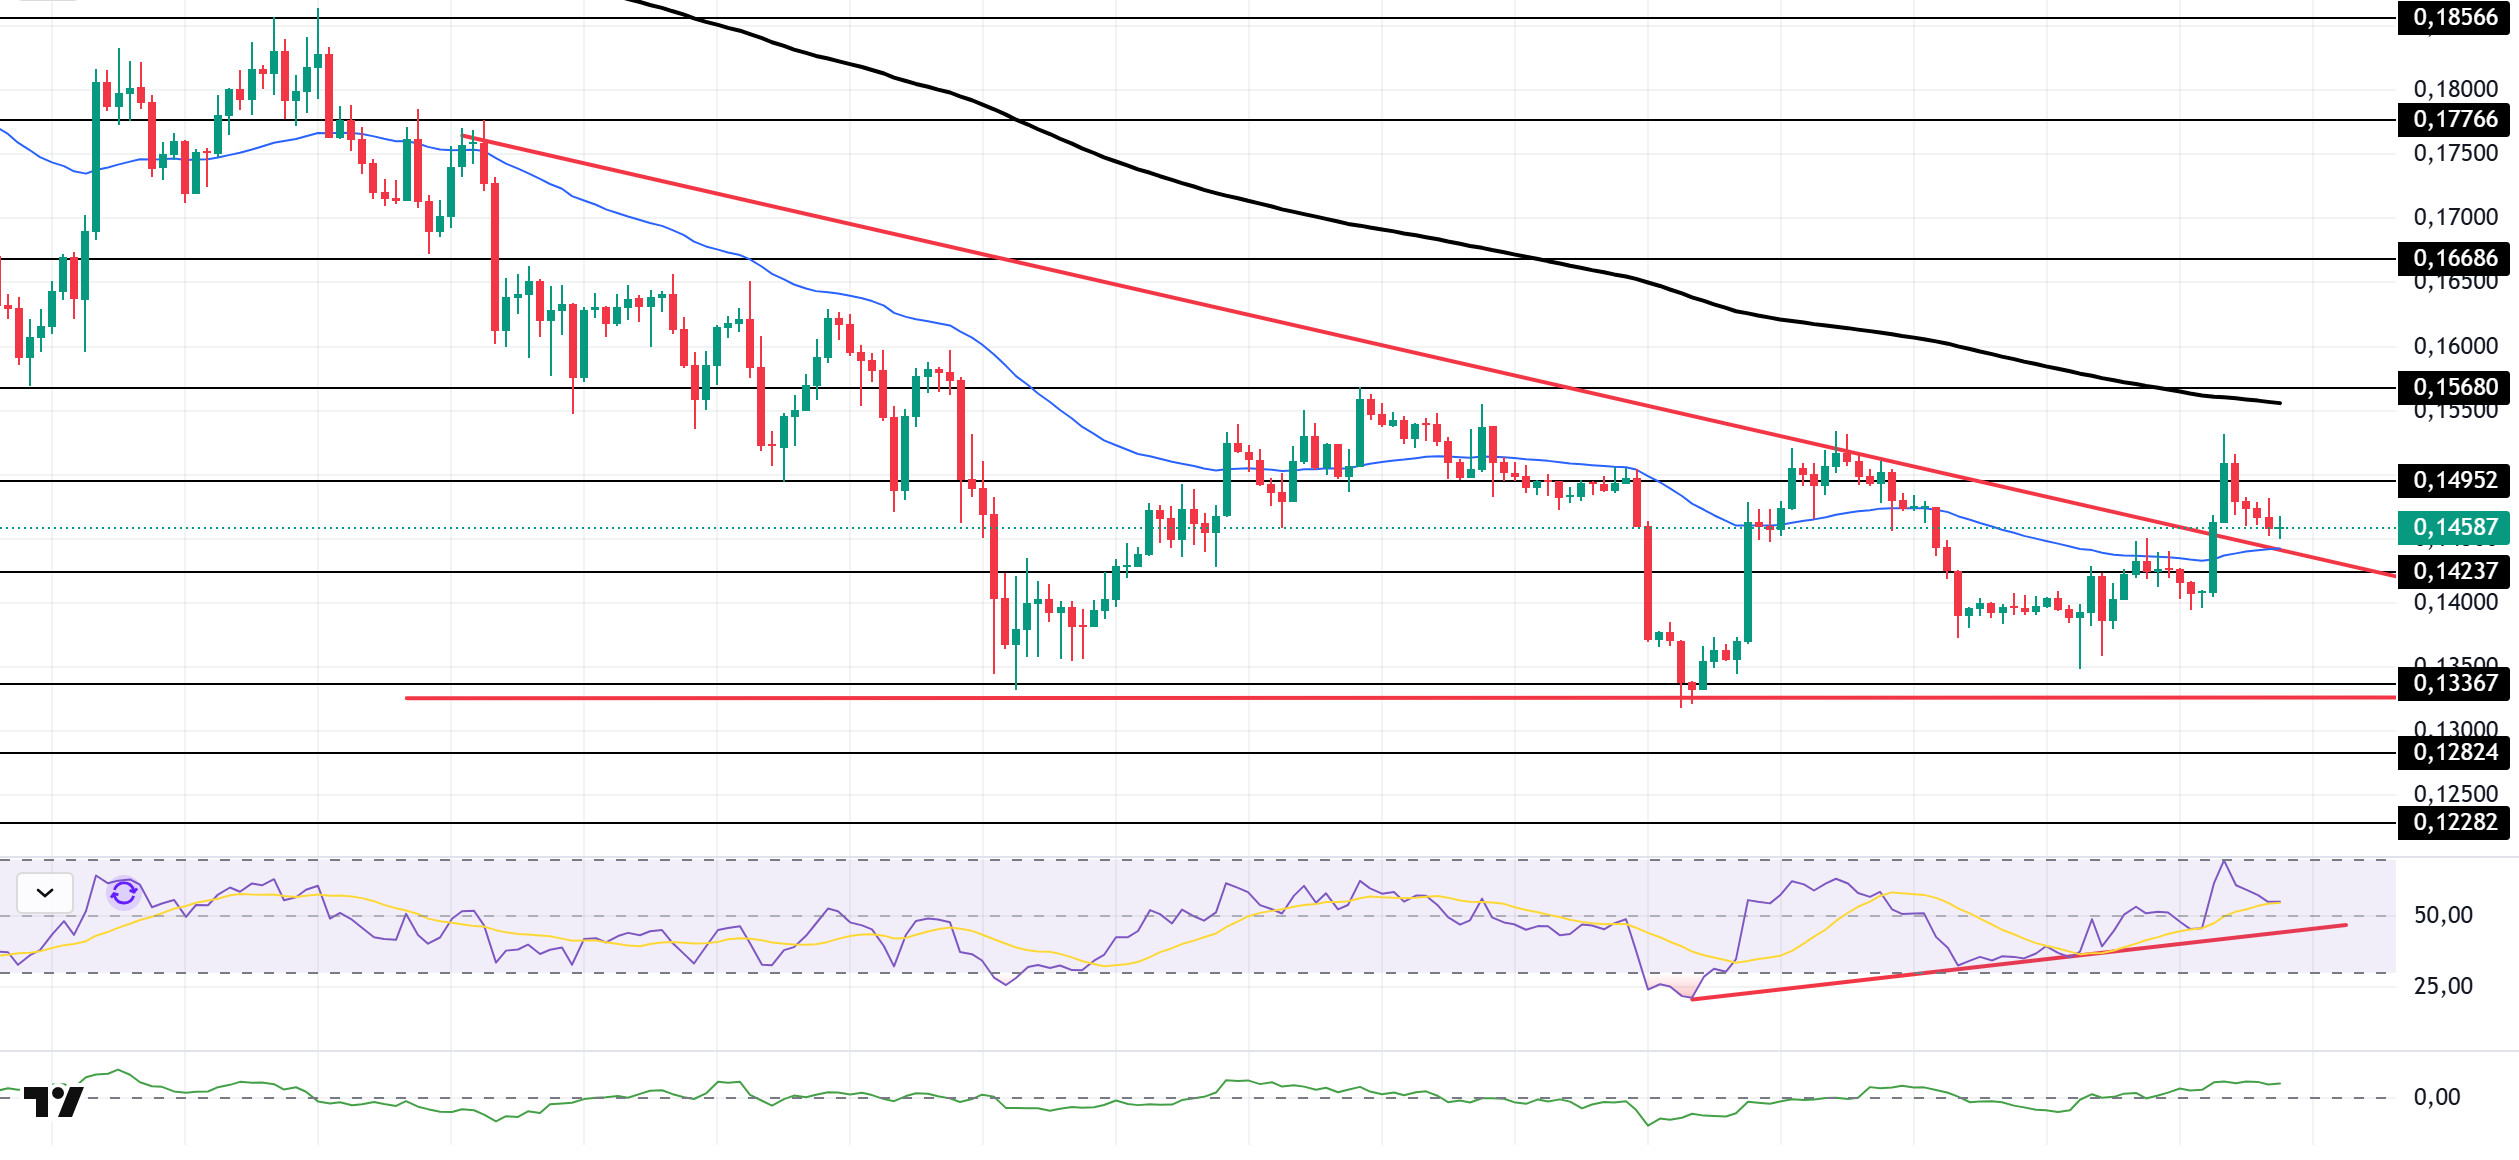
The DOGE price traded sideways during the day. The asset remained above the ceiling level of the descending triangle formation that began on November 13 and the 50 EMA (Blue Line) moving average. Currently testing the ceiling level of the descending triangle formation and the 50 EMA moving average as support, the asset could test the $0.14237 level as support if it breaks below this level. If it experiences an uptrend, it could test the 200 EMA (Black Line) moving average as resistance.
On the 4-hour chart, the 50 EMA (Exponential Moving Average – Blue Line) remained below the 200 EMA (Black Line). This indicates that the downtrend may continue in the medium term. The price being between the two moving averages suggests that the price is in a decision phase in the short term. The Chaikin Money Flow (CMF-20) remained in positive territory. Additionally, the balance of money inflows and outflows may keep the CMF in positive territory. The Relative Strength Index (RSI-14) retreated from the overbought level to the middle of the positive zone. At the same time, it remained in the upper region of the upward trend that began on December 1. In the event of an uptrend driven by political developments, macroeconomic data, or positive news flow in the DOGE ecosystem, the $0.15680 level stands out as a strong resistance zone. Conversely, in the event of negative news flow, the $0.13367 level could be triggered. A decline to these levels could increase momentum and initiate a new wave of growth.
Supports: 0.14237 – 0.13367 – 0.12824
Resistances: 0.14952 – 0.15680 – 0.16686
AVAX/USDT
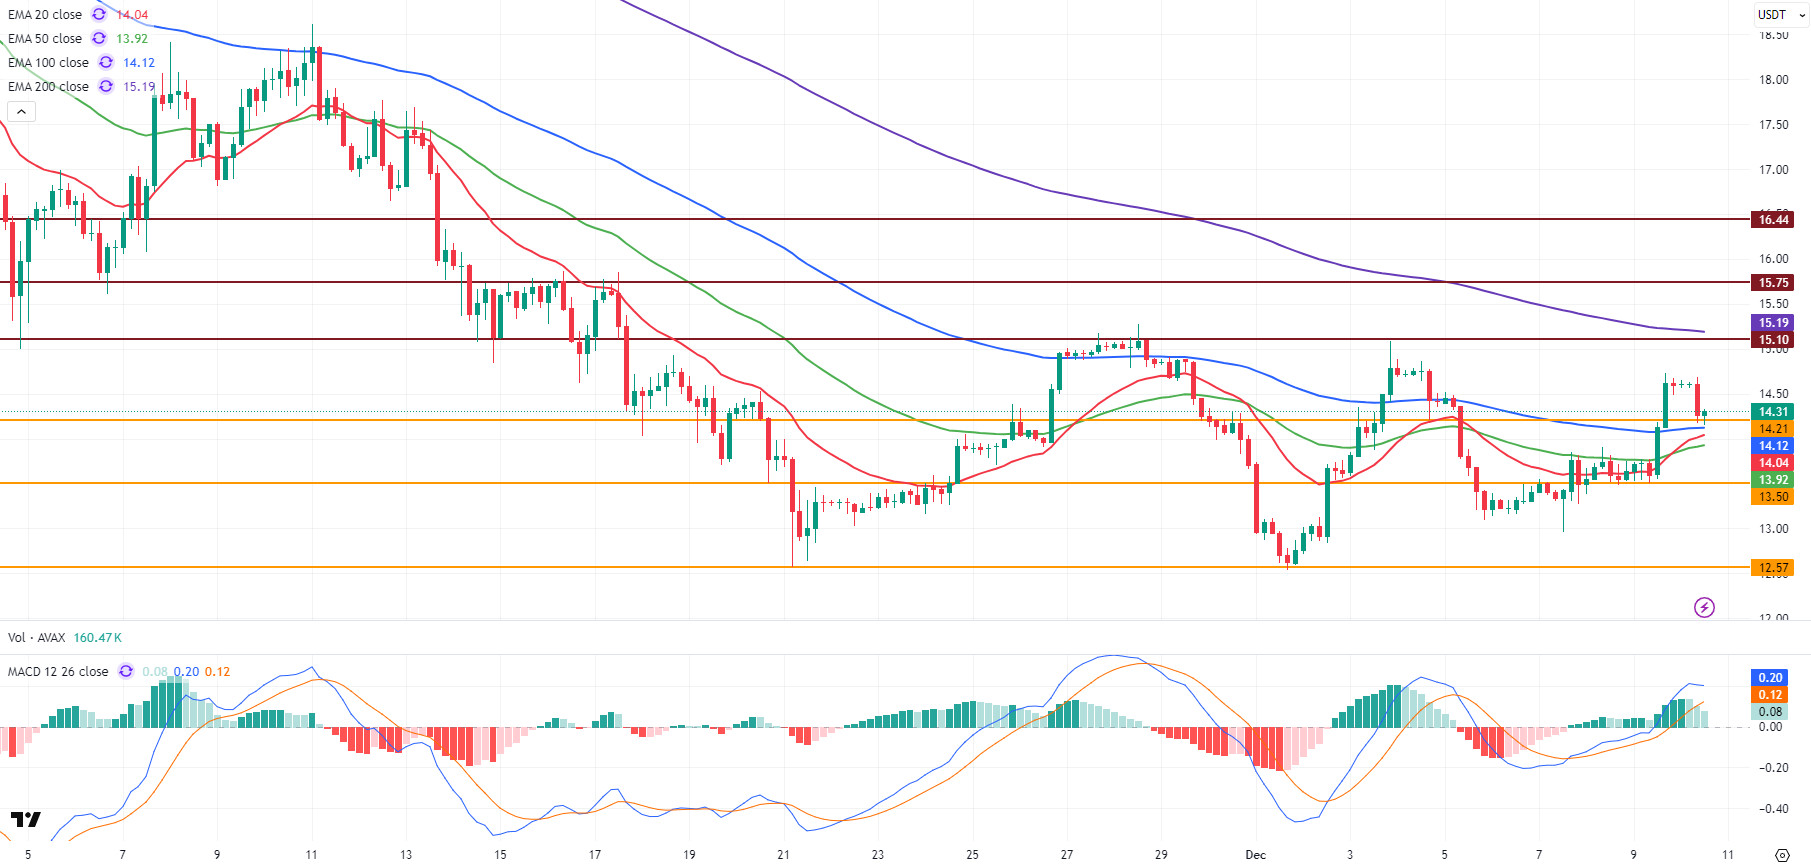
AVAX started the new day at $14.60 and, following yesterday’s strong rise, showed a calmer and more sideways pattern at the start of the new day. After this flat appearance, AVAX tested the $14.21 support level with a decline during the day and experienced a slight recovery with purchases coming in at the support zone. AVAX is currently trading at around $14.30, down approximately 2% on a daily basis, and continues to show weak momentum in the overall outlook. Today’s Fed Interest Rate Decision and FOMC Economic Projections, particularly the messages regarding 2026 interest rate policy, could increase short-term volatility in the crypto market. A dovish stance could boost risk appetite, while a hawkish outlook could put pressure on the crypto market, including AVAX.
On the 4-hour chart, the Moving Average Convergence/Divergence (MACD) line remains above the signal line but has turned downward. While the MACD line staying in positive territory maintains the short-term positive outlook, the current downward trend indicates weakening momentum. A downward break of the signal line could increase selling pressure. On the Exponential Moving Average (EMA) side, AVAX continues to trade above the EMA20, EMA50, and EMA100 levels after yesterday’s rise. It recovered today with purchases at the EMA100 level during the decline. The EMA200 level continues to be the main short-term resistance area for AVAX’s rise.
From a technical perspective, the $15.10 and EMA200 levels stand out as the first critical resistance zone in AVAX’s rise. If these levels are broken, the rise could gain momentum and AVAX could move towards the $15.75 and $16.44 resistance levels. In a downward scenario, the first strong support is the $14.21 level and the support zone formed by the critical EMA levels below this level. If there is a close below these levels, selling pressure may increase, and AVAX may fall towards the $13.50 and $12.57 support zones. In the overall outlook, despite the MACD being in positive territory, its downward trend and the price trading below the EMA200 indicate that the rise may be limited at resistance zones. For the bullish scenario to gain strength, both momentum growth and continued trading above all critical EMA levels are important.
(EMA20: Red Line, EMA50: Green Line, EMA100: Blue Line, EMA200: Purple Line)
Supports: 14.21 – 13.50 – 12.57
Resistances: 15.10 – 15.75 – 16.44
LINK/USDT
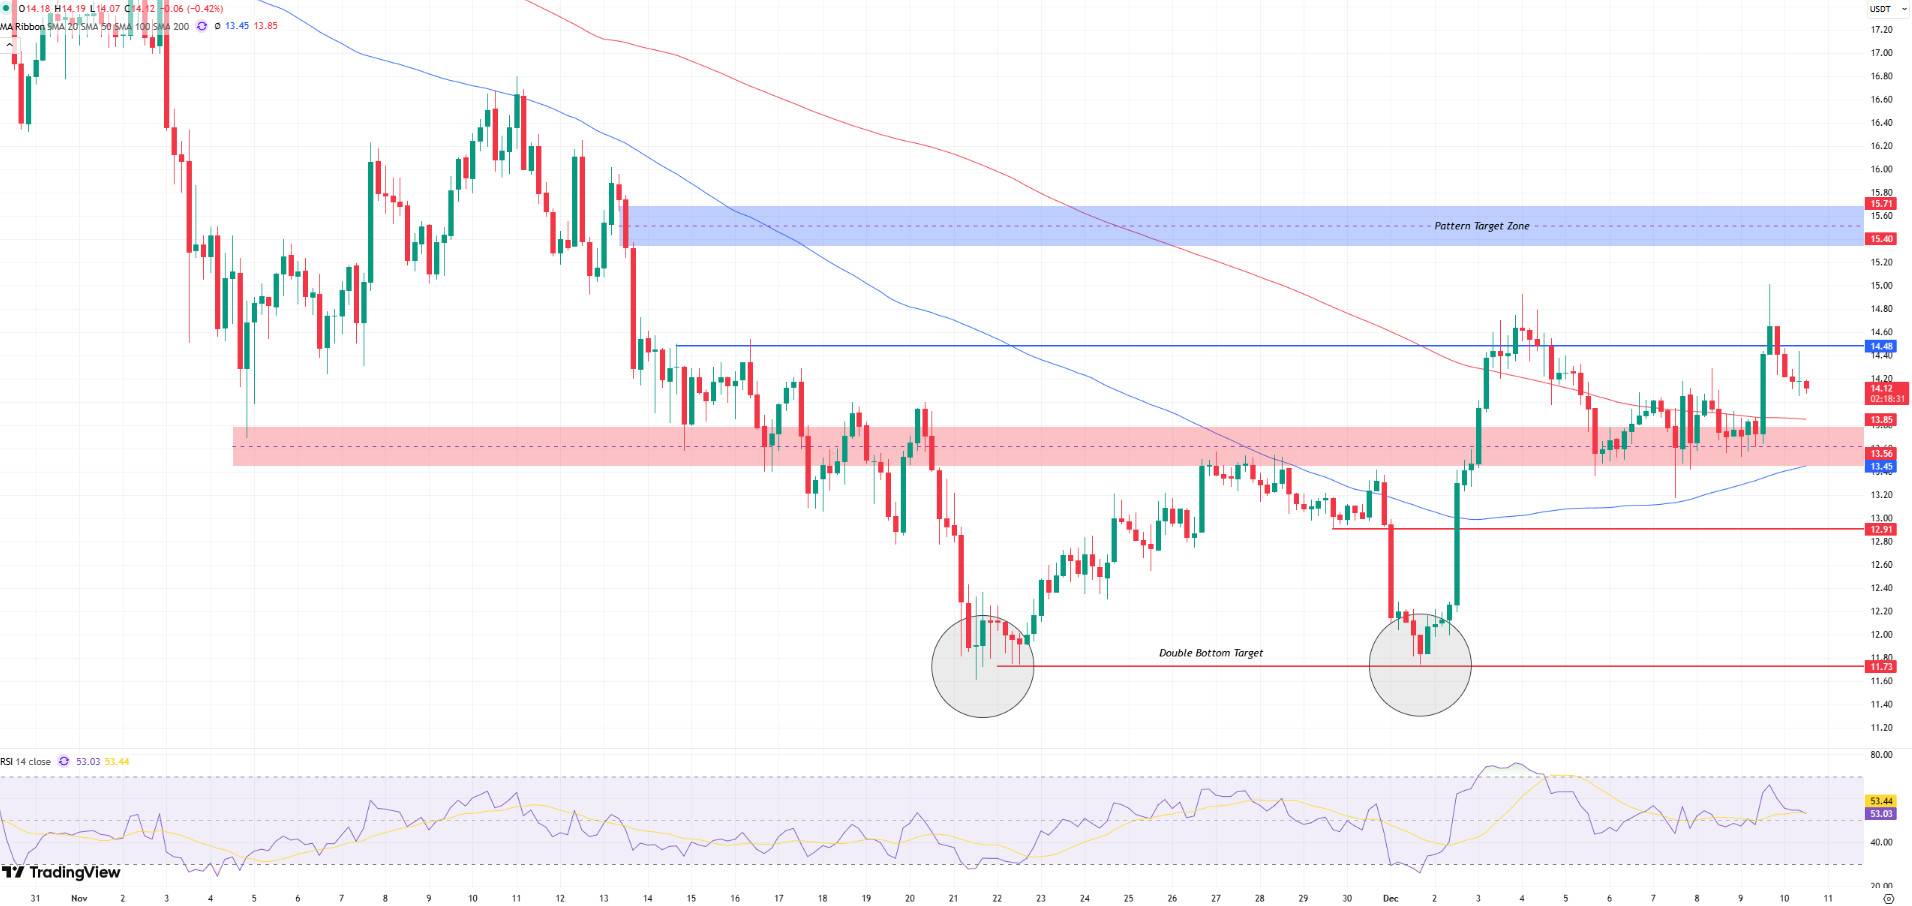
We can say that the approximately 10% increase experienced yesterday triggered a sharp upward movement, especially in the lower time frames. As the price gradually breaks free from the downward trend, the reaction movements following the breakout are now producing higher lows, supporting the positive technical structure. In this process, buyers maintaining a stable position above the $13 band keeps positive expectations strong. However, it is important to remember that volatility could rise significantly before and after today’s US interest rate decision.
The 14.48 level still remains the main decision point for upward movements in the short term. Although the price has tested this area, it has not yet produced a clear breakout. Sustained closes above this level could allow the uptrend to regain momentum, initially pushing the price to the 15.40 level and then into the target zone around the 15.71 band.
In a downside scenario, the 13.56 level continues to act as the first short-term defense line. Closes below this region could pull the price back towards the intermediate support at 12.91. If this level is lost, the 11.73 level, which previously formed the base of the double bottom formation, will come back into focus. Price action below 11.73 could completely invalidate the current positive scenario, shifting the medium-term outlook back into negative territory.
Although the Relative Strength Index (RSI) recovering around the 50 level without entering the overbought zone is positive, for the uptrend to gain strength, the price must be supported by closes above 14.48. Otherwise, it seems more likely that the price will continue to gain time within a flat-wavy structure.
Supports: 13.56 – 12.91 – 11.73
Resistances: 14.48 – 15.40 – 15.71
Legal Notice
The investment information, comments, and recommendations contained herein do not constitute investment advice. Investment advisory services are provided individually by authorized institutions taking into account the risk and return preferences of individuals. The comments and recommendations contained herein are of a general nature. These recommendations may not be suitable for your financial situation and risk and return preferences. Therefore, making an investment decision based solely on the information contained herein may not produce results in line with your expectations.

