
Technical Analysis
BTC/USDT
The US federal government officially shut down due to a failure to reach a budget agreement, leaving approximately 750K employees facing unpaid leave or pay cuts. September nonfarm payroll data will most likely be delayed. Meanwhile, the US ADP private sector employment data came in at -32K, well below expectations; additionally, the August data, previously reported as 54K, was revised to -3K. The U.S. Treasury Department is preparing to ease the minimum corporate tax (CAMT) draft for crypto assets. The dollar index lost value with the government shutdown. Japan’s Metaplanet rose to become the fourth-largest Bitcoin treasure among publicly traded companies with 30,823 BTC.
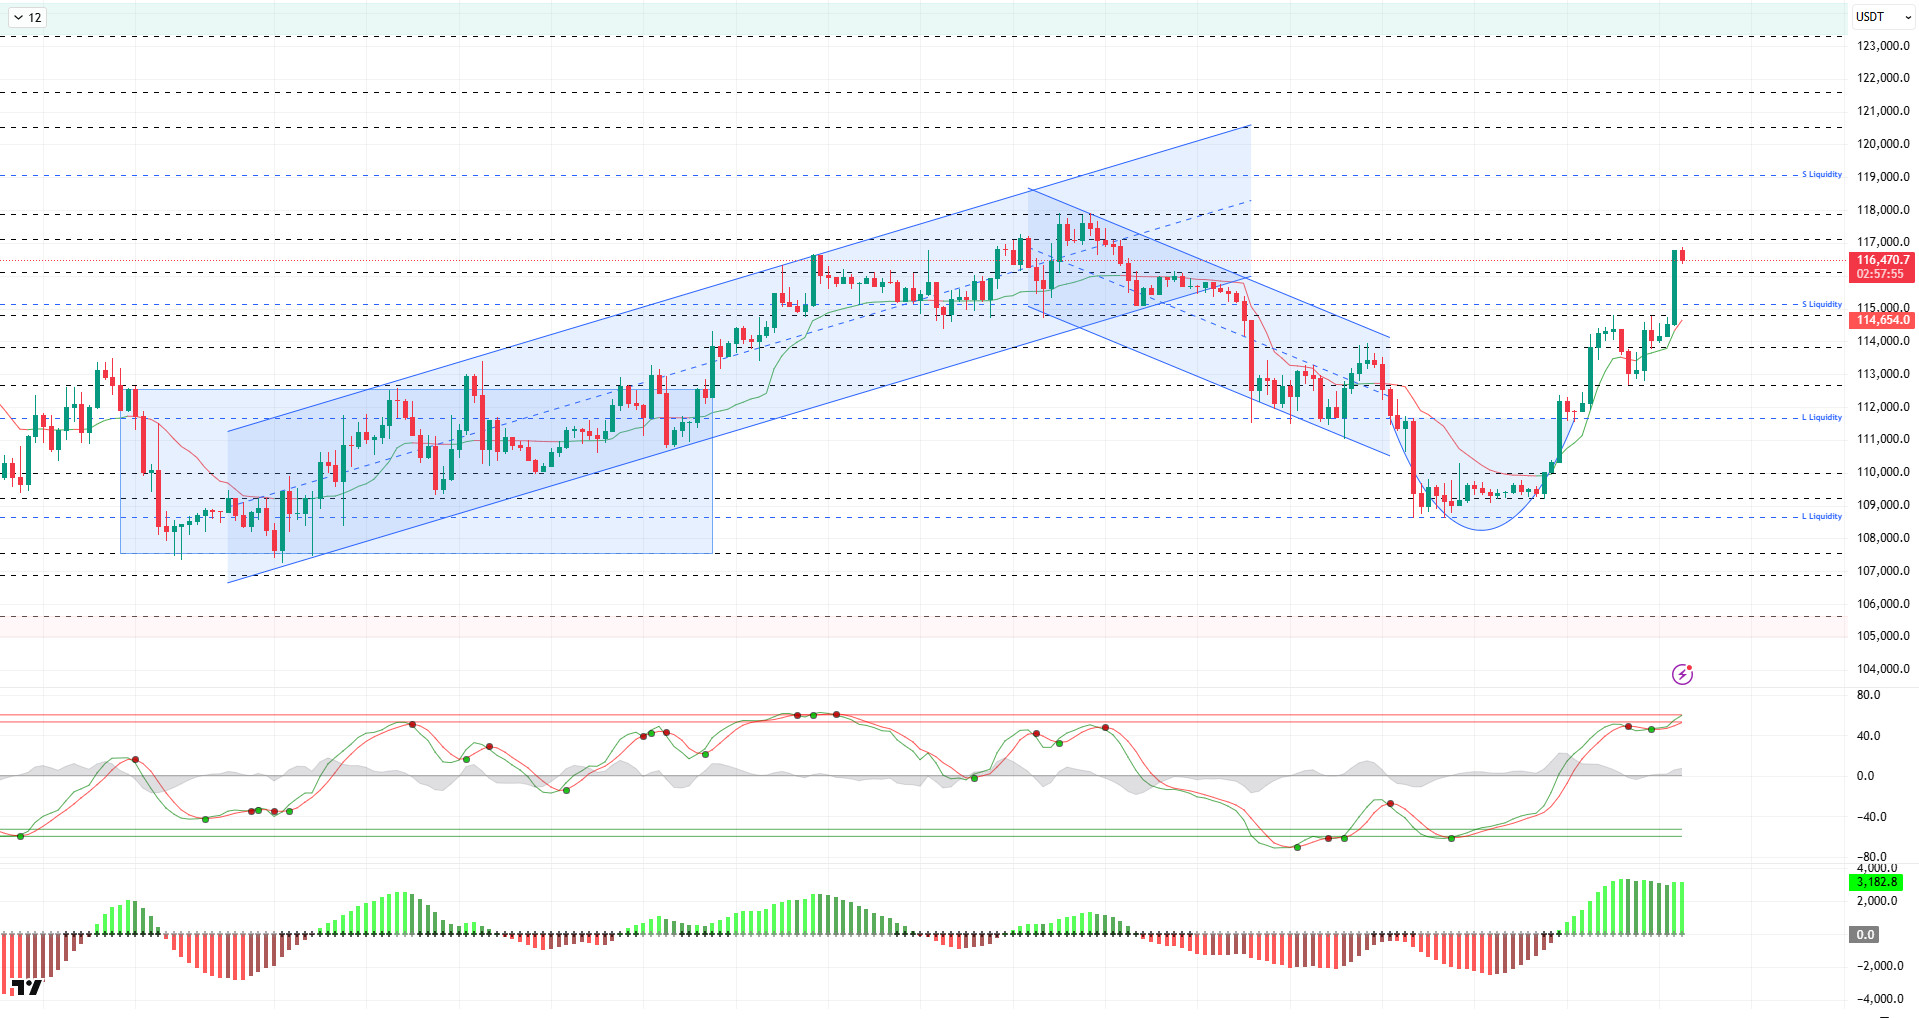
Looking at the technical picture, BTC continues to carry its upward momentum with a cup formation. The price, which tested the 114,500 level in the previous analysis, gained momentum and reached the 117,000 level. At the time of writing, it continues to trade at the 116,500 level.
Technical indicators signaled a trend reversal in line with the short-term sell signal given by the Wave Trend oscillator (WT) in the overbought zone. The oscillator then gave a buy signal again and turned upward once more. The Squeeze Momentum (SM) indicator’s histogram continues its momentum within the positive zone. The Kaufman moving average is currently trading below the price at the 114,500 level.
An examination of liquidation data shows that short positions concentrated above the 115,500 level were liquidated with the recent upward movement. Contrary to the thinning selling pressure, buying pressure gained strength with this movement. On the buy side, short-term positions appear to have regained intensity at the 113,300 level, while long-term trades appear to have concentrated at the 112,100 level.
In summary, while the US government shutdown has had no significant impact on the markets, the differing views of Fed members on interest rate cuts and the return of tariffs to the agenda are among the prominent developments. The negative outlook for short-term interest rate cuts regained strength with interest rate cut expectations rising to 97%. On the BTC side, we are entering the month of October, which has seen double-digit averages in terms of cyclical movements. The cup formation in the technical outlook supports the price’s recovery trend, while liquidity data continues to point to the target zone.In this context, 115,000 now emerges as a critical support area for the sustainability of the rise, and closes above this level could bring the ATH zone back into focus. On the other hand, in the event of potential selling pressure, the 115,000 level will be monitored as the first support point, and we will follow the liquidity zones if it falls below this level.
Supports: 115,000 – 114,000 – 112,600 –
Resistances: 116,000 – 117,400 – 119,000
ETH/USDT
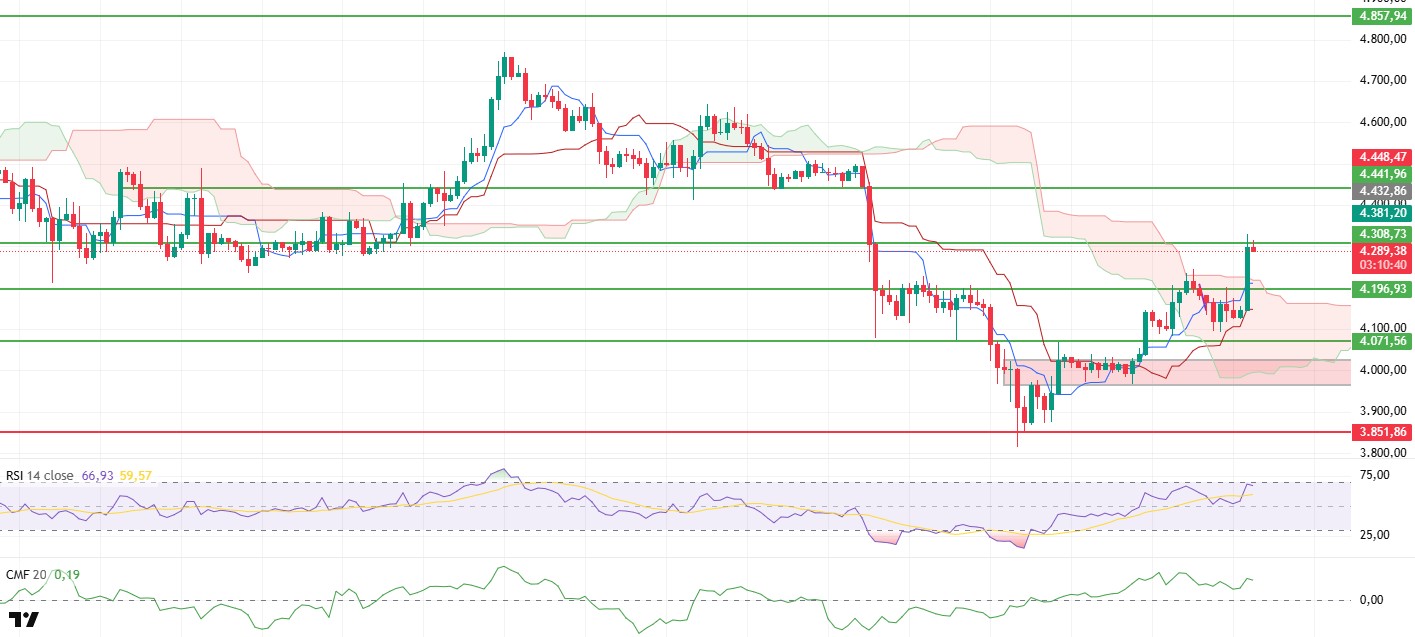
The ETH price accelerated its rise by strongly surpassing the $4,196 level, which was highlighted as critically important in the morning analysis, and reached the $4,308 resistance. As this area is an important threshold for the market to determine its direction in the short term, the first selling reactions were seen along with the resistance, and the price is trying to stabilize at this point for a while.
The Chaikin Money Flow (CMF) indicator has regained upward momentum, leaving behind this morning’s downward trend, and has begun to strengthen in positive territory. This outlook reveals that fresh capital and buyer appetite continue to enter the market throughout the day, indicating that the market still has strong liquidity support despite selling pressure.
The Ichimoku indicator has become quite clear during the day. The price broke above the kumo cloud, escaping the zone of uncertainty, and managed to stay above the Tenkan and Kijun levels. Furthermore, the Tenkan level being above the Kijun confirms a classic bullish signal. This structure indicates that a trend reversal has occurred in the market and that the upward movement is now based on stronger foundations.
The Relative Strength Index (RSI) indicator is approaching the overbought zone. This suggests that the price may consolidate for a short period or experience minor corrections in the very near term. However, these RSI levels do not necessarily mean that the upward trend has completely ended, especially in strong trends. Instead, they also imply the possibility of the movement continuing after brief pauses in the market.
Ultimately, if the $4,308 level is surpassed in the evening hours, the upward trend is expected to accelerate, with the price targeting the $4,440 level. However, if the price fails to sustain itself above this resistance level, it may enter a short-term consolidation phase. On the other hand, falling below the $4,196 level would mean that buyers have lost momentum and could trigger a sharp pullback towards the $4,070 level by increasing selling pressure.
Supports: 4,196 – 4,071 – 3,851
Resistances: 4,308 – 4,441 – 4,857
XRP/USDT
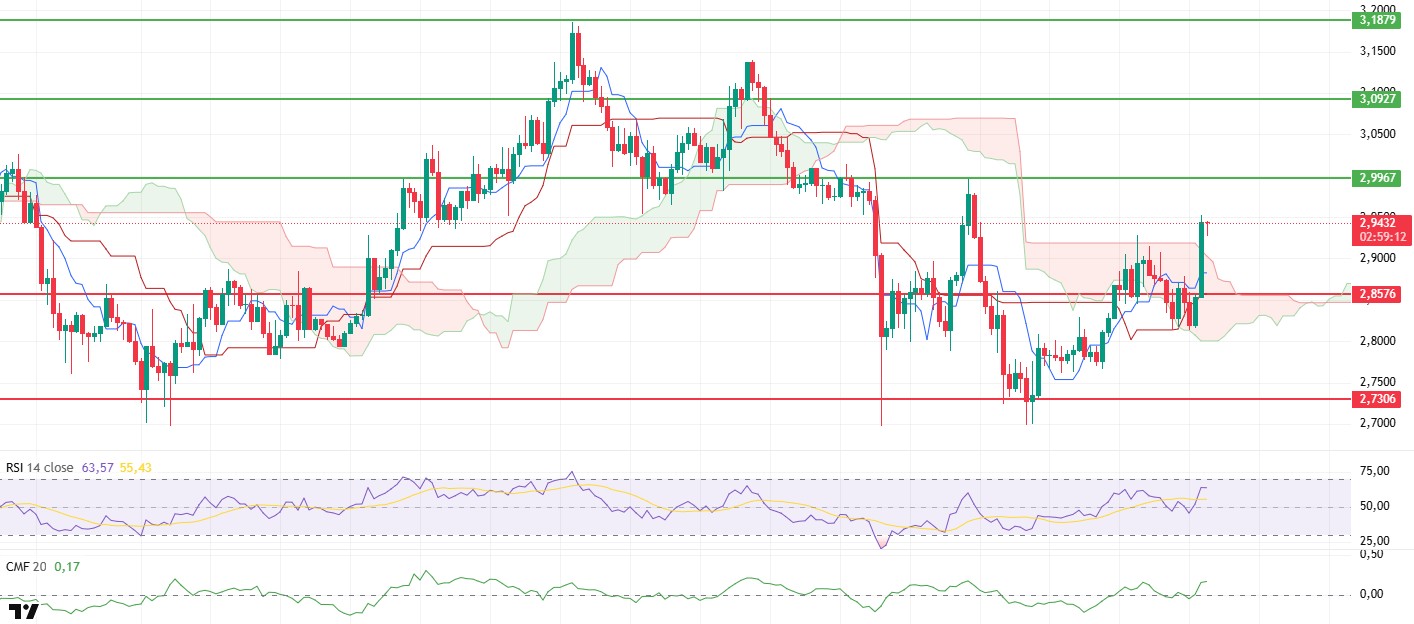
The XRP price gained strong momentum by breaking above the $2.8570 level highlighted in the morning analysis, rising to $2.95. However, at this point, the price retreated slightly amid increased selling pressure and is attempting to stabilize at the $2.93 level.
The Chaikin Money Flow (CMF) indicator returning to positive territory indicates strong liquidity inflows into the market and that buyers have regained control throughout the day. This confirms that the market still has strong buyer support despite selling pressure.
The Relative Strength Index (RSI) indicator breaking above the 50 level and the MA line below it signals that buyers are regaining strength, supporting momentum. This pattern stands out as a factor reinforcing the continuation of the upward trend in the short term.
In the Ichimoku indicator, the price rising above the kumo cloud has clearly shifted the market outlook to positive. Remaining above the Tenkan and Kijun levels indicates that buyers have regained technical superiority.
In general, XRP is expected to test the significant resistance level of $2.99 in the evening hours. If it manages to stay above this level, the upward movement could extend towards the $3.05 level. On the other hand, the $2.8570 level stands out as a critical support point, and if it falls below this level, short-term selling pressure could increase again.
Supports: 2.8576 – 2.7306 – 2.6513
Resistances: 2.9967 – 3.0927 – 3.1879
SOL/USDT
VisionSys AI has entered into a special agreement with Marinade Finance. Under the agreement, a Solana-based treasury program with a maximum value of $2 billion has been launched.
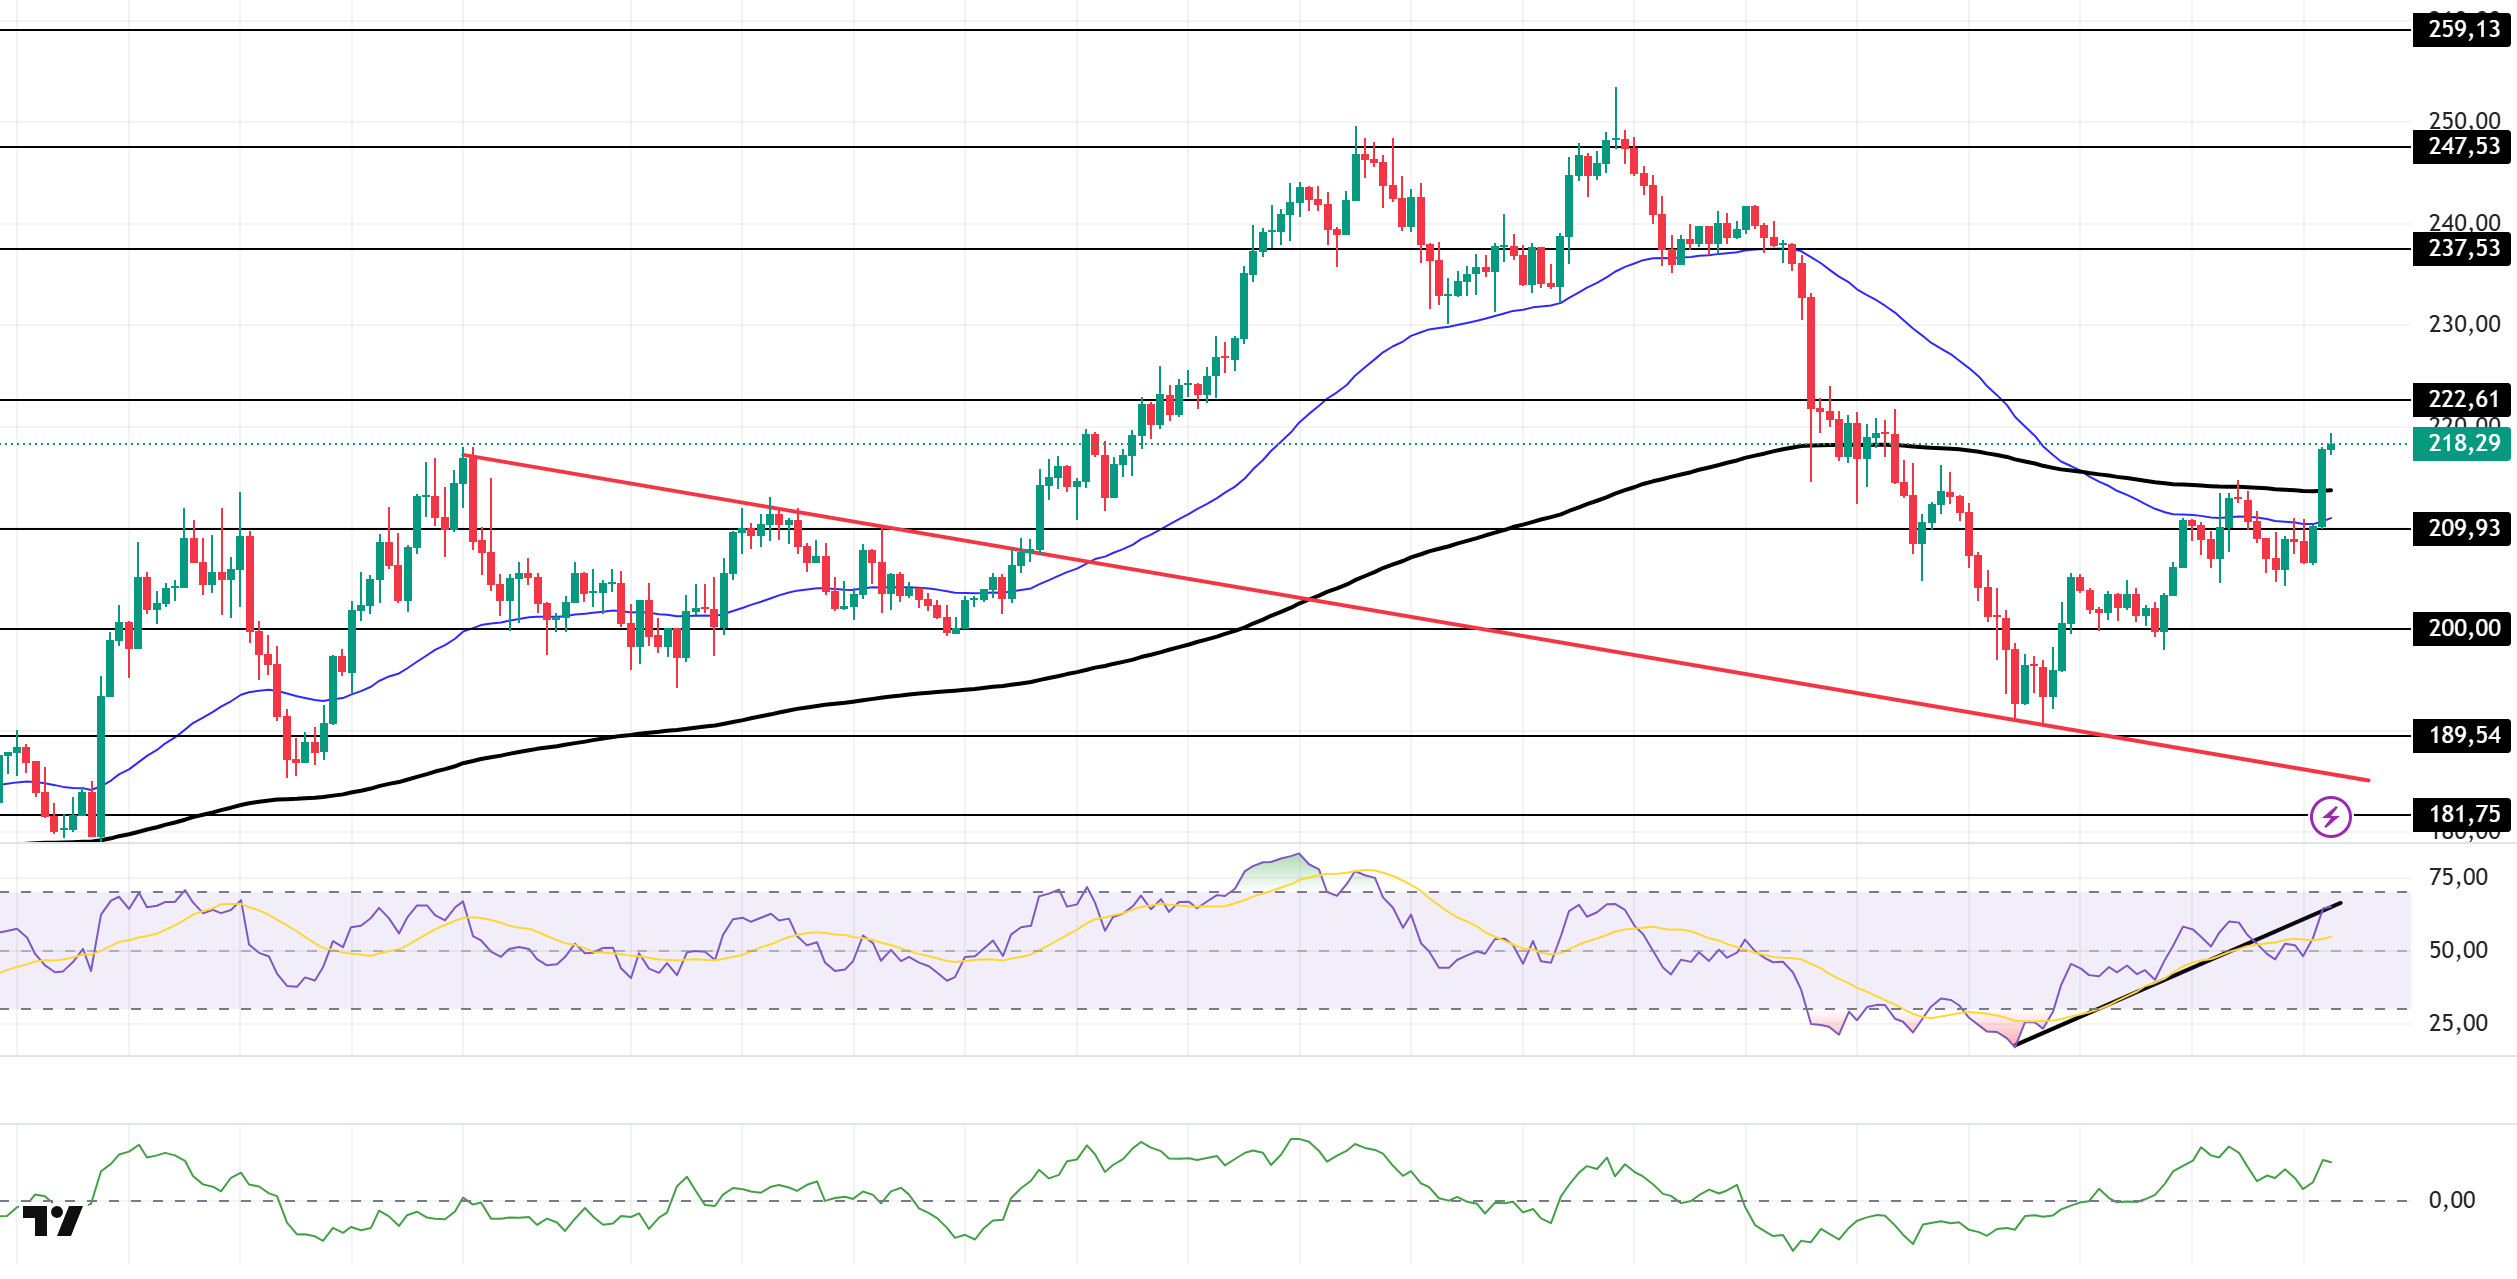
SOL price showed an upward trend during the day. The asset continues to trade in the upper region of the descending trendline that began on August 29. The price, which broke above the 50 EMA (Blue Line) and 200 EMA (Black Line) moving averages with a strong bullish candle, is currently maintaining its momentum. If the upward trend continues, it could test the $222.61 level. In pullbacks, the $209.93 level can be monitored.
On the 4-hour chart, it continues to be in the lower region of the 50 EMA (Exponential Moving Average – Blue Line) and 200 EMA (Black Line). This indicates that there may be a downward trend in the medium term. At the same time, the price being above both moving averages shows us that the asset is trending upward in the short term. The Chaikin Money Flow (CMF-20) remained in positive territory. However, an increase in money inflows could push the CMF to the upper levels of the positive zone. The Relative Strength Index (RSI-14) rose into positive territory. It also remained in the lower region of the upward trend that began on September 25. However, it is currently testing this upward trend as resistance. If it breaks through this level, buying pressure may strengthen. In the event of an upward movement due to macroeconomic data or positive news related to the Solana ecosystem, the $222.61 level stands out as a strong resistance point. If this level is broken upwards, the rise is expected to continue. If there are pullbacks due to developments in the opposite direction or profit-taking, the $200.00 level may be tested. A decline to these support levels could increase buying momentum, presenting a potential upside opportunity.
Supports: 209.93 – 200.00 – 189.54
Resistances 222.61 – 237.53 – 247.53
DOGE/USDT
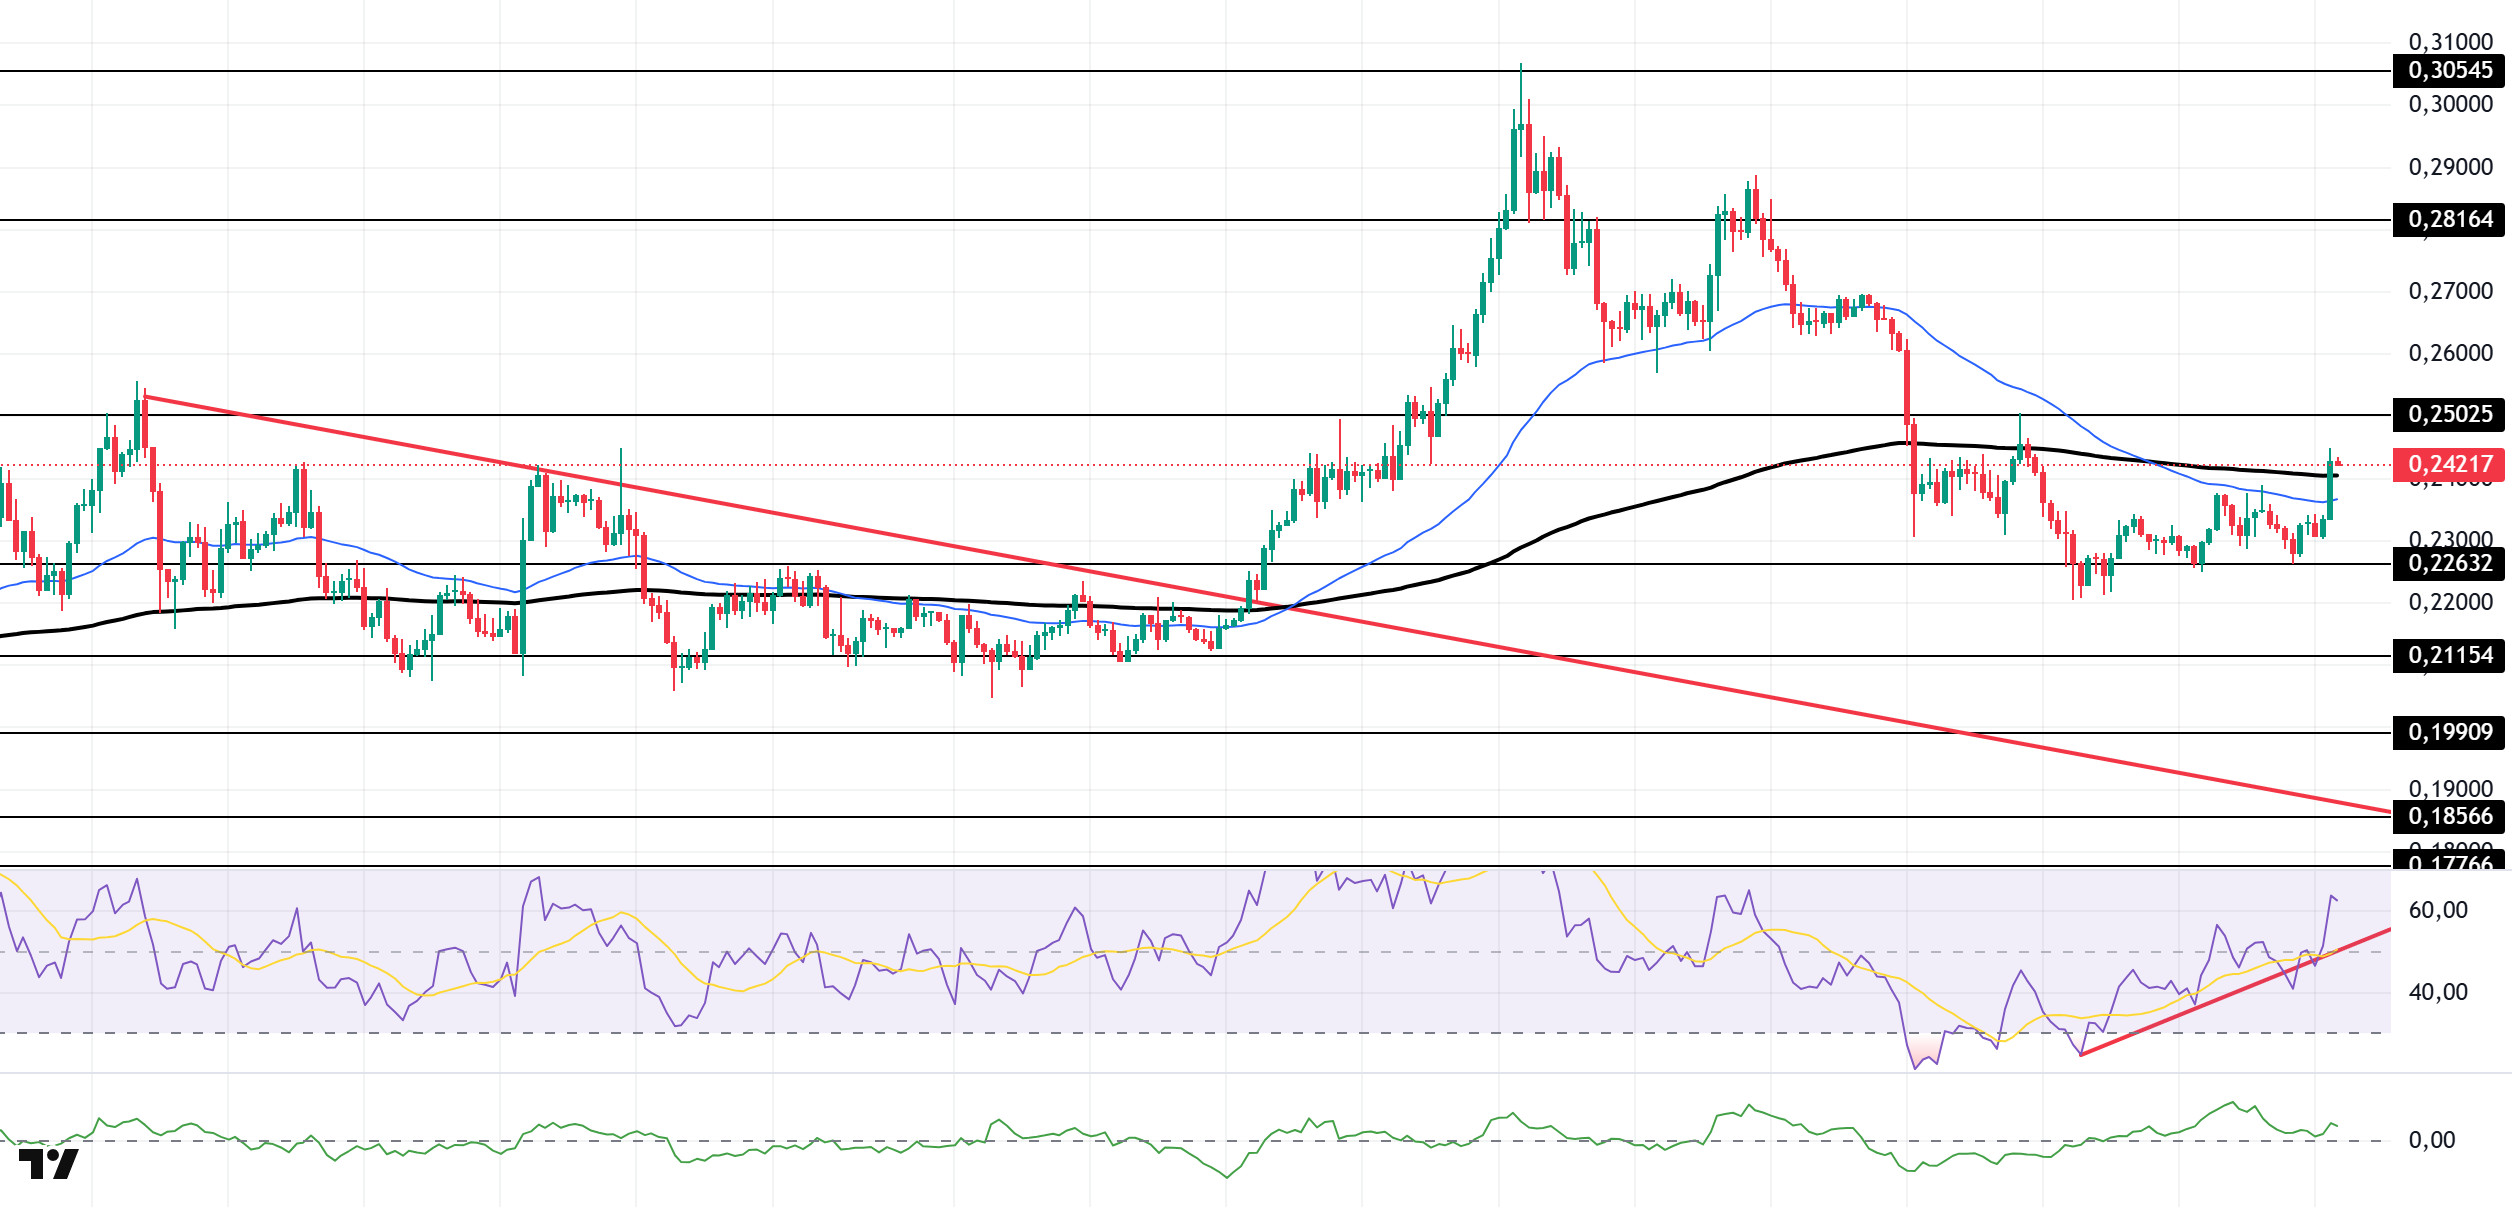
The DOGE price experienced an uptrend during the day. The asset continued to trade above the downtrend line that began on August 14. As of now, the price has broken above the 200 EMA (Exponential Moving Average – Black Line), a strong resistance level, and managed to stay above this level. If momentum continues, it could test the strong resistance level of $0.25025. In case of a pullback, it could test the $0.22632 level as support in candle closes below the moving average.
On the 4-hour chart, the 50 EMA (Exponential Moving Average – Blue Line) remained below the 200 EMA (Black Line). This indicates a downward trend in the medium term. The price being above both moving averages indicates a short-term upward trend. The Chaikin Money Flow (CMF-20) managed to stay in positive territory. Additionally, an increase in money inflows could push the CMF to the upper levels of the positive zone. The Relative Strength Index (RSI-14) gained upward momentum from the rising direct support that began on September 25 and moved into positive territory. This indicates that buying pressure may continue. In the event of potential increases driven by political developments, macroeconomic data, or positive news flow within the DOGE ecosystem, the $0.25025 level stands out as a strong resistance zone. Conversely, in the event of negative news flow, the $0.21154 level could be triggered. A decline to these levels could increase momentum and potentially initiate a new upward wave.
Supports: 0.22632 – 0.21154 – 0.19909
Resistances: 0.25025 – 0.28164 – 0.30545
TRX/USDT
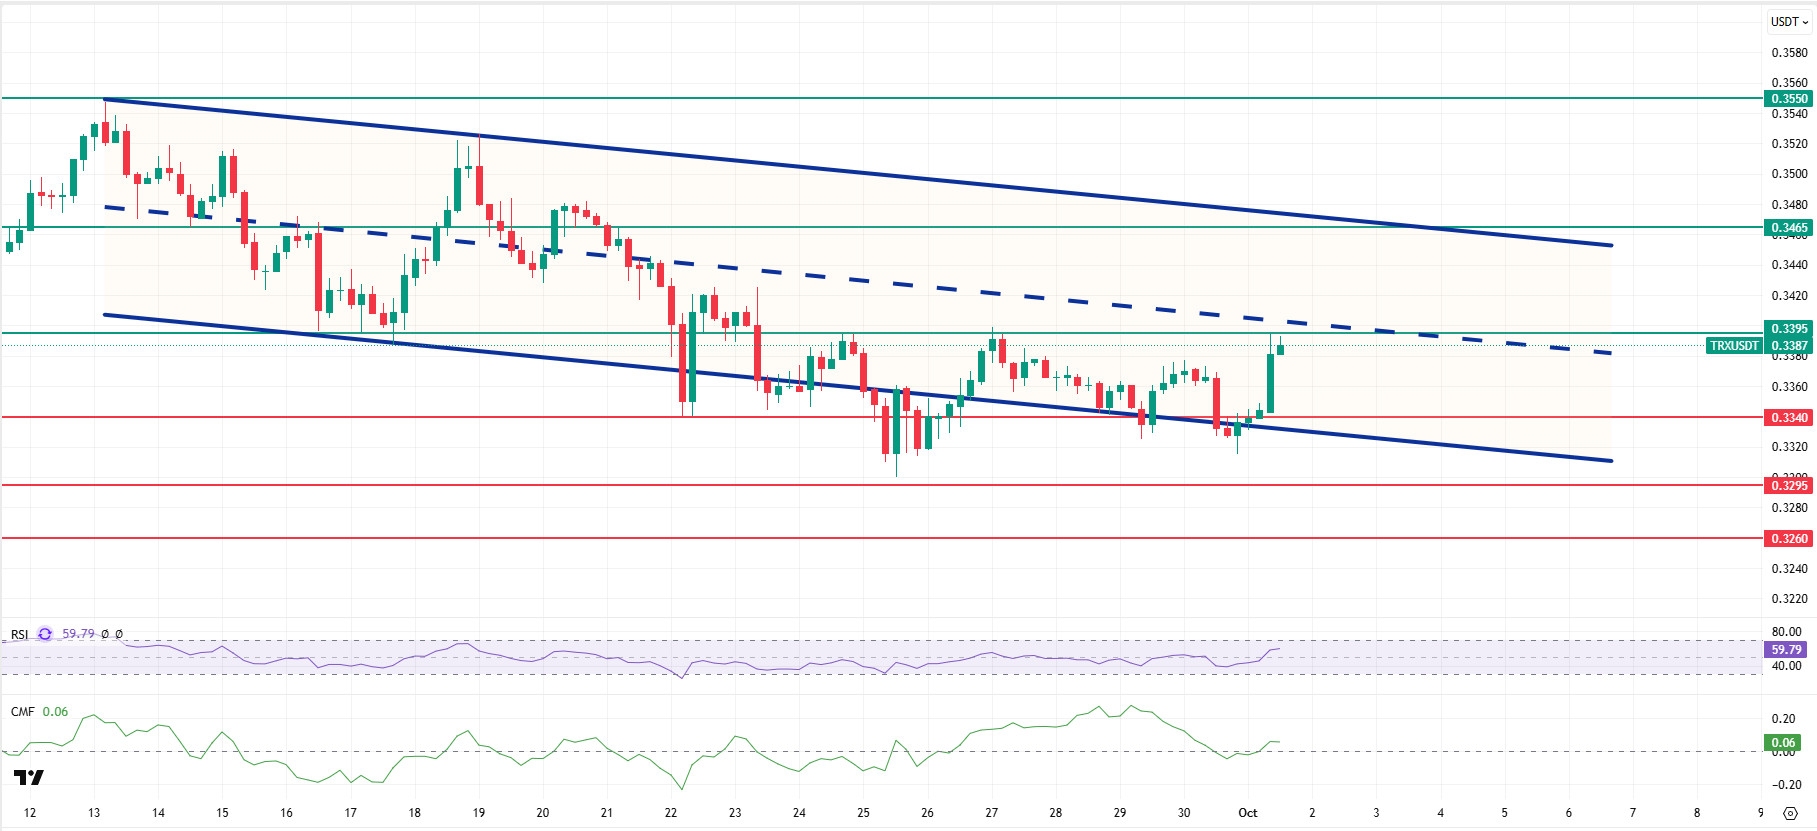
As mentioned in this morning’s analysis, TRX failed to break above the 0.3395 resistance level after the recent rally and continues to move within a bearish channel, currently trading at 0.3387. Currently in the middle of the bearish channel, TRX is trading very close to the 0.3395 resistance level on the 4-hour chart. The Relative Strength Index (RSI) value is seen to be close to the overbought zone at 59. In addition, the Chaikin Money Flow (CMF) indicator continues to remain above the zero level at a value of 0.06, indicating that money inflows are continuing. The CMF remaining in positive territory can be considered an indicator that the price may experience an increase.
In light of all these indicators, TRX may decline slightly in the second half of the day and move towards the lower band of the bearish channel. In such a case, it may test the 0.3340 support level. If it closes below the 0.3340 support level, the decline may continue, and it may test the 0.3295 support level. If the candle does not close below the 0.3340 support level, with the CMF remaining in positive territory, inflows could strengthen considerably and, following a likely rise in price, it could test the 0.3395 and 0.3465 resistance levels in succession.
On the 4-hour chart, 0.3260 is an important support level, and as long as it remains above this level, the upward trend is expected to continue. If this support level is broken, selling pressure may increase.
Supports: 0.3340 – 0.3295 – 0.3260
Resistances: 0.3395 – 0.3465 – 0.3550
SHIB/USDT
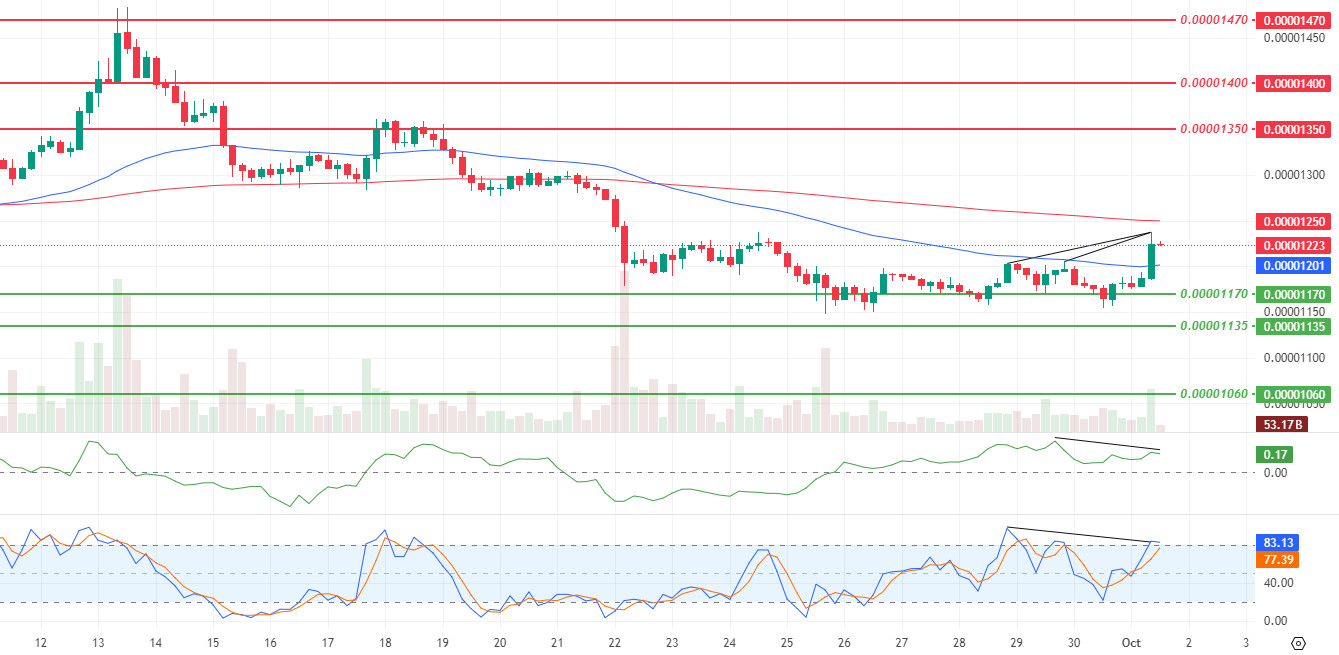
The daily transaction count in the Shibarium ecosystem fell below 10,000 to 7,500, signaling a sharp break from the network’s August daily averages of 1.2 to 1.4 million and reinforcing the perception of a temporary decline in adoption. While the total number of transactions was updated to 1 billion 568 million 456 thousand 850, Lucie, the ecosystem’s marketing leader, made a statement addressing concerns within the community, emphasizing that Shibarium is “wounded but not broken.” noting that verification controls have been tightened following recent exploits, security and audit processes have been strengthened, and the infrastructure is robust enough to handle high-volume transactions. In this context, the team views the slowdown in active addresses and transactions as a temporary setback, highlighting the message that they are confident in the network’s recovery capacity with the continued support of the SHIB Army and that activities will be closely monitored throughout October to see if they regain momentum.
The technical outlook shows short-term strengthening signals, with momentum and trading volume increases, along with rising volatility, pushing price behavior upward in a reaction-focused band. With a 4-hour close above the $0.00001224 level, the price has settled above the 50 Exponential Moving Average (EMA) and is currently trading between the EMA 50 and EMA 200, which represents the first test due to the intermediate resistance cluster in this area.
The Chaikin Money Flow (CMF) remains in positive territory and trending upward, confirming a recovery in inflows. However, the negative divergence (black line) between the price and the Stochastic Oscillator and CMF suggests the rally may tire in the short term and volatility could increase during upward attempts. Therefore, it is too early to assume that the momentum is sustainable without staying above $0.00001240 and especially above the EMA 200. If this condition is met, intermediate resistances at $0.00001255 and $0.00001350 may come into play. On the downside, the range between $0.00001190 and $0.00001170 is being monitored as the current defense line. As long as it remains above this zone, the short-term positive scenario is preserved. However, if the impact of negative divergences increases, the possibility of a strength test in this band rises. (EMA50: Blue line, EMA200: Red line)
Supports: 0.00001170 – 0.00001135 – 0.00001060
Resistances: 0.00001350 – 0.00001400 – 0.00001470
Legal Notice
The investment information, comments, and recommendations contained herein do not constitute investment advice. Investment advisory services are provided individually by authorized institutions taking into account the risk and return preferences of individuals. The comments and recommendations contained herein are of a general nature. These recommendations may not be suitable for your financial situation and risk and return preferences. Therefore, making an investment decision based solely on the information contained herein may not produce results in line with your expectations.

