
Technical Analysis
BTC/USDT
While Jefferson’s cautious message and Waller’s message in favor of a December cut at the Fed deepened the policy divide, the lack of data, compounded by the shutdown effect, remains at the center of the agenda. Hassett from the White House stated that the shutdown caused over $92 billion in damage to the economy and that AI-driven structural changes in the labor market have become apparent. On the geopolitical front, Trump’s support for secondary sanctions against Russia increased risk perception, while diplomatic tensions between Japan and China over Taiwan continued. On the crypto side, Mt. Gox’s transfer of over 10,000 BTC and El Salvador’s BTC purchases attracted attention.
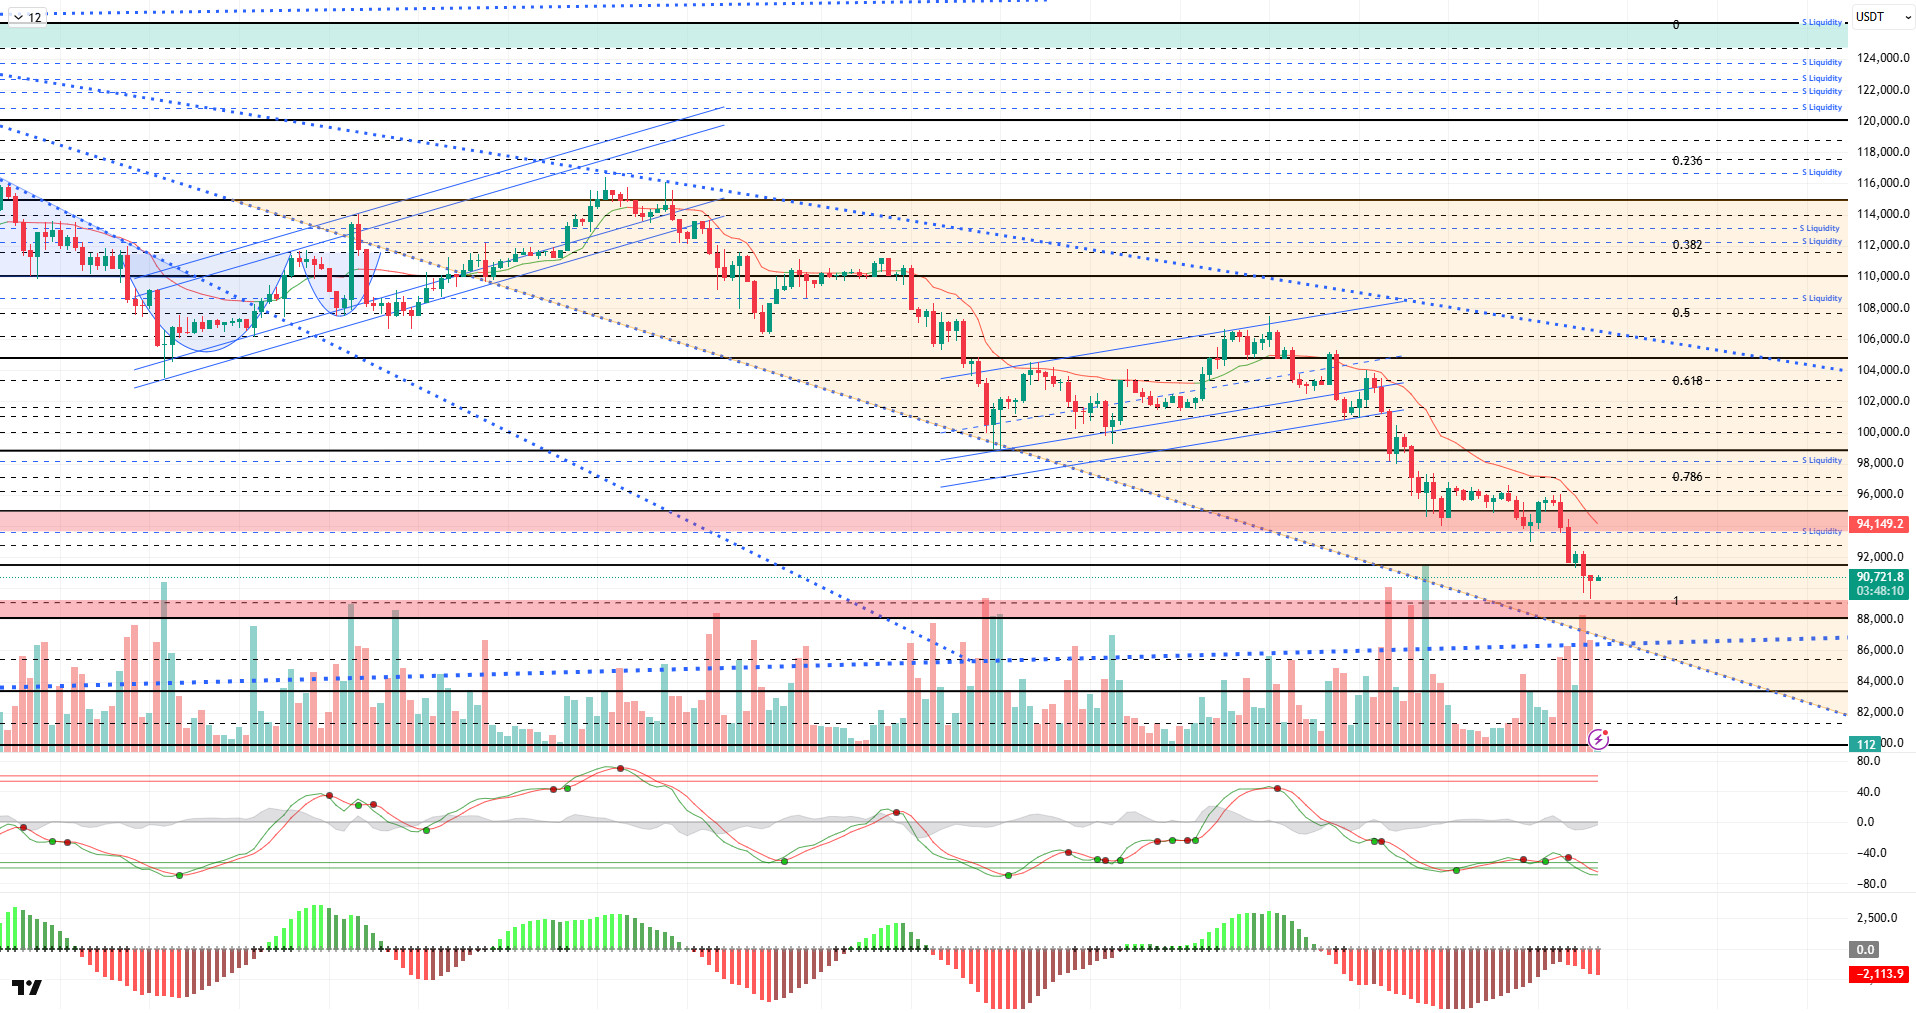
From a technical perspective, selling pressure on BTC deepened once again, and the search for a new low continued. Yesterday, the price occasionally exceeded the 95,000 level but failed to hold above this region and fell back to 89,400 with heavy selling. The lack of an upward reaction in BTC, which has continued its downward trend since its ATH level, indicates that bears continue to dominate the market in the short term.
Technical indicators reflect indecision, with the Wave Trend (WT) oscillator generating buy/sell signals in the oversold zone, while the Momentum (SM) indicator’s histogram failed to gain strength after reaching maximum weakness in the negative zone. The Kaufman Moving Average (KAMA) is currently at $94,600, positioned above the price.
According to liquidation data, the recent decline has largely liquidated short- and medium-term buy levels, while annual buy levels appear to be targeted. However, the weight of sell levels continues to be evident. Selling pressure intensified at the 93,000 level during the recent decline, while accumulation continues within the 97,000–98,000 range over a broader timeframe.
In summary, the weakening of expectations for Fed interest rate cuts, the decline in the value of technology stocks in global markets, and increasing geopolitical risks are significantly increasing selling pressure in the market. On the technical side, the price’s failure to hold above the 95,000 reference zone, coupled with closes below this level, triggered a search for new lows, and the price fell to the 89,000 level. The 89,000 zone being a gap area allowed the price to rebound from there. Going forward, closes above the 90,000 level are critical for the price to regain momentum, and the 93,700 resistance will be monitored in an upward movement. In the alternative scenario, if the downtrend continues unabated, the 89,000 support will be monitored; if this level is broken, sales are expected to deepen further due to the long squeeze effect.
Supports: 90,000 – 89,000 – 86,000
Resistances: 91,400 – 93,700 – 95,000
ETH/USDT
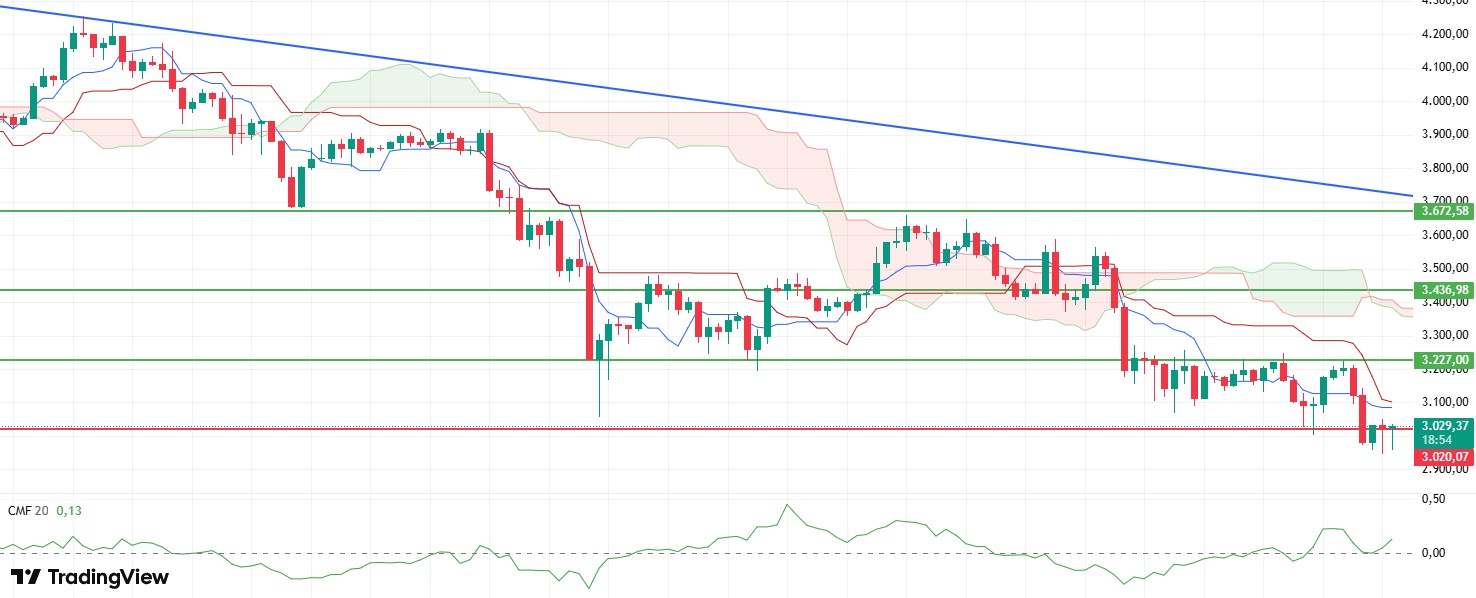
The ETH price briefly dipped below the $3,020 support level yesterday evening due to selling pressure, but buyers regained strength this morning and the price began to hold onto this important area. The fact that there has been no sustained close below the support zone indicates that the market has not yet entered a strong downtrend and that buyers continue to defend this level. In the short term, the $3,020 level acting as support is the key factor slowing the downward trend.
The liquidity outlook supports the recovery. The Chaikin Money Flow (CMF) indicator’s rebound and subsequent upward movement after falling to the zero line indicates that there has been no significant liquidity outflow from the market. This movement by the CMF suggests that, despite the recent decline, institutional buying or demand in the spot market has not completely disappeared and that the buying side is beginning to regain strength.
The Relative Strength Index (RSI) indicator remains under pressure. The indicator has stabilized in low territory following a sharp pullback and shows that momentum has weakened significantly. This structure indicates that even if buyers react, there is still no strong desire to reverse the trend, which may cause upward movements to remain limited in the short term.
The Ichimoku indicator maintains the overall weak structure. The price losing the Tenkan level again weakens the short-term positive outlook, while remaining below the Kijun and kumo cloud indicates that the trend is still clearly under seller control. The price’s movement below the cloud reminds us that sufficient conditions have not yet formed for upward attempts to create a strong trend reversal.
The $3,020 support level stands out as the most critical level of the day in the overall outlook. If the price manages to hold above this support, a new upward reaction wave could form thanks to the positive liquidity flow supported by CMF and CVD. In such a scenario, the $3,115 and $3,200 levels could come back into focus. However, a close below $3,020 could accelerate the decline and pave the way for testing the $2,950 and lower support levels.
Below the Form
Supports: 3,020 – 2,760 – 2,550
Resistances: 3,227 – 3,436 – 3,672
XRP/USDT
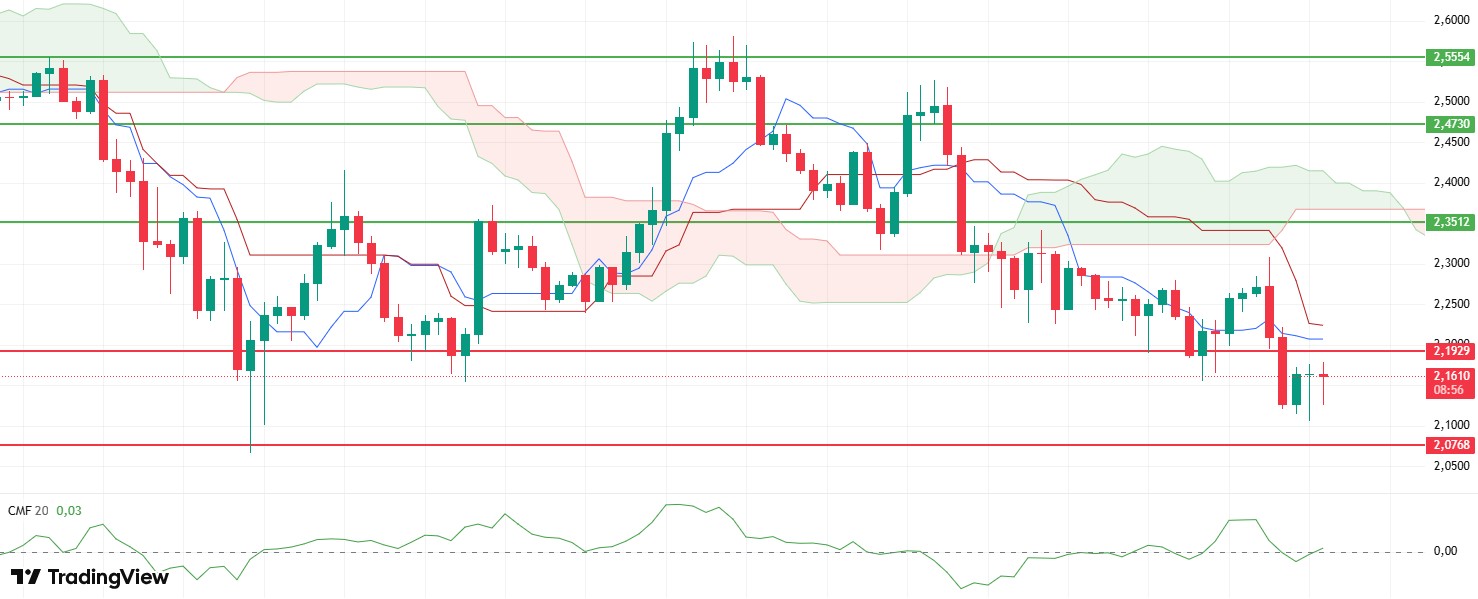
XRP fell to $2.10 after losing its $2.19 support level yesterday as selling accelerated. Buying interest from this area pushed the price back up to $2.16. Despite increasing selling pressure, the rapid arrival of buying interest indicates that the search for short-term equilibrium continues.
Chaikin Money Flow (CMF) returned to positive territory despite entering negative territory during the recent decline. The renewed acceleration in liquidity inflows is noteworthy. The recovery of CMF on a day of heavy selling indicates that buyers have not completely withdrawn from the market and are regaining strength in certain areas.
The Relative Strength Index (RSI) continues its weak trend. The lack of momentum suggests that upward attempts may remain limited. The RSI’s failure to show any signs of recovery supports the view that upward movements will remain under pressure in the short term.
The Ichimoku indicator shows a weak outlook. The price is trading below the Kumo cloud. The trend structure has not yet turned positive, and the failure to remain above the Tenkan and Kijun levels indicates that technical pressure persists.
In the short term, the $2.19 level is once again critical. If this area is regained, the possibility of an upward recovery in the XRP price could strengthen and short-term momentum could be supported. Remaining below $2.19, however, could cause the movement to be stuck in a horizontal band and maintain the weak outlook.
Supports: 2.0768 – 1.9092 – 1.7729
Resistances: 2.1929 – 2.3512 – 2.4730
SOL/USDT
SOL will provide staking services for VanEck’s Solana ETF. VanEck’s Solana ETF began trading on Nasdaq. Fidelity announced that it will soon launch a Solana Spot ETF by filing Form 8-A.
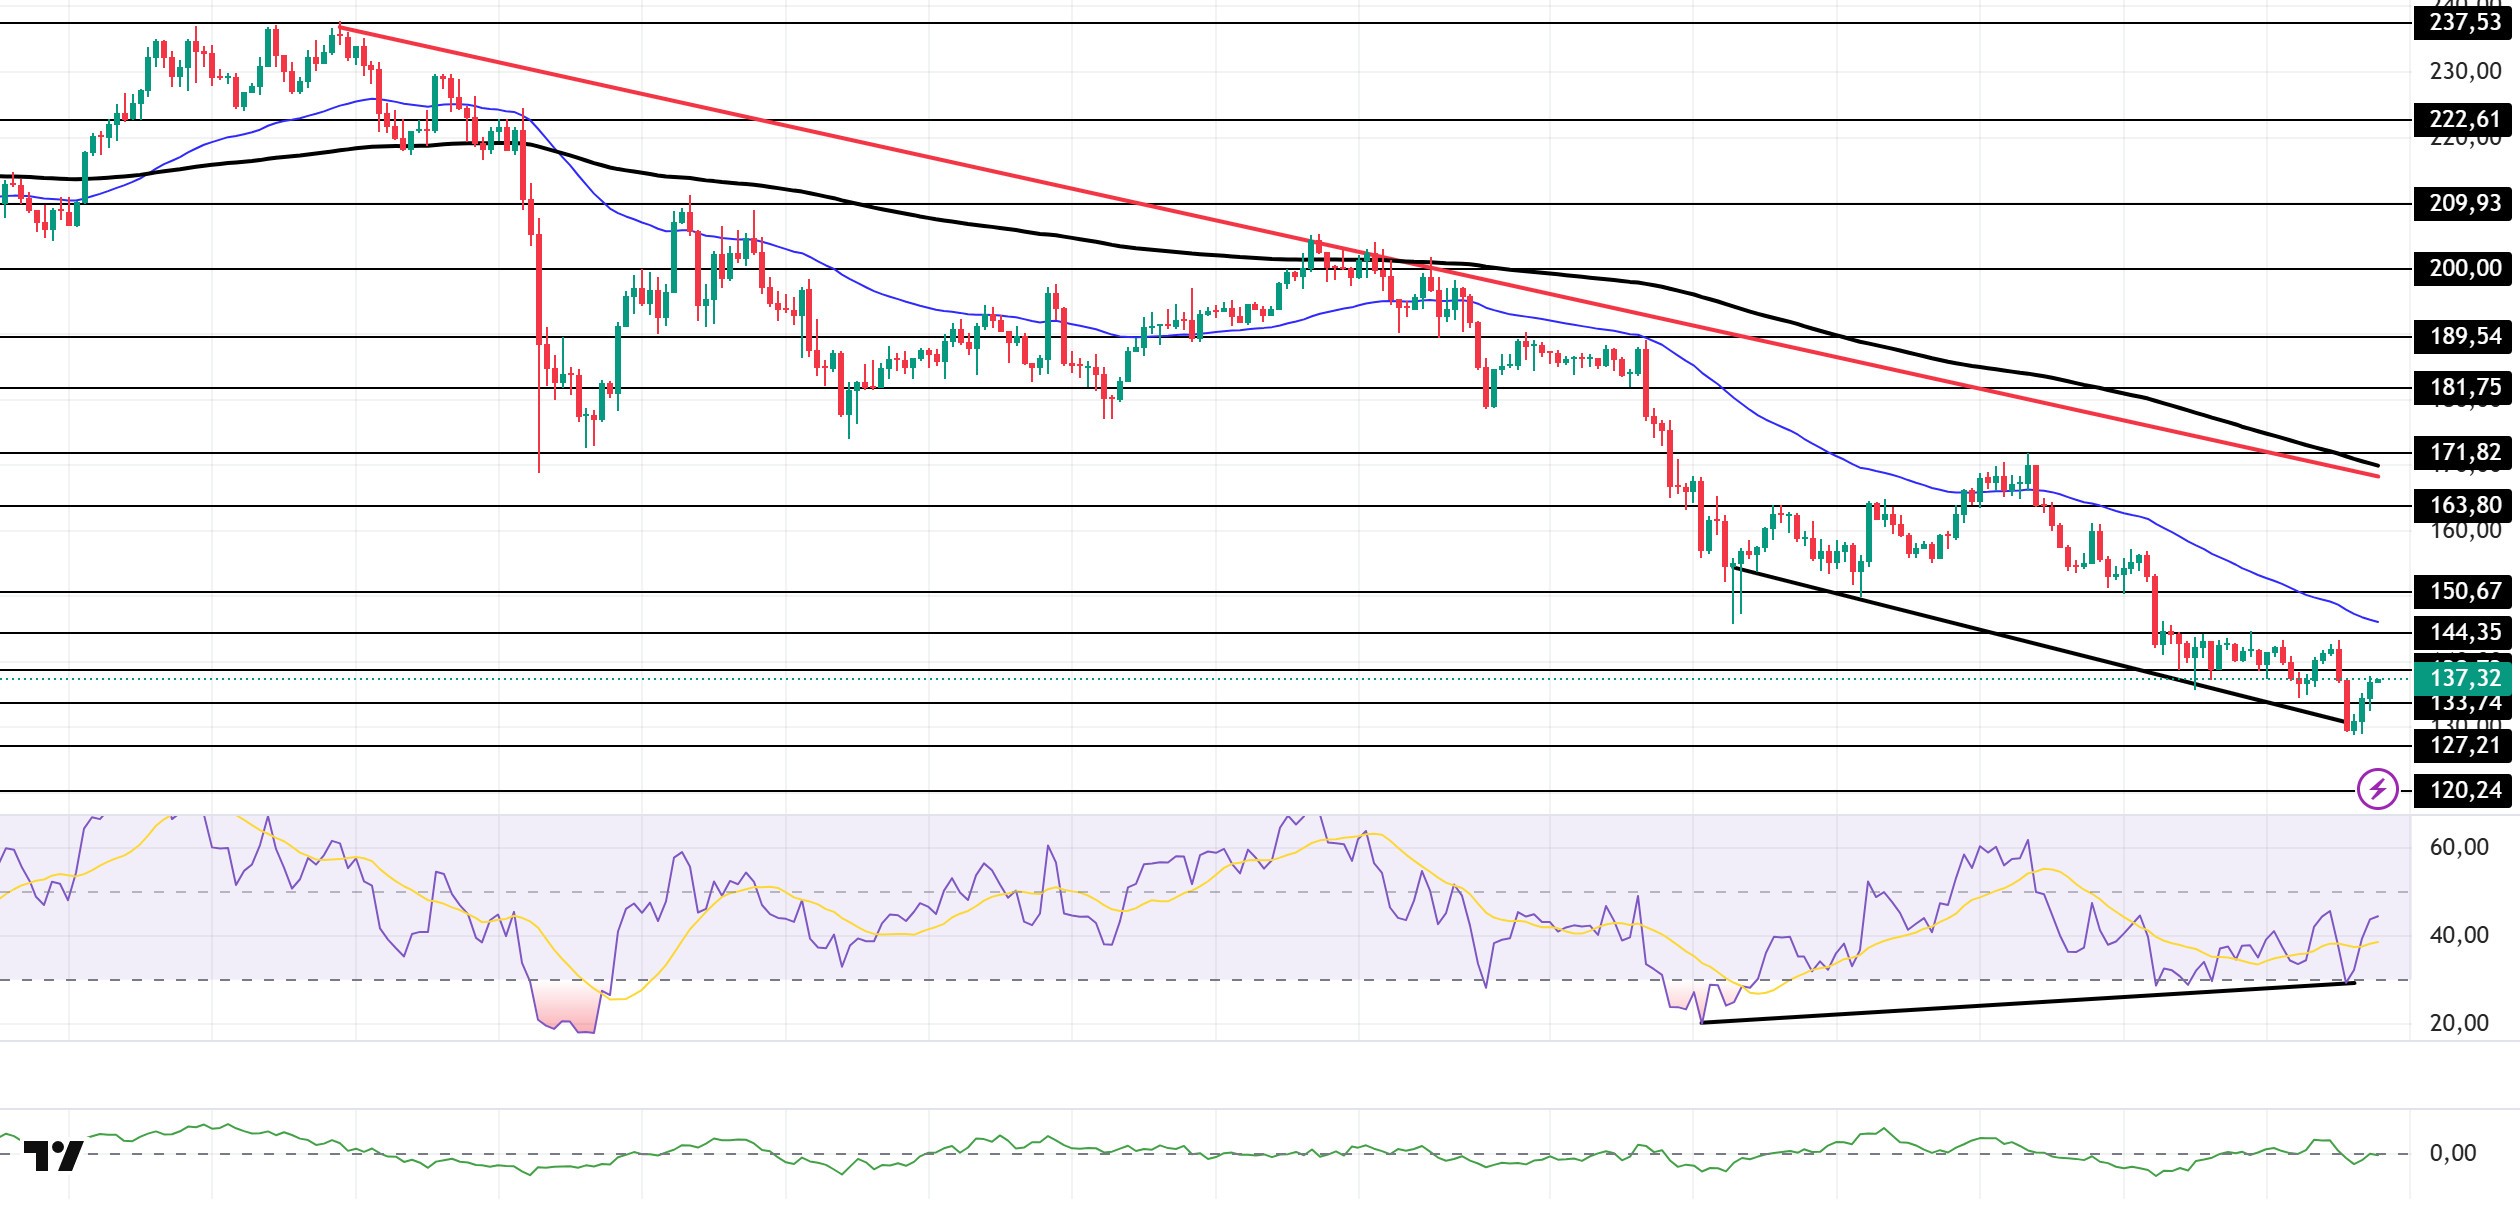
The SOL price showed a slight increase after pulling back. The asset remained in the lower region of the downtrend that began on October 6. Breaking below the strong support level of $133.74 with a strong candle, the price gained momentum and rose above the $133.74 level again. If the rise continues, it may test the 50 EMA (Blue Line) moving average. If the pullback continues, the $127.21 level may act as support.
On the 4-hour chart, it remained below the 50 EMA (Exponential Moving Average – Blue Line) and 200 EMA (Black Line). This indicates a possible downtrend in the medium term. At the same time, the price being below both moving averages shows us that the asset is in a downward trend in the short term. The Chaikin Money Flow (CMF-20) has moved into negative territory. However, the balance of money inflows may continue to keep the CMF in negative territory. The Relative Strength Index (RSI-14) remained in the middle of the negative zone. It is also above the rising line that began on November 4. This indicates increased buying pressure. There is also a bullish divergence. If there is an uptrend due to macroeconomic data or positive news related to the Solana ecosystem, the $150.67 level stands out as a strong resistance point. If this level is broken upwards, the uptrend is expected to continue. If pullbacks occur due to developments in the opposite direction or profit-taking, the $120.24 level could be tested. A decline to these support levels could increase buying momentum, presenting a potential upside opportunity.
Supports: 133.74 – 127.21 – 120.24
Resistances: 138.73 – 144.35 – 150.67
DOGE/USDT
Grayscale filed an S-1 registration statement with the SEC for a Dogecoin Trust ETF.
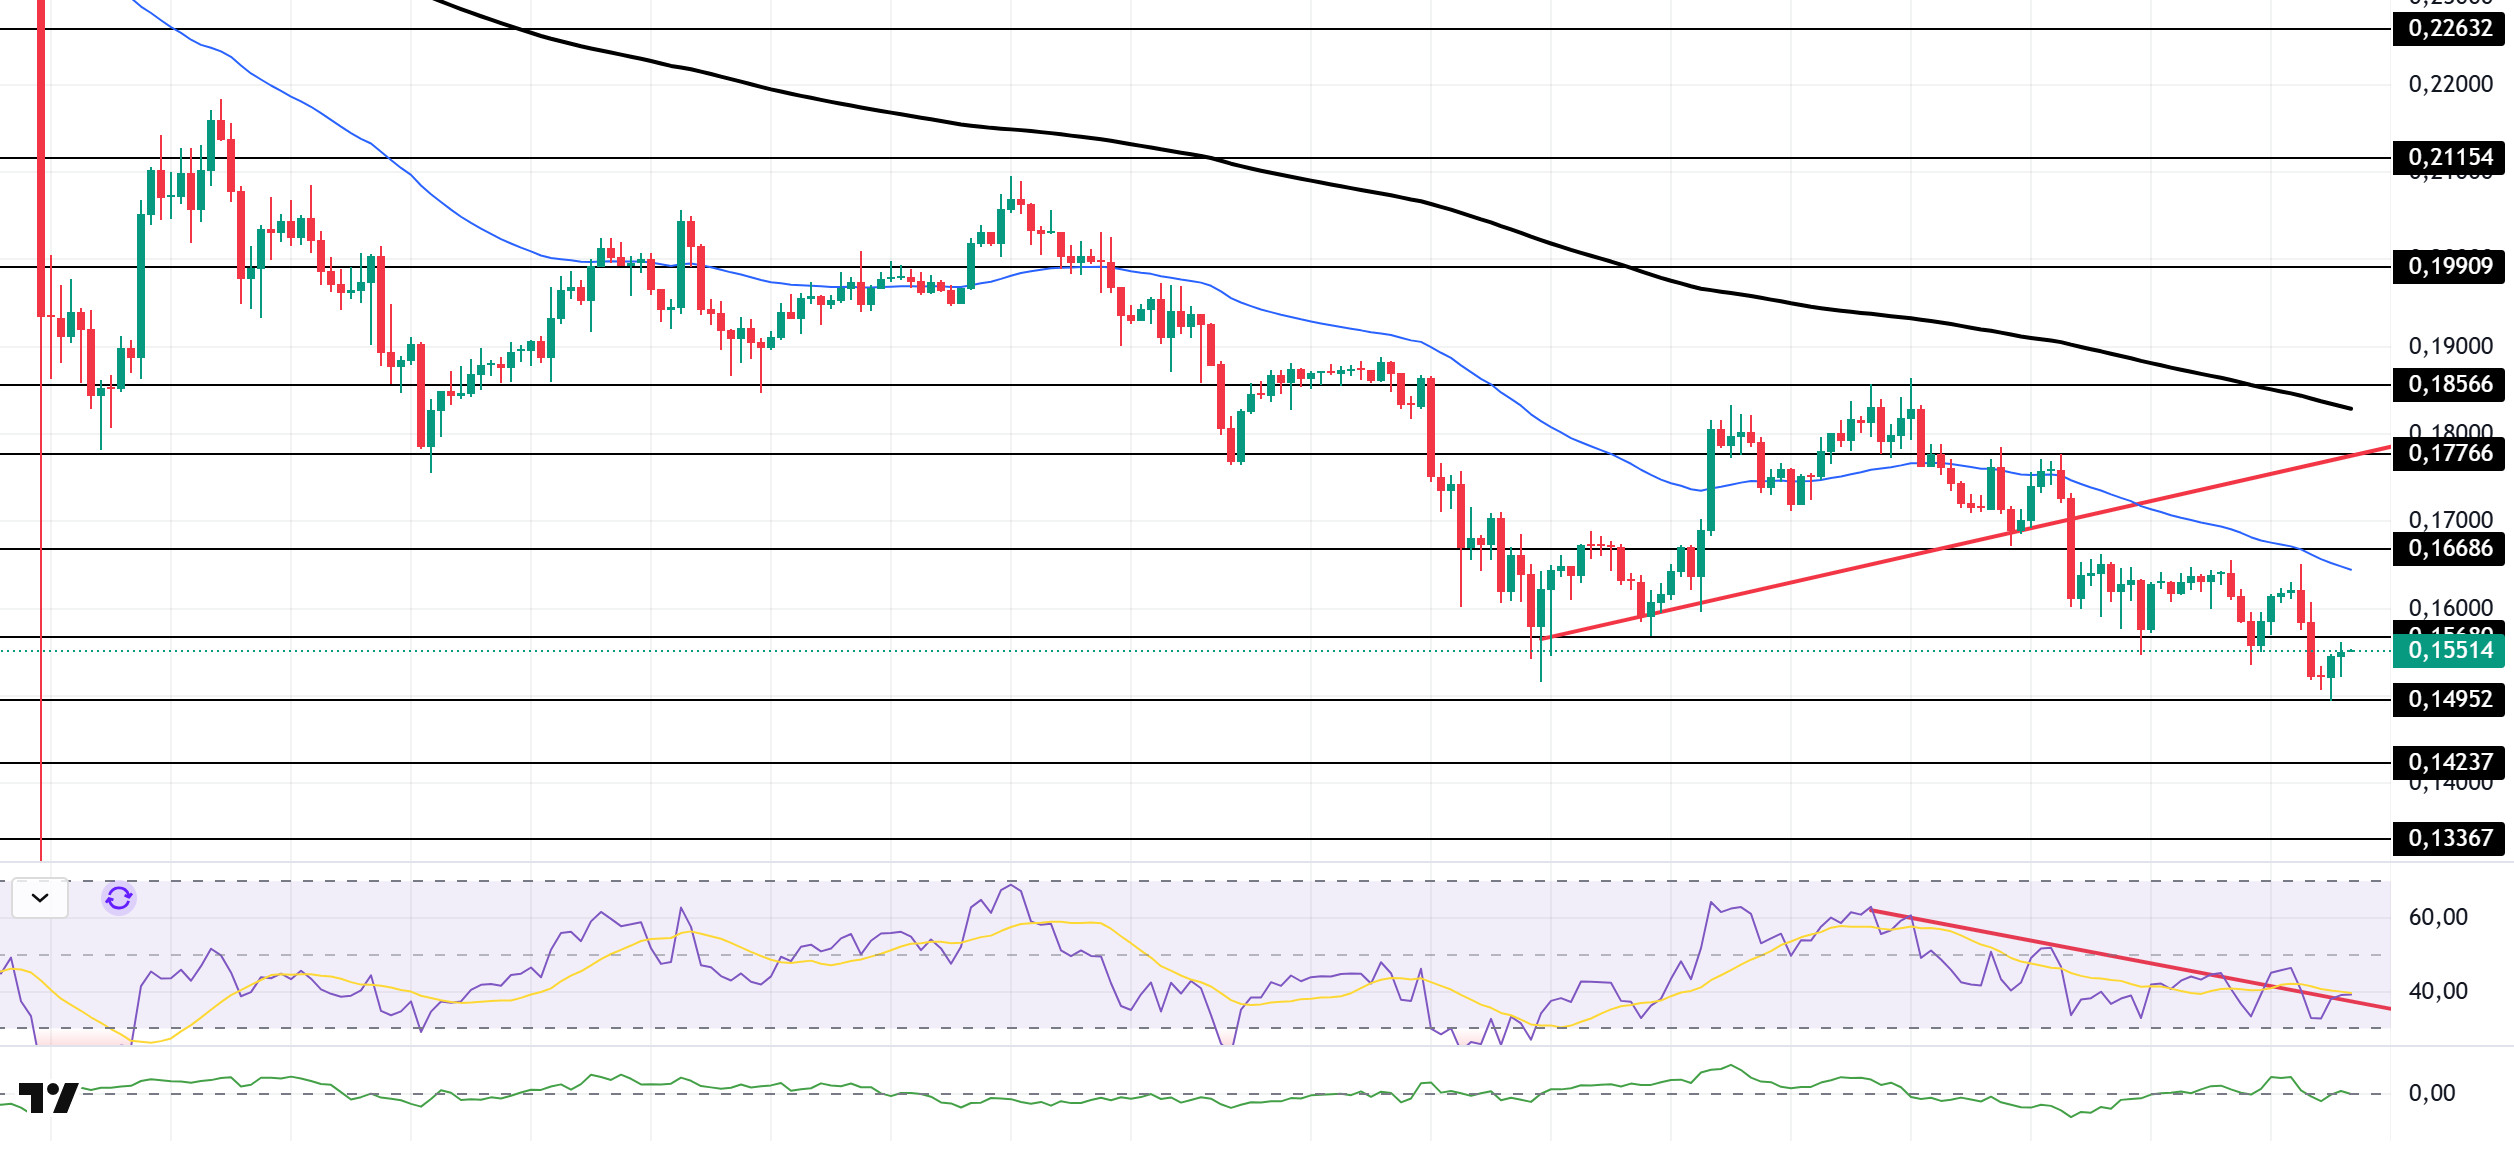
The DOGE price showed a slight decline. The asset continued to trade in the lower region of the upward trend that began on November 4. The price tested the 50 EMA (Blue Line) moving average as resistance, pulled back from there, and fell to the $0.14952 level. Currently, the asset is gaining momentum from the $0.14952 level and rising. If the rise continues, it may test the 50 EMA (Blue Line) moving average as resistance again. If the candle closes below the $0.14952 level, it may test the $0.14237 level.
On the 4-hour chart, the 50 EMA (Exponential Moving Average – Blue Line) remained below the 200 EMA (Black Line). This indicates that a downtrend may begin in the medium term. The price being between the two moving averages indicates that the price is in a decision phase in the short term. The Chaikin Money Flow (CMF-20) is at a neutral level. Additionally, balanced cash inflows may keep the CMF at a neutral level. The Relative Strength Index (RSI-14) has risen to the middle of the negative zone. At the same time, it tested the resistance level of the downward trend that began on November 10. A break above this level could create buying pressure. In the event of an uptrend driven by political developments, macroeconomic data, or positive news flow in the DOGE ecosystem, the $0.17766 level stands out as a strong resistance zone. Conversely, in the event of negative news flow, the $0.14237 level could be triggered. A decline to these levels could increase momentum and initiate a new wave of growth.
Supports: 0.14952 – 0.14237 – 0.13367
Resistances: 0.15680 – 0.16686 – 0.17766
SHIB/USDT
The Shiba Inu team highlighted the significance of SHIB being included in the Green List managed by the Japan Virtual and Crypto Assets Exchange Association, having overcome a major hurdle in one of Japan’s most stringent regulatory environments. Being included in this list, which only features 30 approved assets such as Bitcoin and Ethereum, means that SHIB is officially recognized for its compliance and reliability. Furthermore, the fact that Japanese exchanges will no longer have to go through lengthy approval processes to list SHIB provides a significant advantage in terms of access and liquidity. SHIB, which is currently traded on platforms such as BitTrade, SBI VC Trade, Okcoin, and CoinCheck, is expected to be listed on more exchanges thanks to its Green List status. The Japanese Financial Services Agency’s proposed 20% flat tax rate for Green List assets also stands out as an additional catalyst for SHIB’s adoption and medium-term growth in the country, with the potential to reduce the current tax burden, which can reach up to 55%.
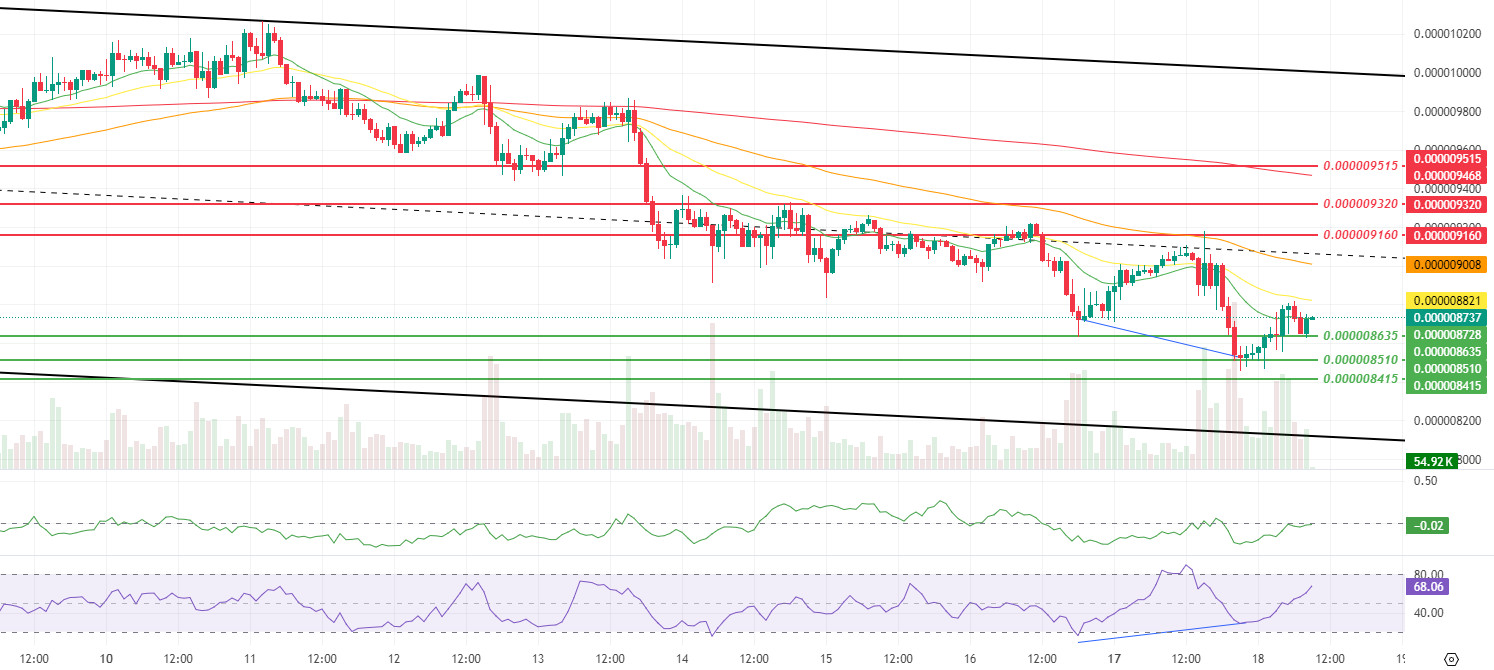
The technical chart shows that the weakening we highlighted in the previous analysis has deepened in favor of the downside, accompanied by critical support breakouts. The price falling below the first support at $0.000008810 and the second support at $0.000008735 confirms that selling pressure is still active in the short term, while the Chaikin Money Flow (CMF) indicator remaining in negative territory indicates that new entries remain weak. However, the observed recovery in momentum and volume, along with the decrease in volatility, indicates that the hardened selling wave is gradually beginning to tire and that the market may transition to a more balanced consolidation phase in the short term. The positive divergence (Blue Line) between the Money Flow Index (MFI) oscillator and the price supports this fatigue signal, suggesting that reaction potential is beginning to build within the current downtrend.
In the short term, the $0.000008635, $0.000008510, and $0.000008415 bands are being monitored as gradual support areas, while in possible rebound attempts, the $0.000009160, $0.000009320, and $0.000009515 levels will be the first important resistance zones. If these resistances are taken back, especially with increasing volume, and the CMF turns positive again, both a confirmation of recovery in momentum and a more meaningful recovery scenario towards the upper bands of the falling channel could come to the fore. However, as long as the price remains below the SMMA 50 and SMMA 200 averages and the descending channel structure is not clearly broken upwards, the movement should be considered a weak downtrend phase with potential for a reaction within the main trend, despite the positive divergence from the MFI ( ). (SMMA9: Green Line, SMMA21: Yellow Line, SMMA50: Orange Line, SMMA 200: Red Line)
Supports: 0.000008635 – 0.000008510 – 0.000008415
Resistances: 0.000009160 – 0.000009320 – 0.000009515
Legal Notice
The investment information, comments, and recommendations contained herein do not constitute investment advice. Investment advisory services are provided individually by authorized institutions taking into account the risk and return preferences of individuals. The comments and recommendations contained herein are of a general nature. These recommendations may not be suitable for your financial situation and risk and return preferences. Therefore, making an investment decision based solely on the information contained herein may not produce results in line with your expectations.

