
Technical Analysis
BTC/USDT
The White House released a new National Security Strategy for Trump’s second term that is more pragmatic and based on economic competition, positioning China primarily as an economic threat. While economic talks between China and the US continued after Busan, radar lock claims between China and Japan increased regional tensions. Progress has been reported on the peace plan between the US and Ukraine aimed at ending the war. Trump said that Russia’s plan for Eastern Europe had been accepted, but that Zelensky’s position was unclear. Expectations for an interest rate cut at this week’s Fed meeting are focused on the signals Powell will give, while investors continue to take positions against the yen despite signals of an interest rate hike from the Bank of Japan.
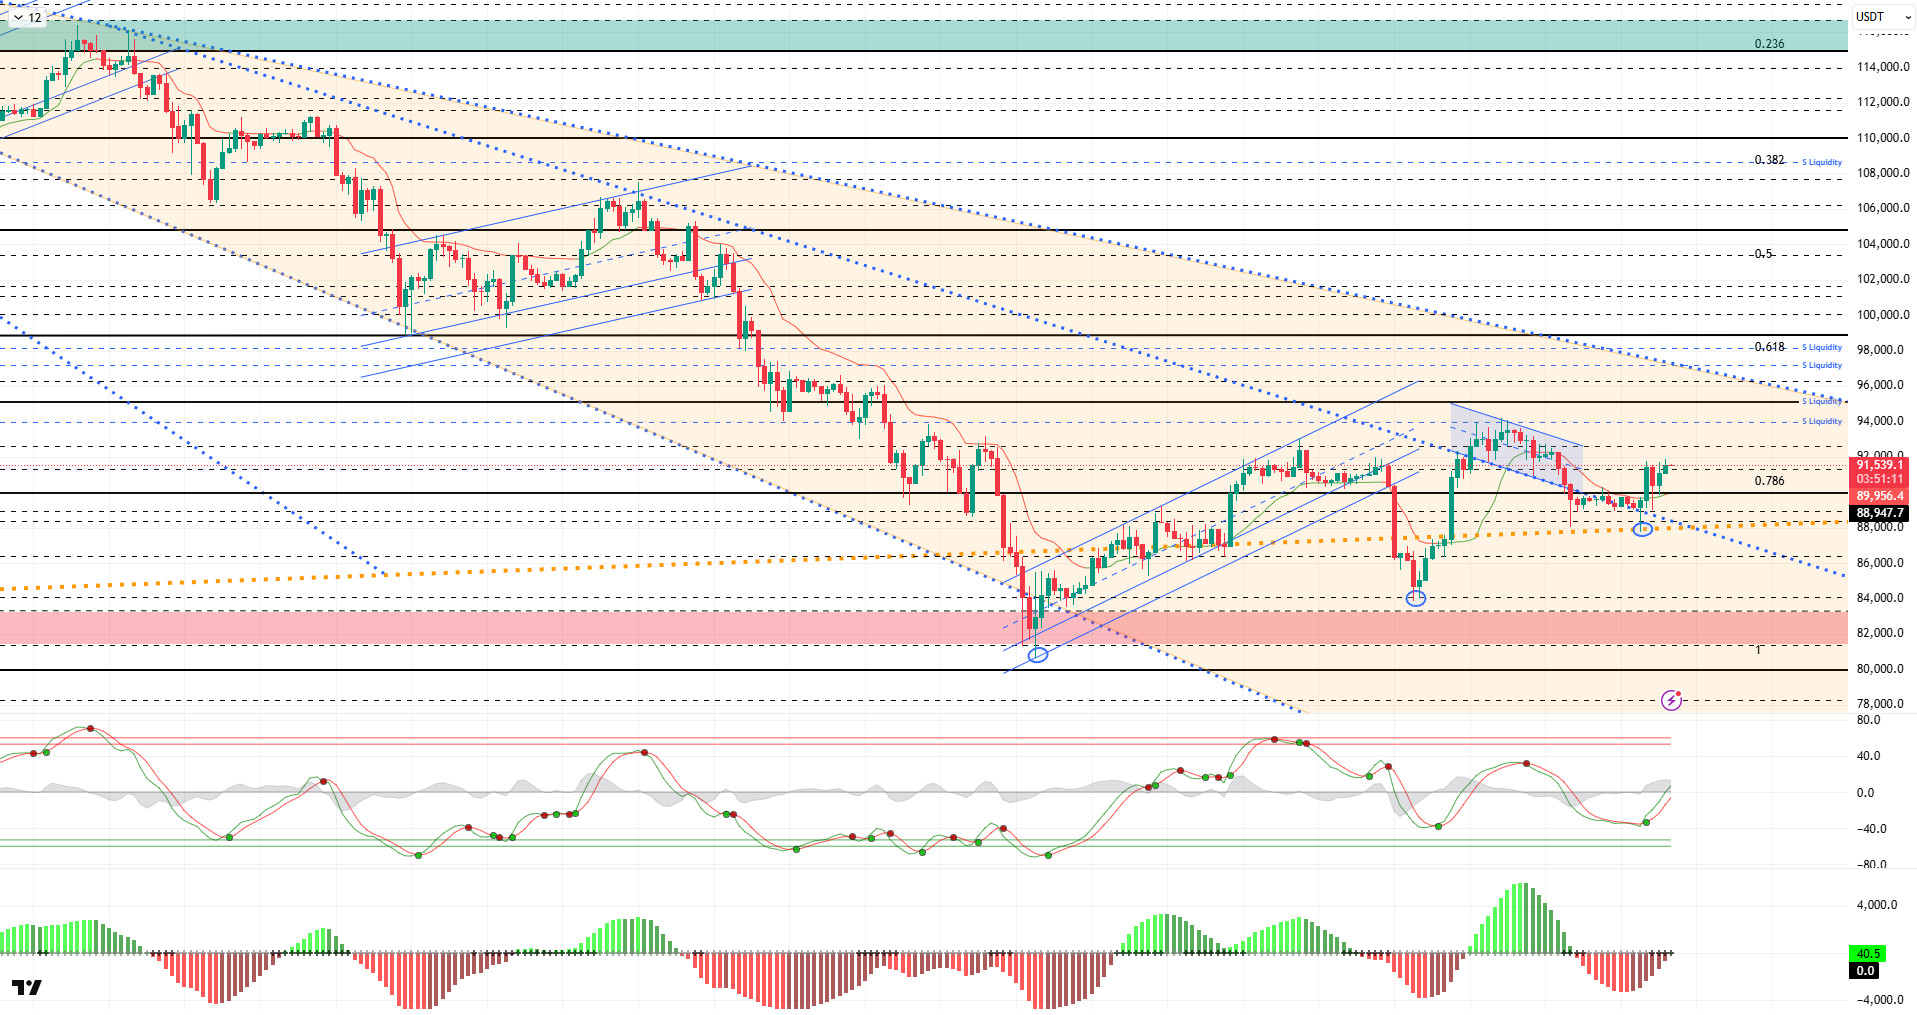
From a technical perspective, BTC broke below the flag pattern it had formed in previous analyses and touched the 87,500 level, which is the level of the major uptrend. The price, which left the decline in this region as a spike, recovered again and crossed above the falling trend line. BTC then spiked to this point once again, quickly recovered, and managed to break above the 90,000 reference zone. At the time of writing, it continues to trade at the 91,500 level.
Technical indicators show the Wave Trend (WT) oscillator giving a buy signal just above the oversold zone, while the histogram on the Squeeze Momentum (SM) indicator gained strength within the negative zone. The Kaufman Moving Average (KAMA) has now crossed below the price at the $89,800 level.
According to liquidation data, the recent decline resulted in liquidation of trades accumulated in the 90,000–88,000 range. Sell-side transactions are intensifying in the short term at the 92,000 – 94,500 level, while in the monthly view, they continue to maintain their intensity within the 97,000 – 98,000 band.
In summary, a new national security strategy was released in the US on the global front. Progress was made towards peace in the Ukraine-Russia war. Regional tensions increased between China and Japan. Technically, after testing the bottom level, the price recovered above the 90,000 level following a downward trend that started from the ATH level. Liquidity data shows that target areas have regained importance and the market has stabilized. After this stage, 90,000 has once again become a critical point for the price to maintain its momentum. Closings and pricing above this level are an important indicator for regaining momentum. In this context, 95,000 stands out as the next target area, and liquidity areas will be monitored once it is passed. In the event of a possible selling pressure, 90,000 will once again emerge as the reference area, and in the event of a breakout, the 87,500 level, where the major uptrend passed, will be monitored.
Supports: 90,000 – 89,000 – 87,800
Resistances: 91,400 – 92,600 – 94,000
ETH/USDT
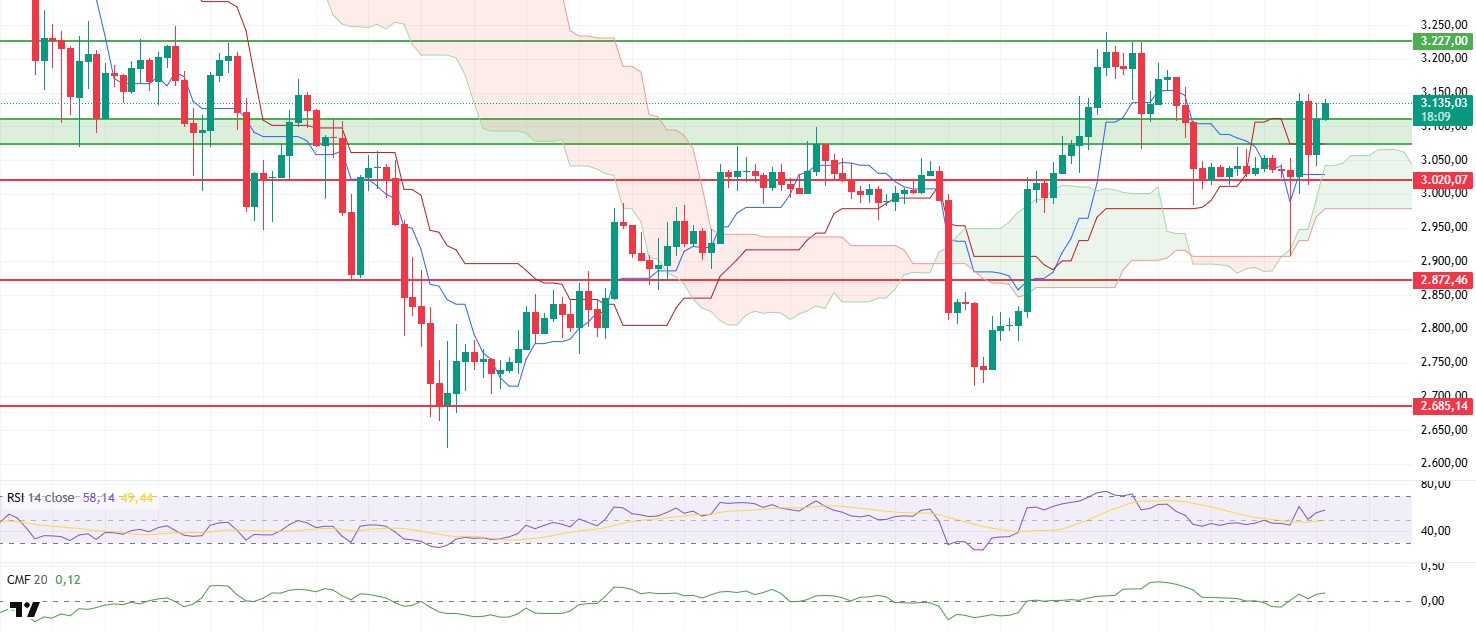
Following Friday’s sell-off, the ETH price first fell to the $3,020 support level, then dropped below this level on Sunday, falling to the upper band of the cloud. However, buyers stepped in at this level, allowing the price to regain the $3,100 level. The outlook still indicates that buyers intend to maintain the trend.
A significant recovery has been observed on the liquidity side over the past 24 hours. The Cumulative Volume Delta (CVD) spot indicator, which had been trending downward for a long time, rose on Sunday, indicating that selling pressure has weakened. At the same time, the Chaikin Money Flow (CMF) indicator rose back into positive territory, confirming that capital inflows have strengthened and price movements are being supported in a healthy manner.
Momentum is also recovering. The Relative Strength Index (RSI) indicator turning upward, supported by both the MA line and the 50 level, shows that buyers are regaining control. This outlook indicates that the upward trend may continue in the short term.
The positive picture is maintained in the Ichimoku structure. The price continuing to stay above the kumo cloud and downward breakouts being prevented by reactionary buying supports the main trend remaining positive. Despite short-term fluctuations, it is still possible to say that the trend direction is upward.
Overall, selling pressure appears to be weakening and buyers are regaining strength. If the price continues to hold above the support area marked by the green rectangle on the chart, attempts to rise towards the $3,150 – $3,227 range can be expected during the day. Breaking above the $3.227 resistance level could increase momentum towards the $3.436 target with a strong breakout. Conversely, if the $3.020 level is lost, the upward outlook could weaken and the price could retreat back towards the kumo support. The critical threshold for ETH is clearly defined. As long as the price holds above $3,020, buyers remain in control.
Below the Form
Supports: 3,070 – 3,020 – 2,872
Resistances: 3,227 – 3,436 – 3,672
XRP/USDT
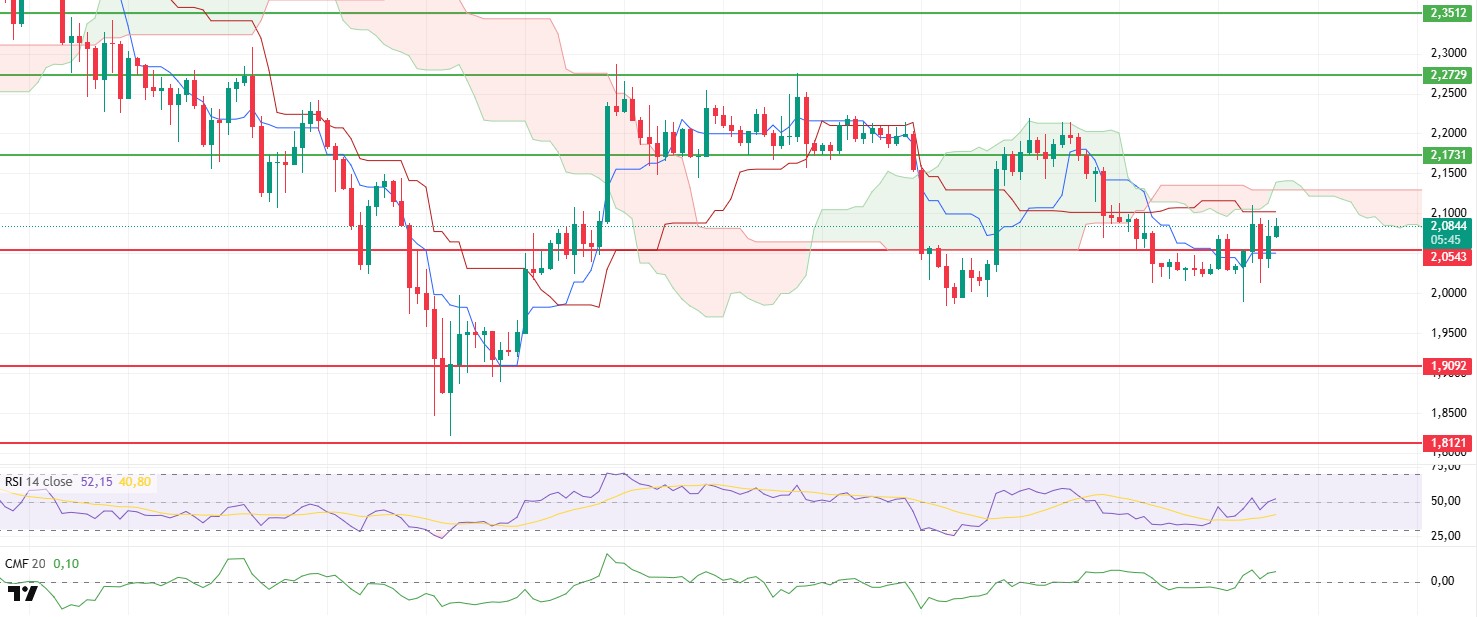
After dipping below the $2.05 support level on Friday, the XRP price moved sideways around $2.00 over the weekend amid low-volume market conditions. Following the weekly close, buyers stepped in, pushing the price back above the $2.05 level. This recovery effort indicates that selling pressure has weakened somewhat.
A more positive picture is emerging on the liquidity front. The Chaikin Money Flow (CMF) indicator returning to positive territory and showing an upward trend signals that capital inflows are gaining momentum again. This makes the signal that buyers are starting to gather strength clearer.
The momentum outlook also supports the recovery. The Relative Strength Index (RSI) indicator continuing its upward movement contributes to maintaining a positive trend in the short term. However, for momentum to reach a level that will form a strong trend, the upward movement needs to continue.
However, there is no clear sign of strength on the trend side. The fact that the price is still trading below the Ichimoku cloud indicates that the sellers’ technical superiority has not been completely broken. Regaining the cloud remains the most critical condition for a structural trend reversal.
Although the overall outlook shows signs of recovery, a definitive breakout has not yet occurred. If it manages to hold above $2.05, a short-term upward momentum towards the $2.10–$2.12 range could develop. Breaking through this region could push the price back to the $2.17 resistance level. In the opposite scenario, closing below $2.05 could increase downward pressure again, pushing the price towards the $1.98–$1.95 support line. XRP is currently in a phase of regaining strength. Both a return to the kumo cloud and continued upward liquidity movements will be decisive in clarifying the direction.
Supports: 2.0543 – 1.9092 – 1.8121
Resistances: 2.1731 – 2.2729 – 2.3512
SOL/USDT
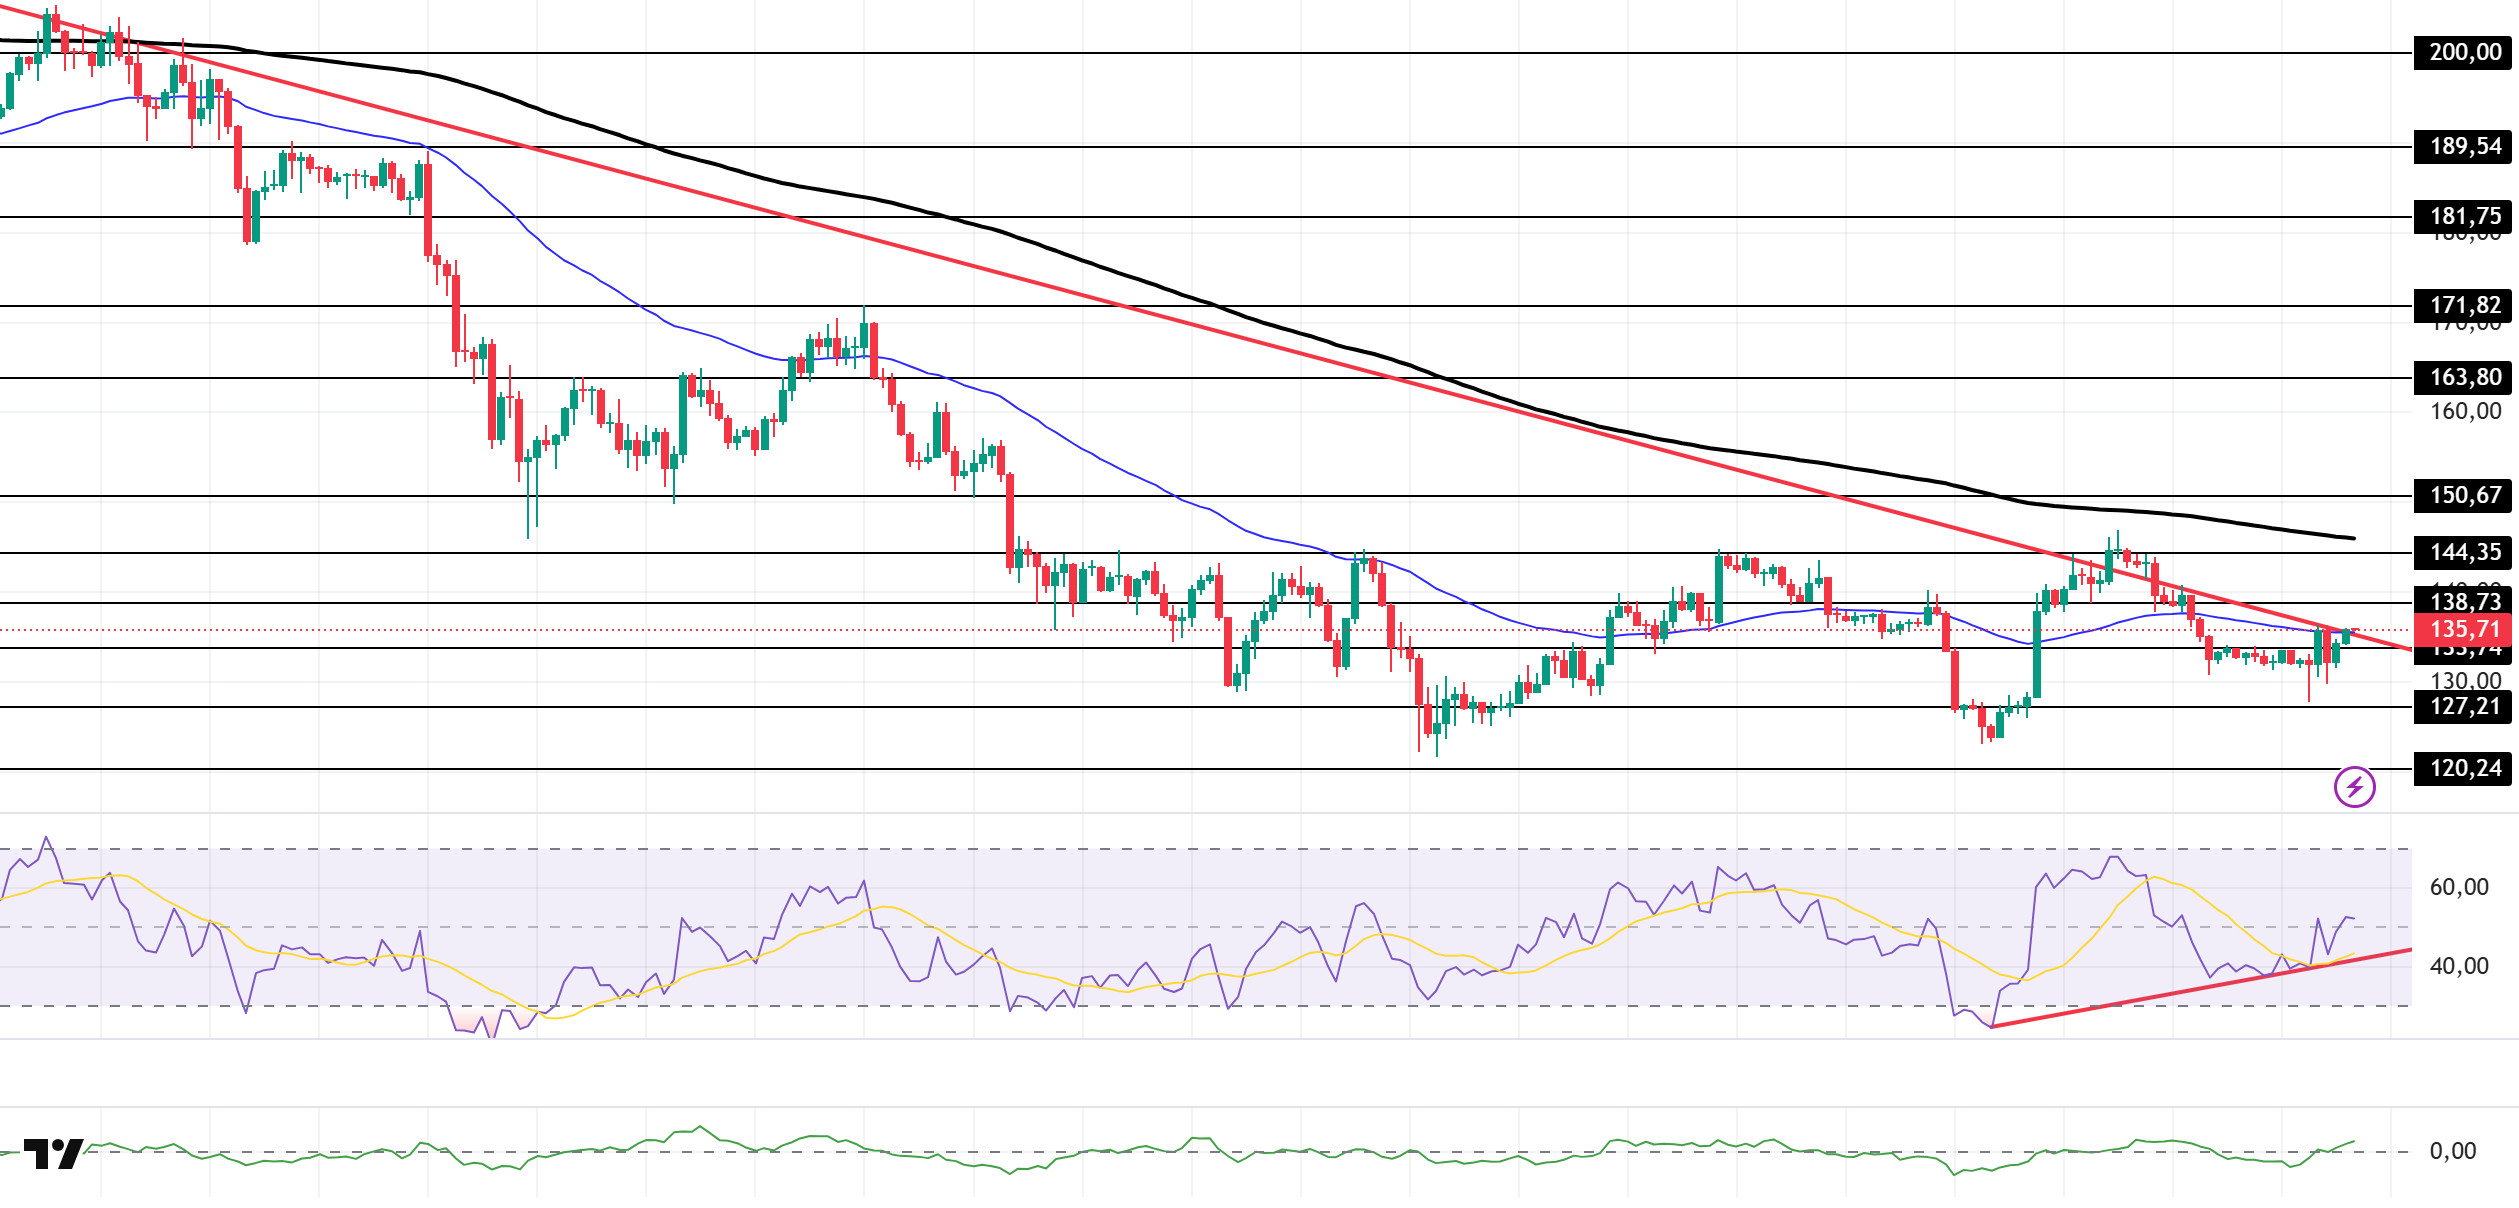
The SOL price continued to move sideways. The asset moved into the lower region of the downward trend that began on October 6. The price, which broke above the downward trend line, a strong resistance level, encountered resistance at the 200 EMA (Black Line) moving average and retreated after failing to break through. After finding support at the $127.21 level, the price is currently testing the 50 EMA (Blue Line) moving average and the downward trend line as resistance. If it experiences another decline, it may test the $127.21 level. The 200 EMA (Black Line) moving average should be monitored for candle closes above the rising trend line and the 50 EMA moving average.
On the 4-hour chart, it continued to remain below the 50 EMA (Exponential Moving Average – Blue Line) and 200 EMA (Black Line). This indicates that it may be in a downtrend in the medium term. At the same time, the price being below both moving averages indicates that the asset’s downward trend continues in the short term. The Chaikin Money Flow (CMF-20) remained positive. However, balanced cash inflows and outflows may keep the CMF in positive territory. The Relative Strength Index (RSI-14) rose from the middle of the negative zone to neutral territory. At the same time, it continued to hold above the upper region of the upward trend that began on December 1. This may indicate that buying pressure continues. If there is an uptrend due to macroeconomic data or positive news related to the Solana ecosystem, the $163.80 level stands out as a strong resistance point. If this level is broken upwards, the uptrend is expected to continue. In the event of pullbacks due to developments in the opposite direction or profit-taking, the $120.24 level could be tested. A decline to these support levels could increase buying momentum, presenting a potential upside opportunity.
Supports: 133.74 – 127.21 – 120.24
Resistances: 138.73 – 144.35 – 150.67
DOGE/USDT
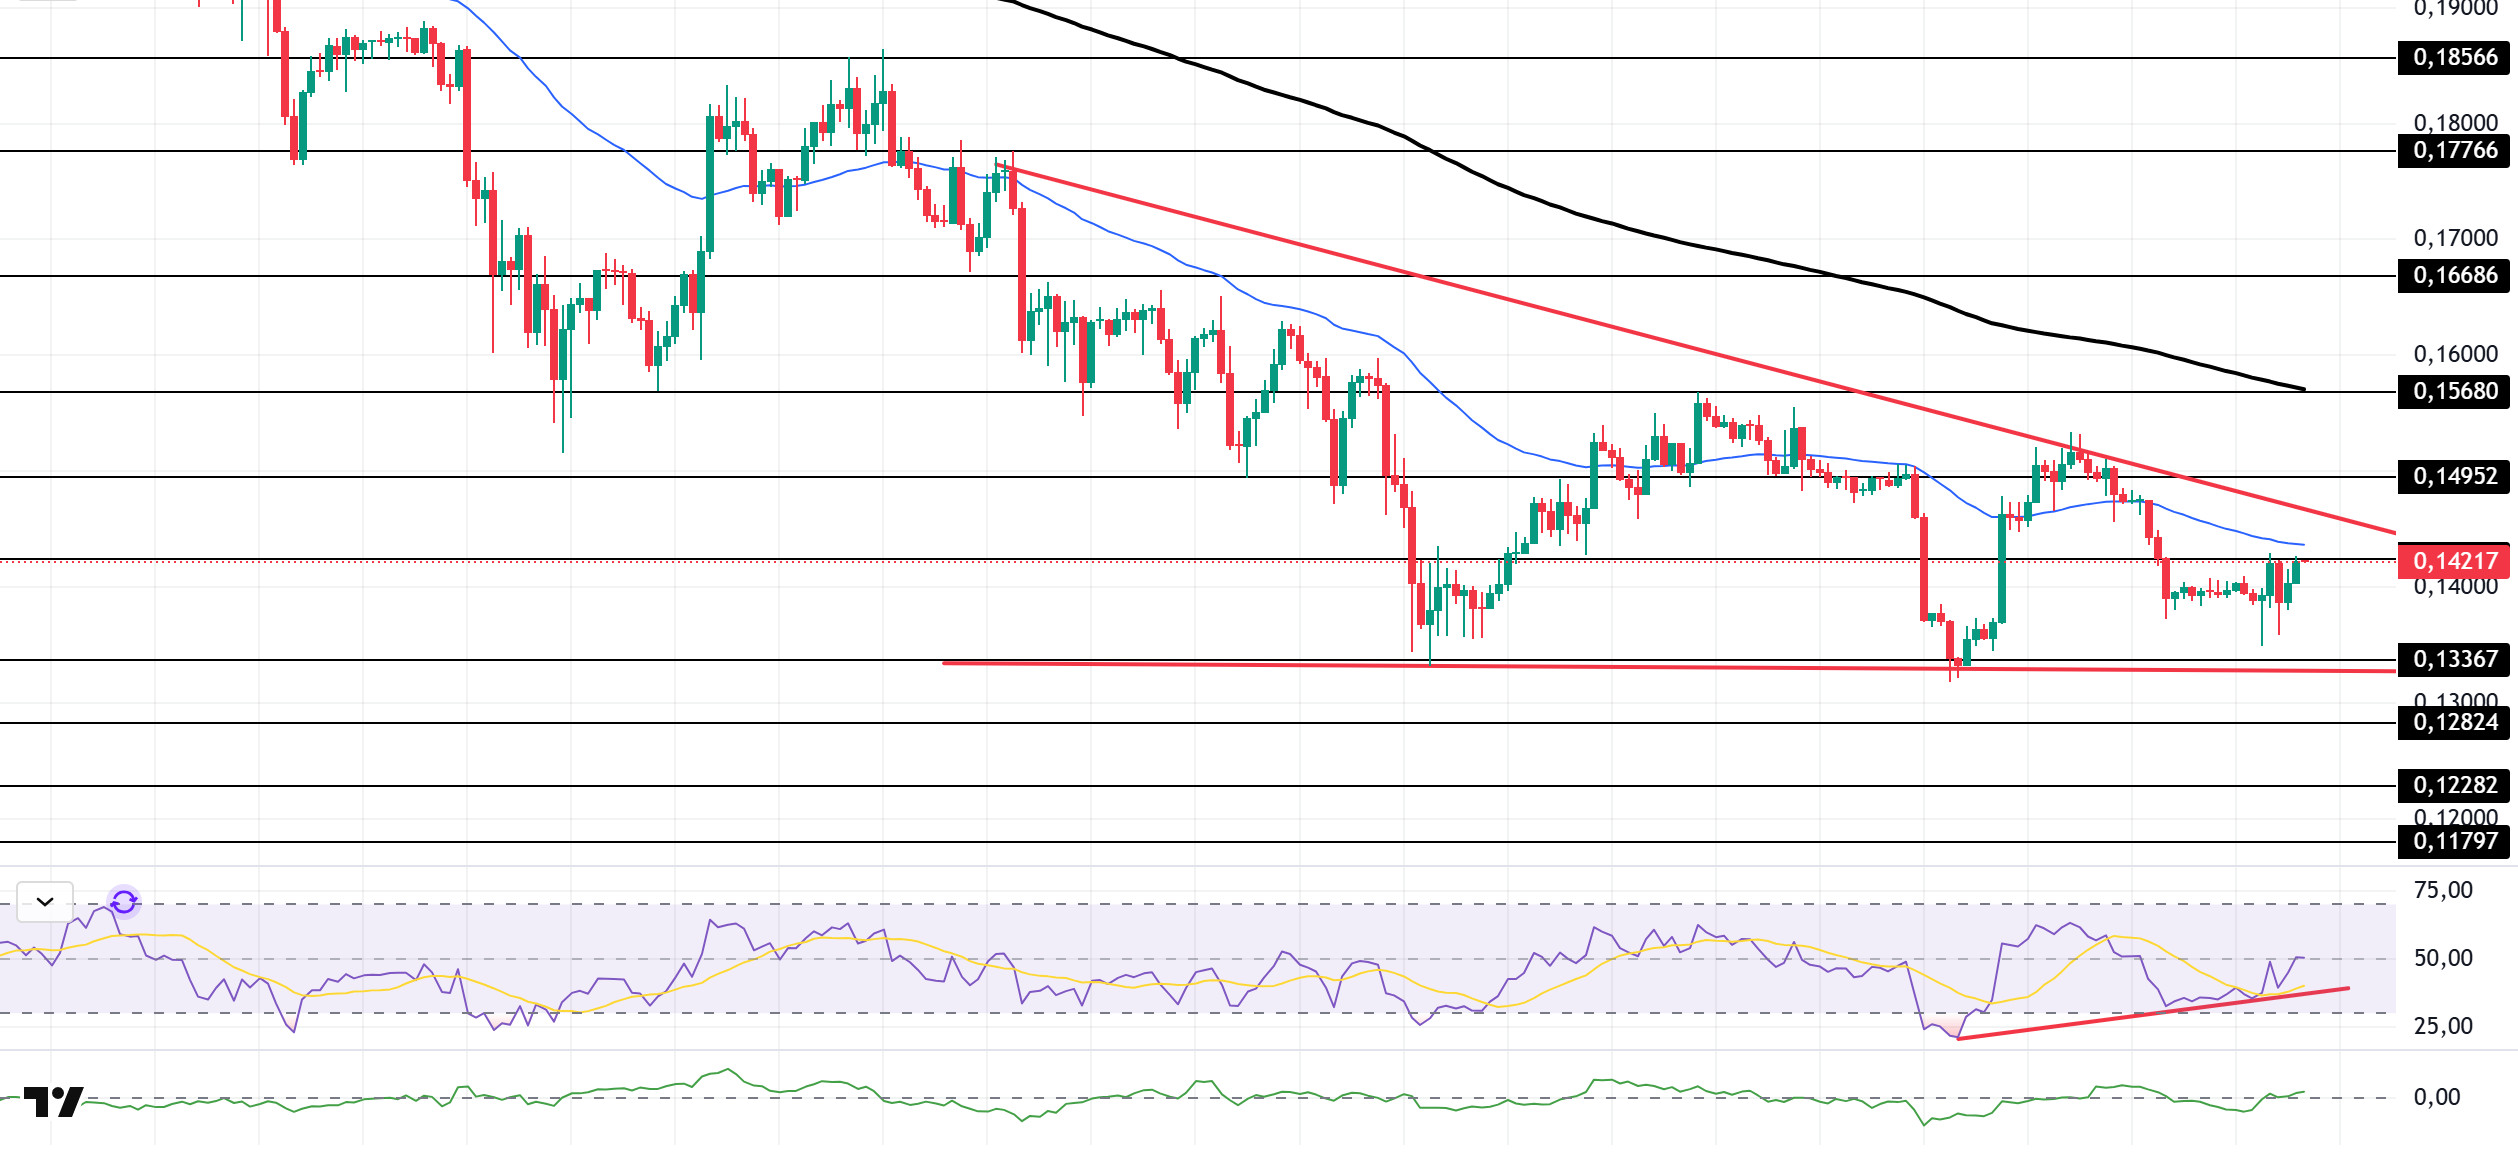
The DOGE price continued to move sideways. The asset lost value after encountering direct resistance from the decline that began on November 13 and broke below the 50 EMA (Blue Line) moving average. Furthermore, the price, which continues to remain within the descending triangle formation, is currently testing the 50 EMA (Blue Line) moving average as resistance. In the event of a pullback, it may test the $0.13367 level and the base level of the descending triangle formation. If an uptrend begins, the ceiling level of the descending triangle formation should be monitored.
On the 4-hour chart, the 50 EMA (Exponential Moving Average – Blue Line) remained below the 200 EMA (Black Line). This indicates that the downtrend may continue in the medium term. The price being below both moving averages shows that the downward trend is continuing in the short term. The Chaikin Money Flow (CMF-20) is at a neutral level. Additionally, the balance of money inflows and outflows may keep the CMF at a neutral level. The Relative Strength Index (RSI-14) accelerated from the middle of the negative zone to the neutral level. At the same time, it remained above the rising line that began on December 1. This indicated that buying pressure could form. In the event of an uptrend driven by political developments, macroeconomic data, or positive news flow in the DOGE ecosystem, the $0.15680 level stands out as a strong resistance zone. Conversely, in the event of negative news flow, the $0.13367 level could be triggered. A decline to these levels could increase momentum and initiate a new wave of growth.
Supports: 0.13367 – 0.12824 – 0.12282
Resistances: 0.14237 – 0.14952 – 0.15680
AVAX/USDT
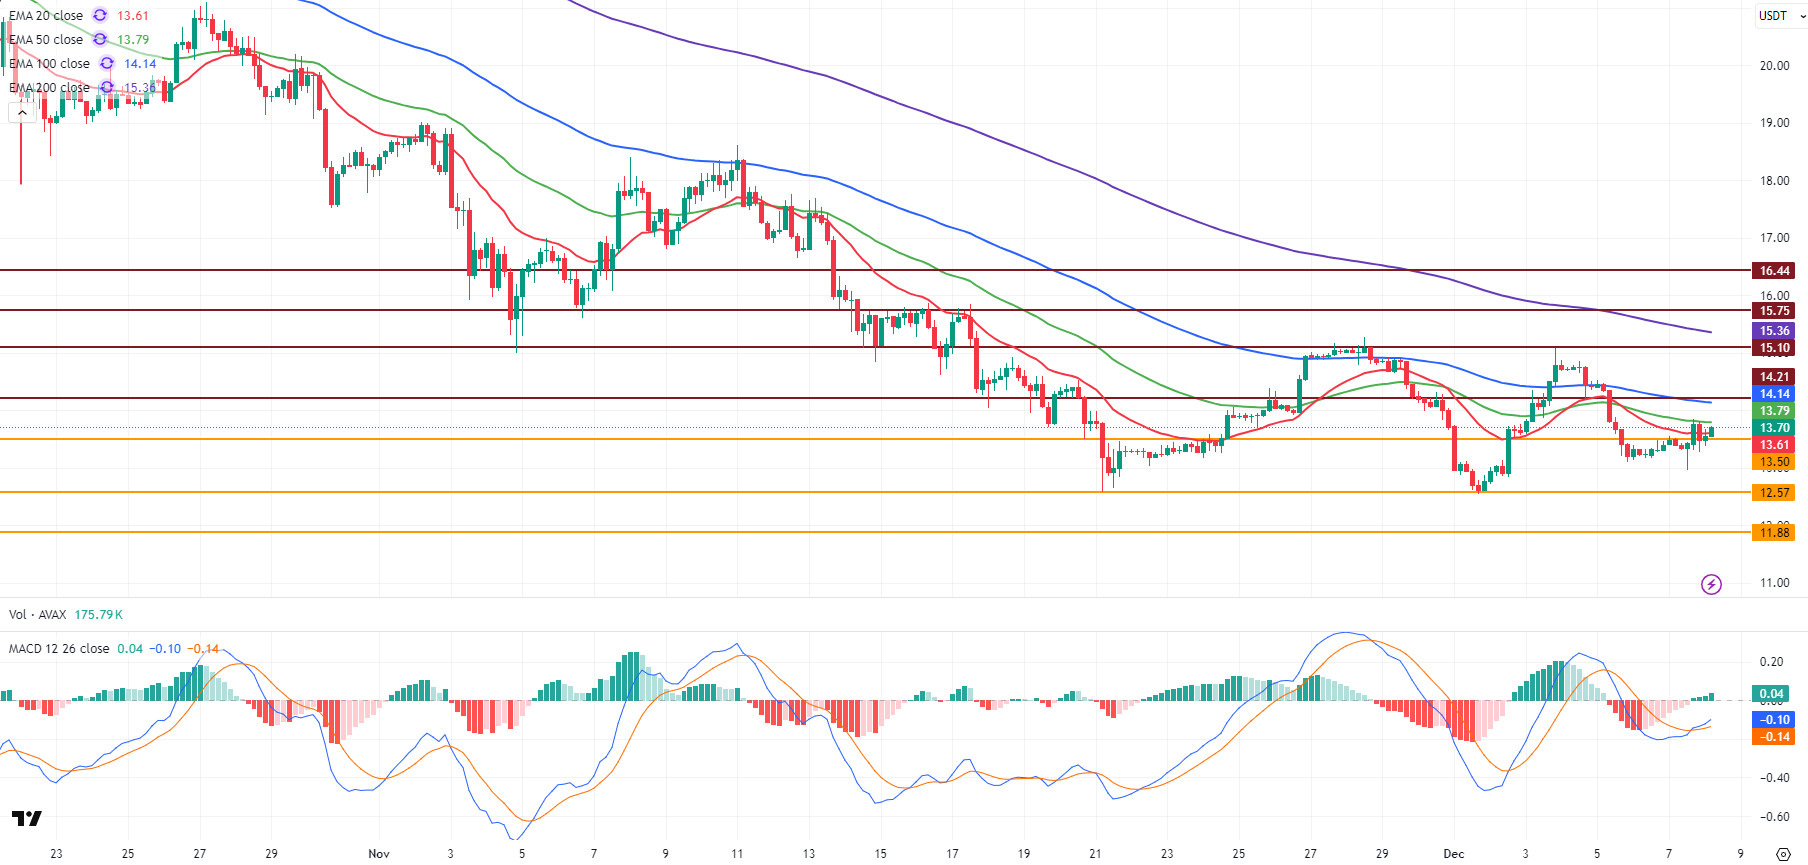
AVAX fell below the $13.50 support level due to selling pressure in the latter part of last week, closing the week at $13.21. This decline was particularly marked by the MACD line crossing below the signal line and entering negative territory, indicating weakening momentum and increasing selling pressure. AVAX traded in a horizontal band over the weekend, signaling a short-term recovery, and rose to $13.85 before closing. However, it fell back again due to selling pressure from the 50-period Exponential Moving Average (EMA50) level, closing yesterday at $13.49. Starting the new day with an uptrend, AVAX first broke through the $13.50 resistance level and then the EMA20 level, strengthening its short-term positive outlook. Currently trading at $13.70, AVAX continues to trade with an approximate 1.6% increase in value compared to the opening. The general recovery seen in the cryptocurrency market also had an impact on AVAX.
On the 4-hour chart, with today’s rise in AVAX, the Moving Average Convergence/Divergence (MACD) line crossed the signal line upwards and is trending upwards. Although the MACD being in the negative zone indicates that momentum has not fully strengthened, its proximity to the positive zone increases the possibility of a trend reversal in the short term. On the EMA side, AVAX broke through the EMA20 level today, confirming the short-term recovery. Yesterday, the EMA50 was tested before closing but could not be broken. If the upward trend continues today, AVAX may retest the EMA50 level, and if this level is broken, the upward momentum could gain traction.
In the technical outlook, the $14.21 and EMA100 levels remain the first key resistance zone following the EMA50. If this zone is breached, AVAX could regain strength and continue its upward movement toward the EMA100 level. In an upward scenario, AVAX needs to break through the EMA100 and then the $15.10 resistance level to clearly strengthen its trend. If it closes above $15.10, a stronger upward movement towards the $15.75 and $16.44 levels could technically occur. However, for this scenario to gain strength, it is critical that volume increases and the MACD moves into positive territory while maintaining its upward trend. In a downward scenario, the $13.50 level stands out as the first important support. If there is a close below this level, selling pressure may increase again, and AVAX may fall towards the $12.57, then $11.88 support levels . Overall, the upward crossover of the MACD and AVAX’s success in staying above the EMA20 support the short-term bullish scenario. However, the upward momentum is not fully established yet. The upward momentum could gain full strength with the MACD line rising into positive territory and the critical EMA levels breaking upward.
(EMA20: Red Line, EMA50: Green Line, EMA100: Blue Line, EMA200: Purple Line)
Supports: 13.50 – 12.57 – 11.88
Resistances: 14.21 – 15.10 – 15.75
LINK/USDT
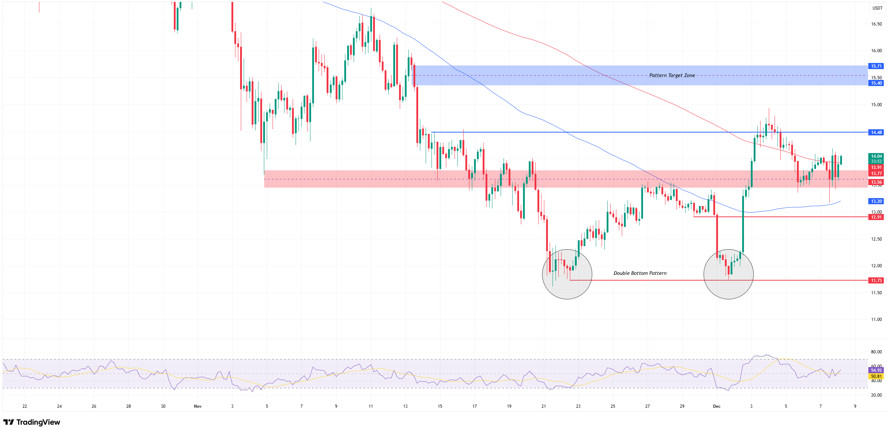
In our analysis prepared last Friday, we highlighted the double bottom structure formed by the price in the 11.70 region and emphasized that this level is a critical reversal area in terms of the trend. The fact that the price reacted again in this region confirms the structural validity of our previous analysis. The 13.56 – 13.77 range, which acts as the neckline of the formation, continues to be the center point of the reversal.
The price, unable to break through the 14.48 level, the first barrier to upward movement, has been in a horizontal squeeze for some time. Since the rejections in this resistance zone are not aggressive, buyers are still maintaining their presence in the support zone we mentioned, staying in the game and preserving structural positivity. If there are closes above 14.48, the 15.40 – 15.71 band, which we mentioned in the previous report as the formation target zone, will come back into focus. As this area is both a supply zone and a technical target, it could determine the price’s character and bring profit-taking with it.
In the downside risk scenario, the 13.56–13.77 support remains our reference point. Losing this zone could weaken short-term momentum and push the price towards the 12.91 level. However, for the main structure to break down, we need to see a move below 11.70. Breaking below this level would invalidate the formation and could pull the trend back to the negative side.
Although we see a short-term weakening in the Relative Strength Index (RSI), the current consolidation and positive technical structure make the possibility of an upward breakout much stronger. Closings above 14.48 could allow the trend to regain strength and initiate new momentum towards our target zone.
Supports: 13.56 – 12.91 – 11.73
Resistances: 14.48 – 15.40 – 15.71
Legal Notice
The investment information, comments, and recommendations contained herein do not constitute investment advice. Investment advisory services are provided individually by authorized institutions taking into account the risk and return preferences of individuals. The comments and recommendations contained herein are of a general nature. These recommendations may not be suitable for your financial situation and risk and return preferences. Therefore, making an investment decision based solely on the information contained herein may not produce results in line with your expectations.

