
Technical Analysis
BTC/USDT
In the US Senate, 12 Democratic senators announced a comprehensive regulatory framework for the crypto market, including a ban on crypto profits for government officials and their families while in office. SEC Commissioner Hester Peirce stated that Layer 2 chains with centralized matching engines may need to obtain an exchange license, while fully decentralized protocols will not be subject to regulation. Patrick Witt, the Trump administration’s new crypto advisor, listed three priorities in a statement: The market structure bill in the Senate, the rapid implementation of the GENIUS stablecoin law, and the establishment of a federal crypto reserve. Japan-listed Convano is planning a $139.2 million bond issue to increase its Bitcoin reserves. Kyrgyzstan’s Finance Minister is preparing to submit a draft law to the government to establish a strategic Bitcoin reserve.
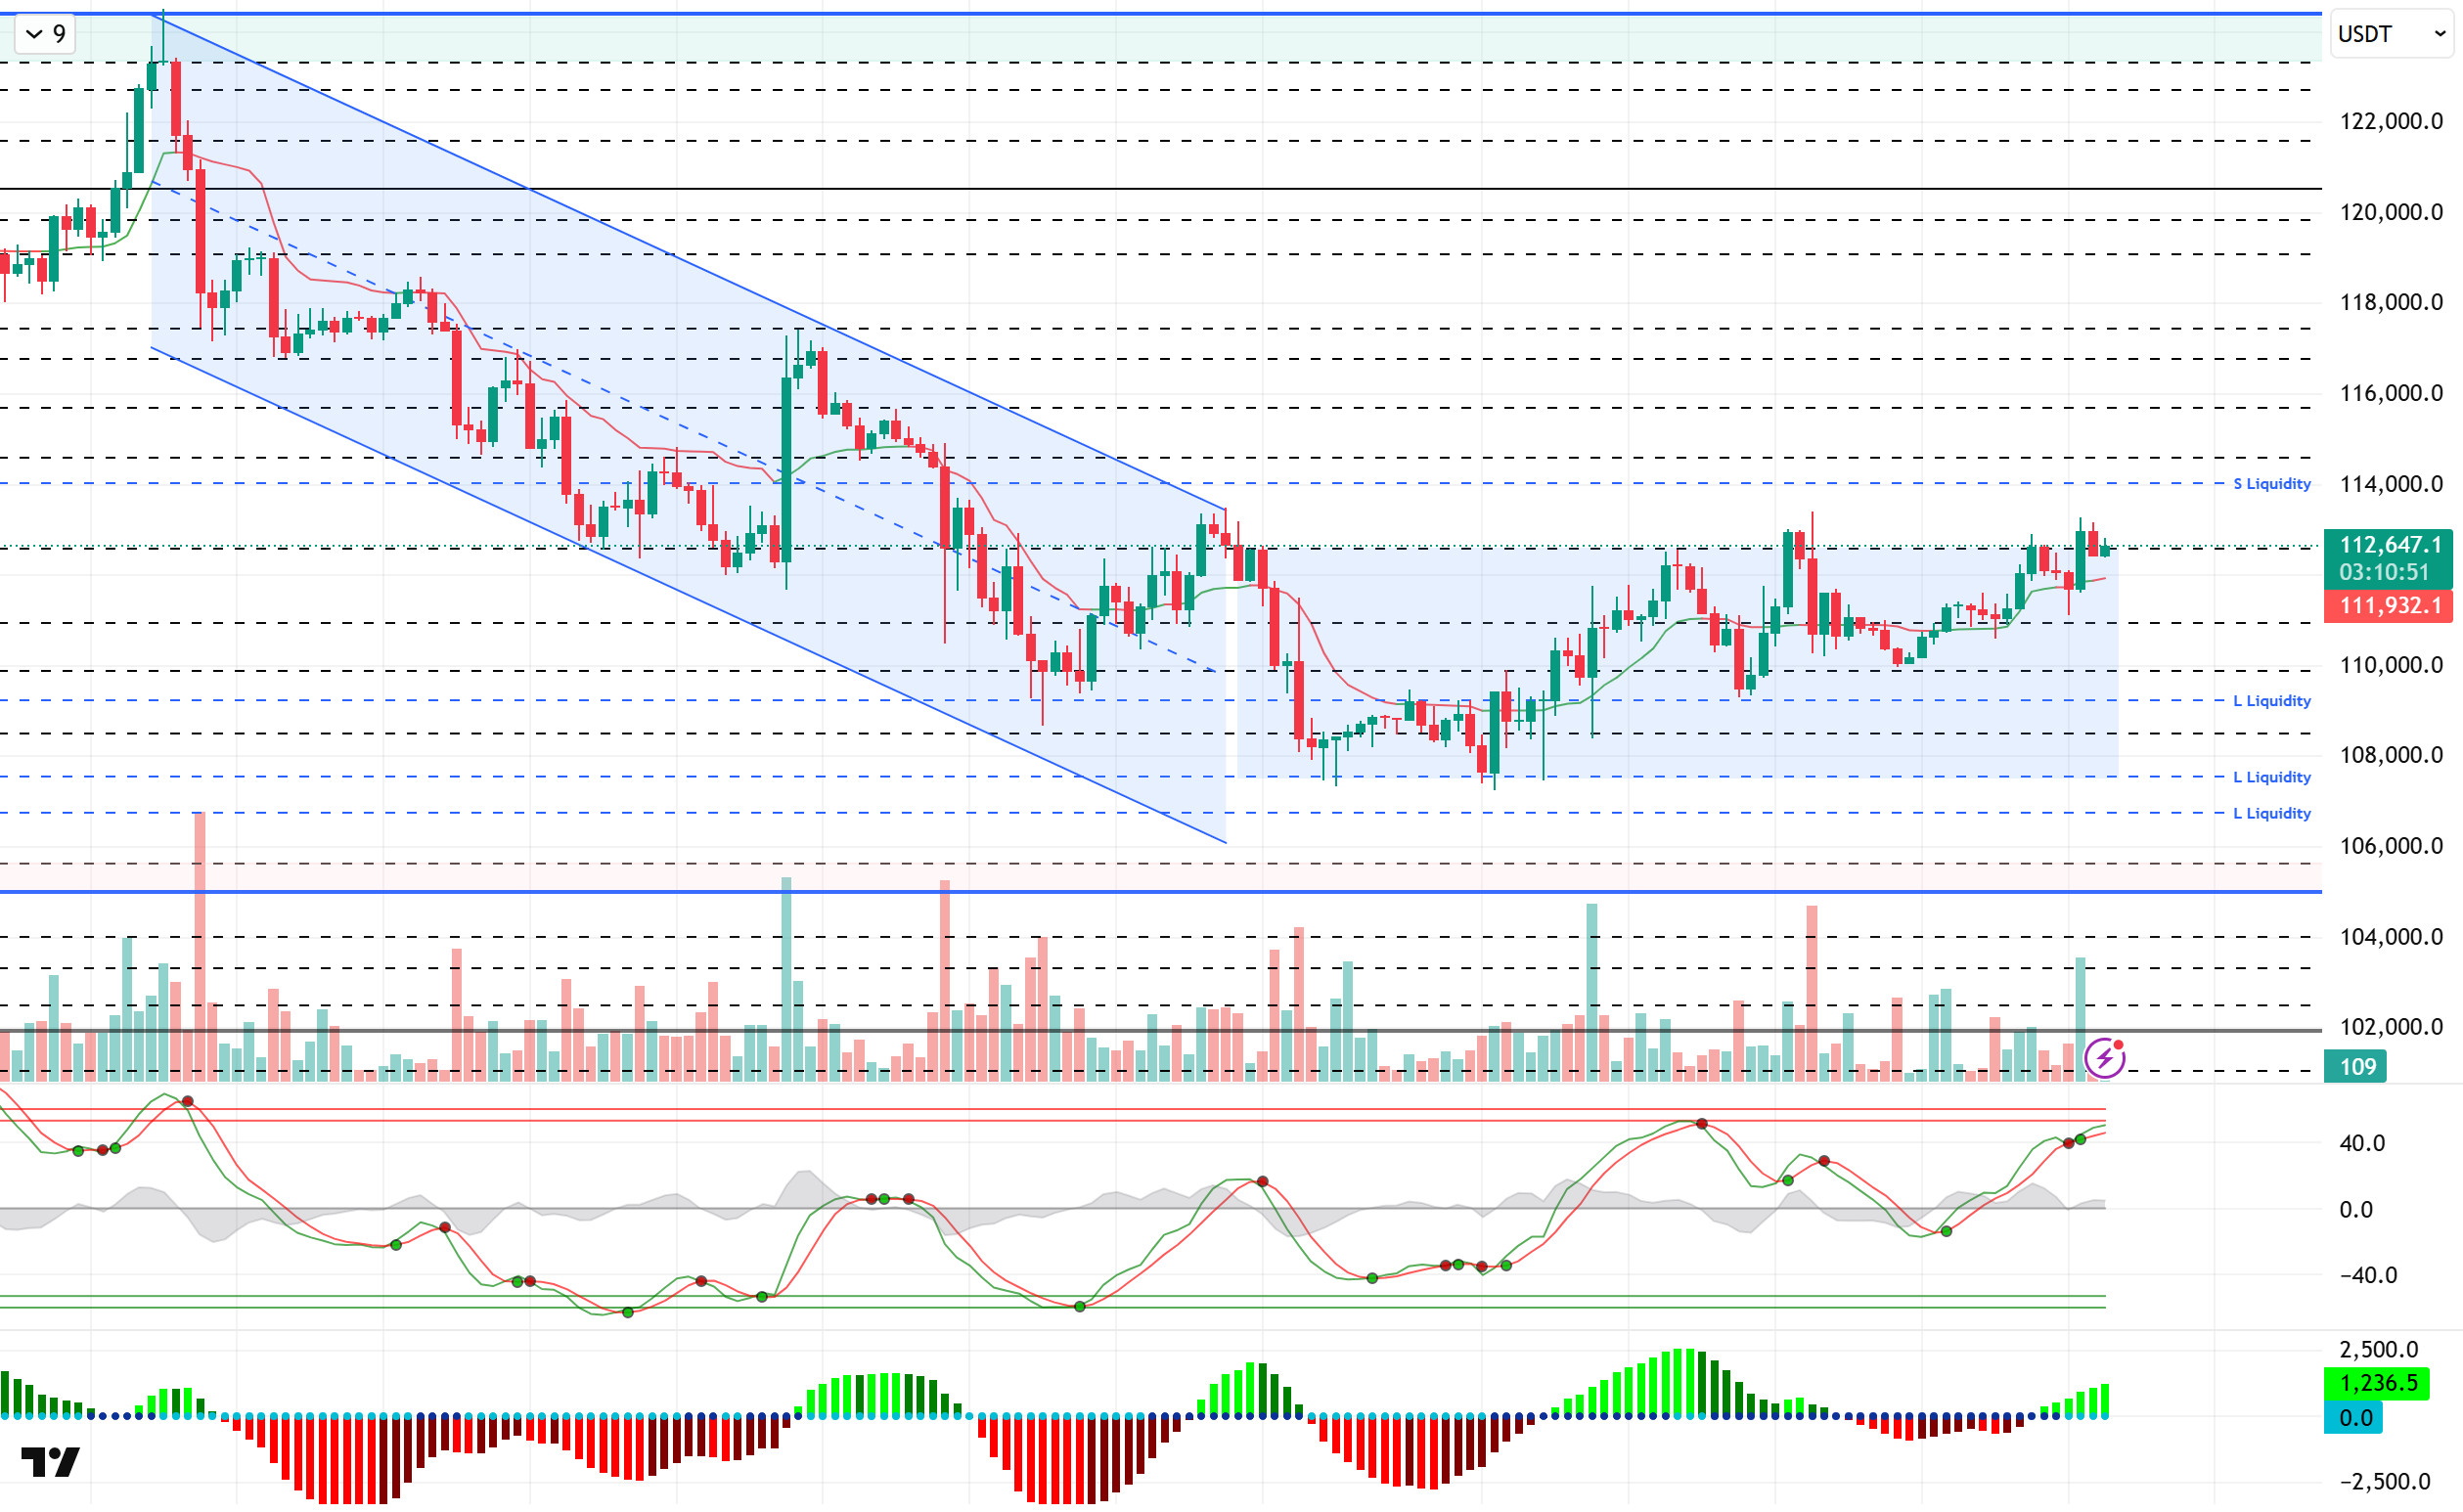
When we look at the technical outlook, BTC pricing continues within the horizontal band range. In the previous analysis, the price, which pushed the 113,300 level with the minor bullish movement, fell to 112,400, but at the time of writing the analysis, it continues to trade at 112,670.
Technical indicators, the Wave Trend oscillator (WT) is unstable with trading signals in the Overbough area, while the histogram of the Squeeze Momentum (SM) indicator is trying to regain momentum in the positive area. The Kaufman moving average is currently moving below the price at 111.900.
Looking at the liquidity data, short-term accumulating sell trades were liquidated at 113.200, while the wider timeframe sell accumulation intensified above 114.000, becoming a target zone. While the buying tier started to accumulate at 110,000 – 110,900 levels in the short term, the 109,000 band became a more intense accumulation zone in the long term.
In summary, the loss of the optimistic mood in recent days with fundamental developments, the interest rate cut discussions among Fed members, tariffs remaining on the agenda with the new distribution of duties and political tensions stand out as factors that put pressure on the price. In technical terms, the formation of a favorable ground for a new upward movement created some recovery. While it was noteworthy that the rises remained in the form of liquidity purchases, it was noteworthy that the price movements turned from a falling trend movement into a horizontal trend channel. The reappearance of catalysts in the market for a new long-lasting uptrend may be possible by creating a driving force on the price. In this context, 112,600 stands out as a critical reference area in the continuation of the upward movement. Exceeding this level may cause the price to gain momentum and bring a movement towards the 114,000 liquidity level. In a possible selling pressure, the 108,500 level may meet us in case of a 110,000 break.
Supports 108,500 – 107,400 – 105,000
Resistances 112,600 – 114,000 – 115,000
ETH/USDT
Nasdaq-traded Ethereum treasury Sharp Link announced the launch of a $1.5 billion share buyback program. Under the program, approximately 1 million SBET shares were repurchased in the first phase. The company stated that its shares are undervalued, and the buybacks aim to increase long-term investor value.
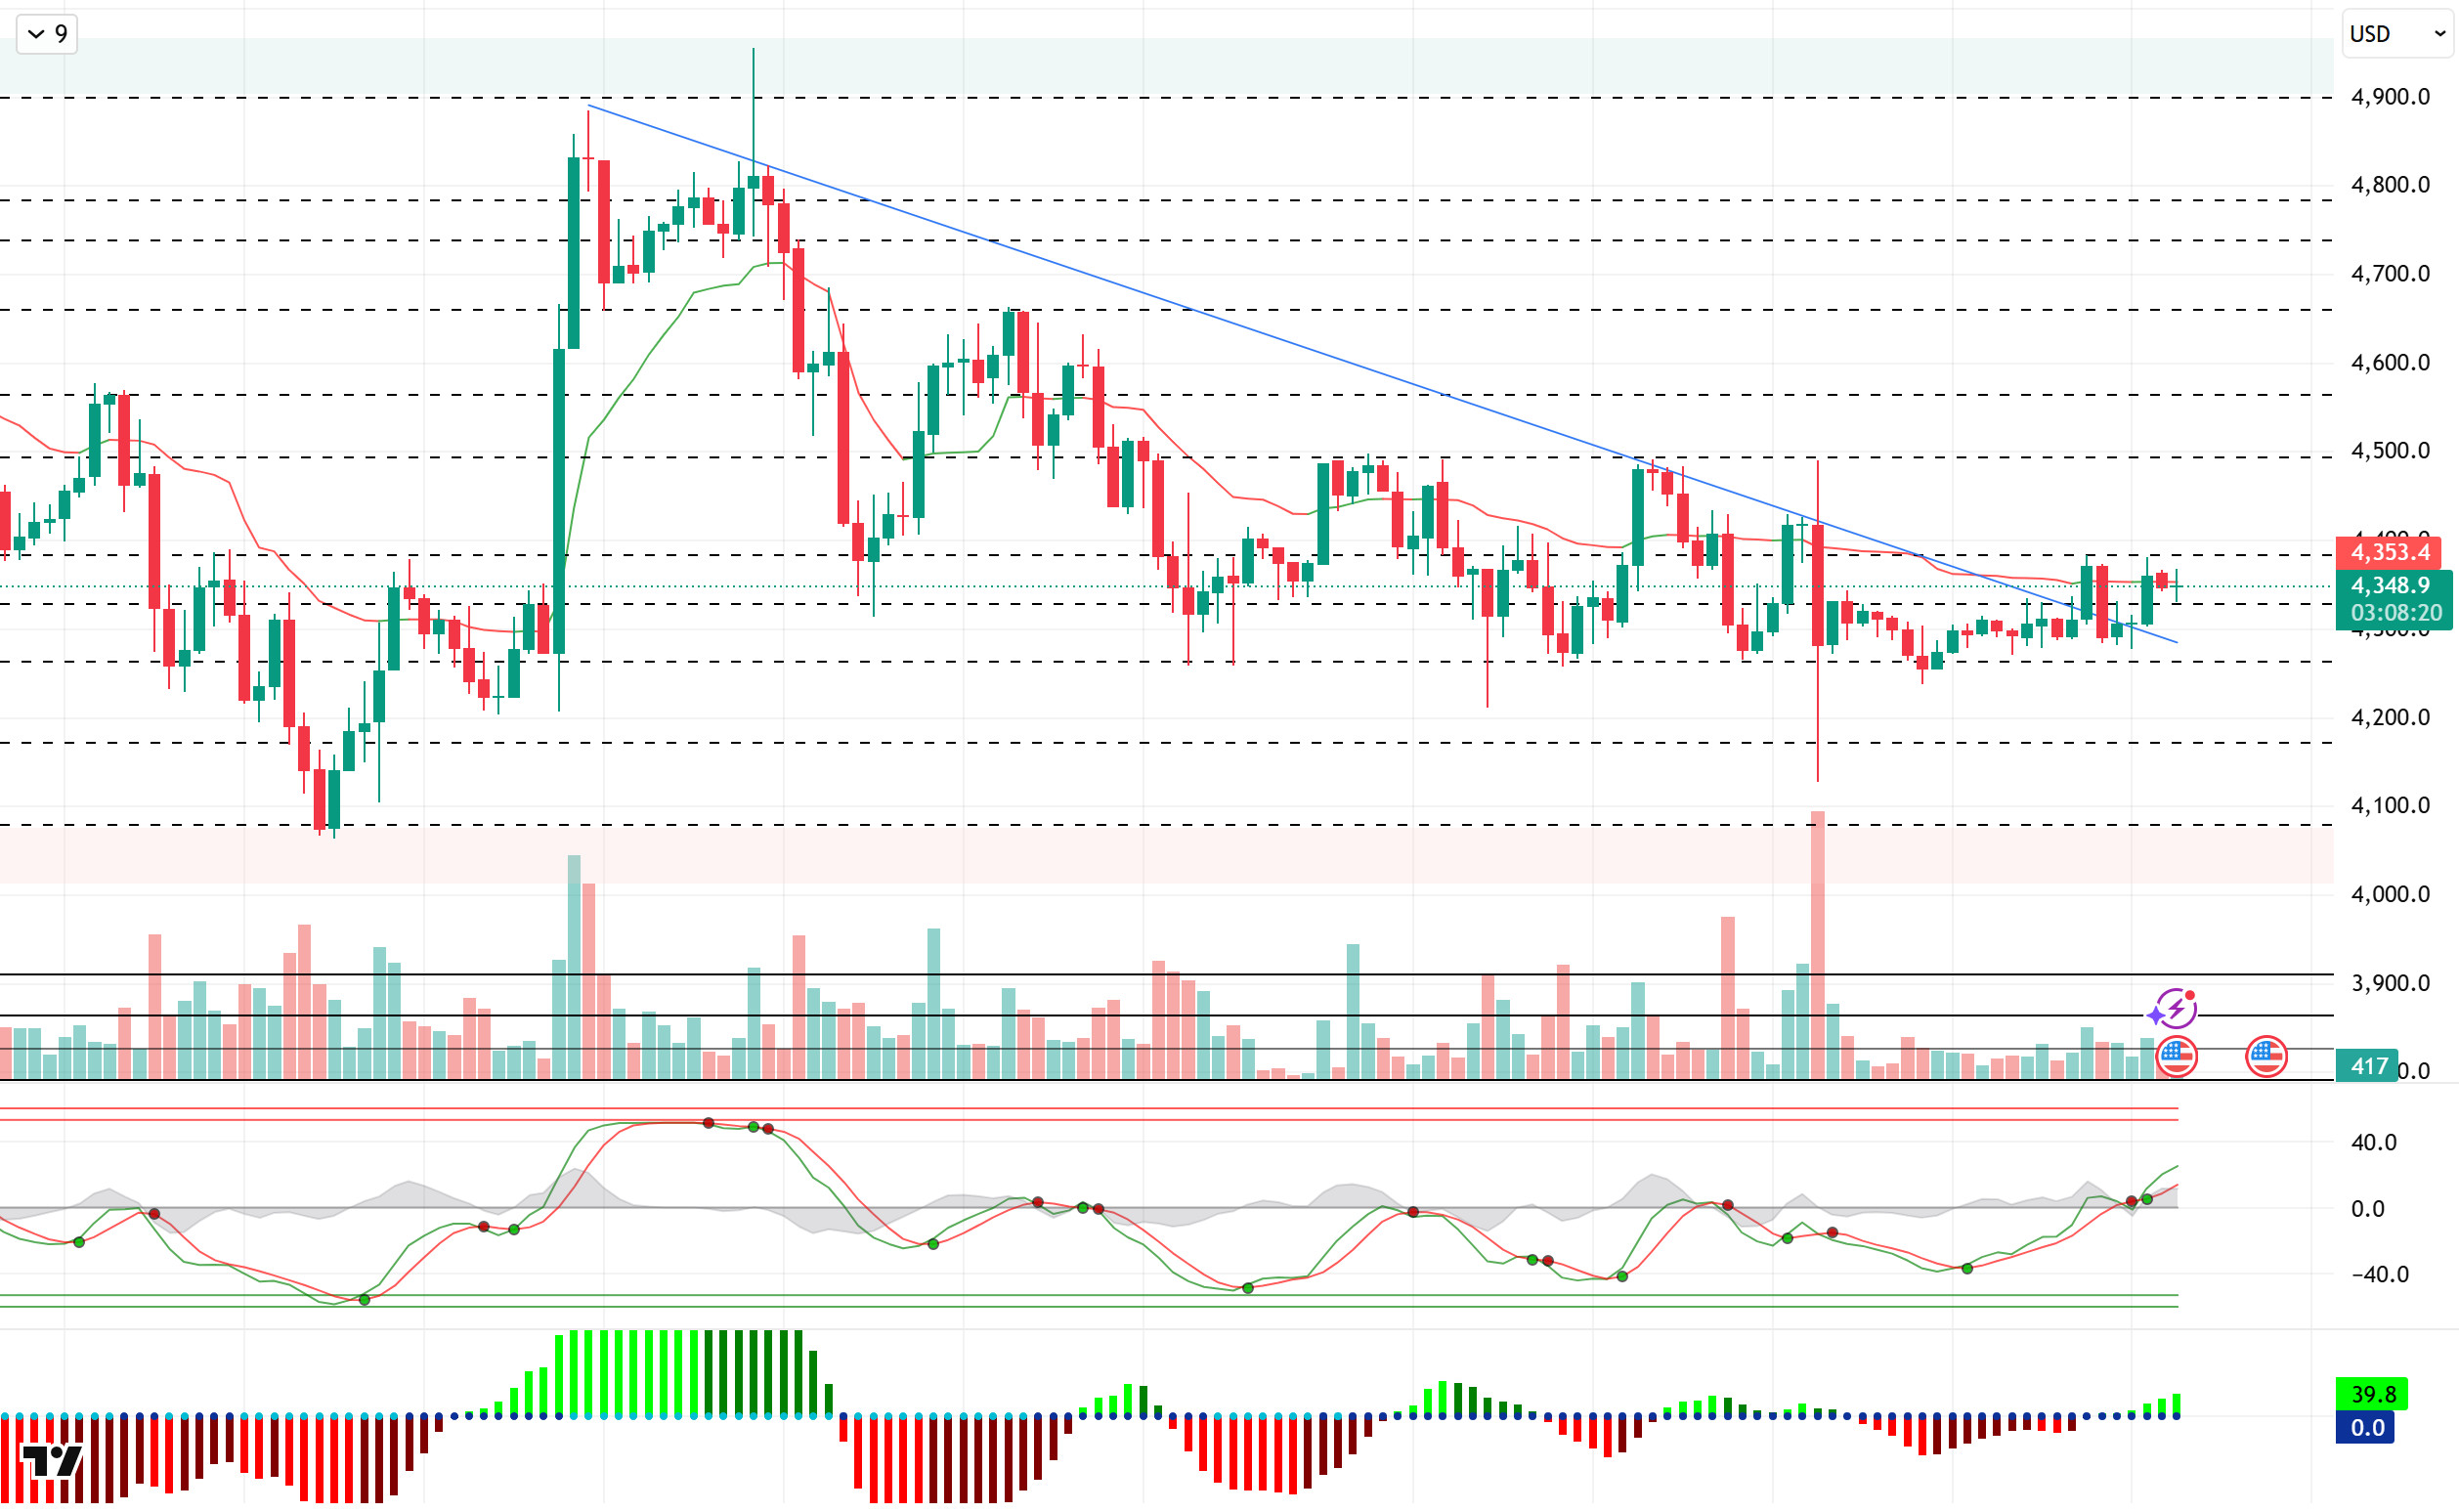
When we look at the technical outlook, the price, which exceeded the falling trend line in the previous analysis, tested 4,375 levels. Then, the price, which faced selling pressure, fell to 4,350 levels. At the time of writing, ETH continues to trade at 4,351.
Technical indicators, the Wave Trend oscillator (WT) is once again turning upwards with a buy signal at the channel mid-band, while the Squeeze Momentum (SM) indicator is trying to regain momentum in the histogram positive area. The Kaufman moving average is currently moving above the price at 4,353.
Looking at the liquidity data, the short-term sell accumulation was liquidated at 4.355, while the sell step was sparse. The buying bias continues to intensify at 4,200 and above in the short and extended timeframe.
To summarize, ETH continues to move in line with the general developments in the market. When we look at the fundamental dynamics specific to ETH, it is seen that institutional interest continues while ETF inflows are weakening. On the technical side, while the price continues to struggle to recover, liquidity data continues to set the limits of price movements. In this context, closes above the falling trend line at 4,330 stand out as a critical threshold. The momentum that may occur above this level may move the price to the 4,490 resistance zone. On the other hand, 4,260 support and liquidity area will be followed in possible pullbacks. If this support is broken, the downtrend structure may deepen further.
Supports 4,330 – 4,260 – 4,170
Resistances 4,385 – 4,490 – 4,560
XRP/USDT
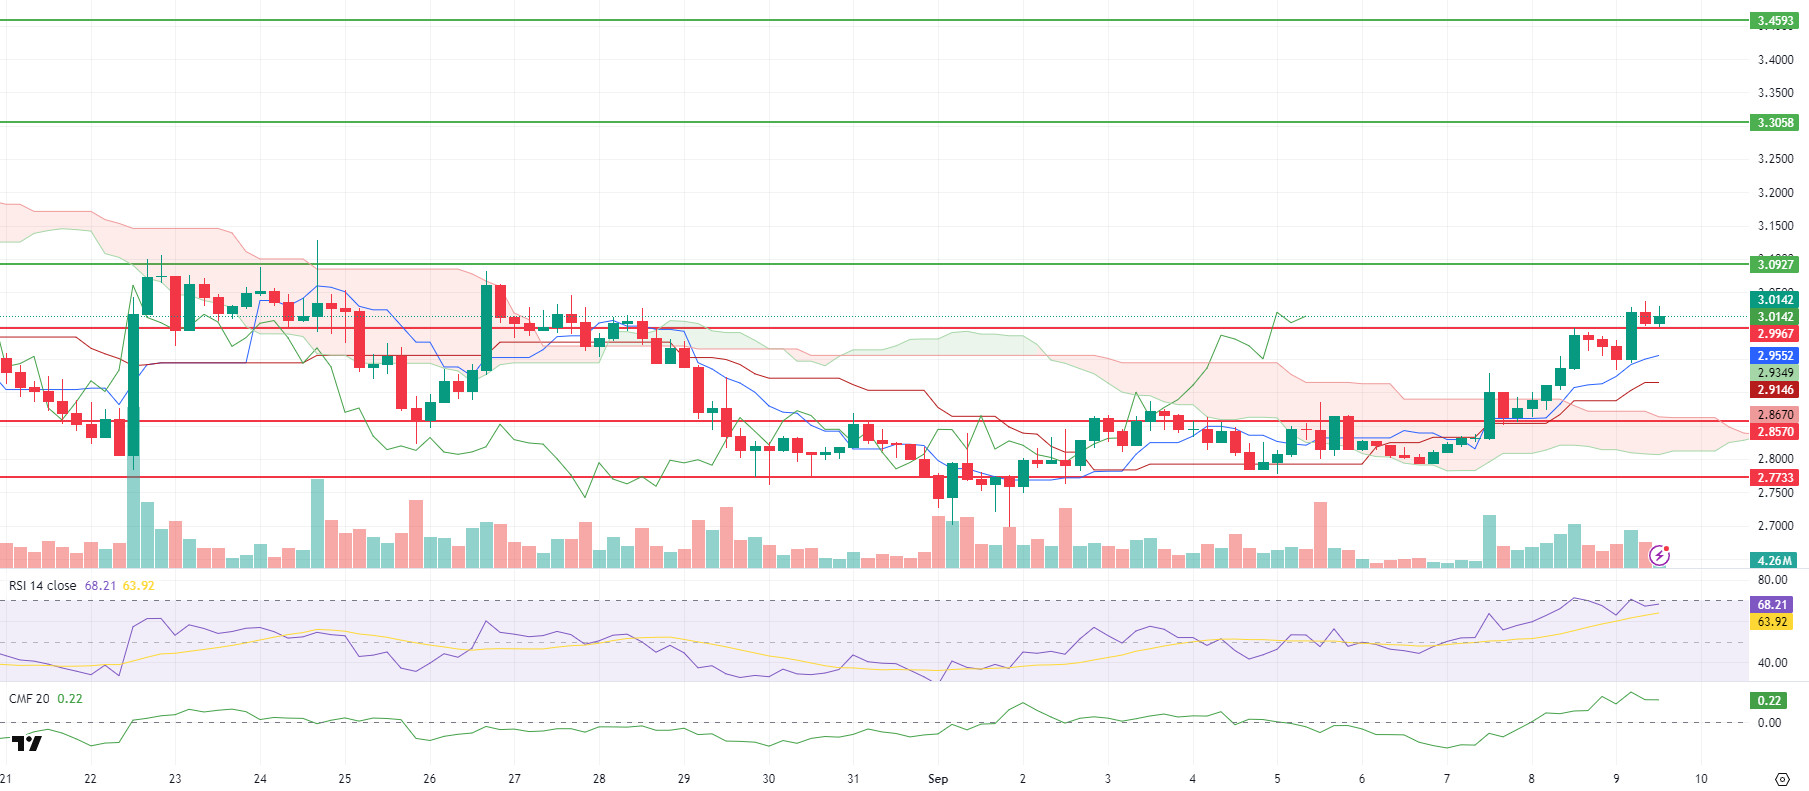
XRP, which rose as high as $3.036 today, retreated to $3.00 with selling pressure in this region. However, the fact that the last three candle closes on the 4-hour chart have been above $ 3.00 shows that the critical level is still working as strong support. Especially with the exceeding of the $ 2,996 level, the fact that the price continues to hold above this level contributes to maintaining the upward trend. According to Ichimoku, Tenkan ($2,955) and XRP price are positioned above the cloud and the forward cloud continues its upward slope. This technical structure indicates that the rise may continue if the permanence above the $ 3.00 level is maintained. On the ecosystem side, today’s news flow created additional support for XRP. Ripple’s new custody services partnership with BBVA has increased the expectation of expansion in the user base in Spain. This development stands out as a positive factor that strengthens XRP’s adoption on the institutional side.
The Relative Strength Index (RSI) is at 68 and above its base average. However, approaching the 70 threshold may increase the risk of profit realization in the short term. Chaikin Money Flow (CMF) has turned strongly positive at +0.22, indicating that liquidity inflows on the spot side have recovered significantly and the ground for resistance breakouts to be permanent has strengthened. Maintaining CMF in the positive zone is critical for the sustainability of the course above $3.00.
In the short term, the continuation of 4-hour closures above $ 2.9967 supports the upward momentum towards the resistance level of $ 3.0927. If this level is exceeded with volume, $ 3.3058 and then $ 3.4593 may come to the agenda. On the other hand, if the price falls below $3.00 and fails to maintain above $2.9967, the risk of a technical correction towards Tenkan ($2.955) and then Kijun ($2.9146) increases. Below this band, the supports of $ 2.8570 and $ 2.7733 stand out. In the overall outlook, the combination of above-cloud pricing, Tenkan above Kijun, strong RSI and positive CMF confirms the short-term uptrend. The $3.00 level remains a critical threshold. As long as it remains above this level, the positive momentum in XRP can be maintained and the bullish potential can remain alive.
Supports 2.9967 – 2.8570 – 2.7733
Resistances: 3.0927 – 3.3058 – 3.4593
SOL/USDT
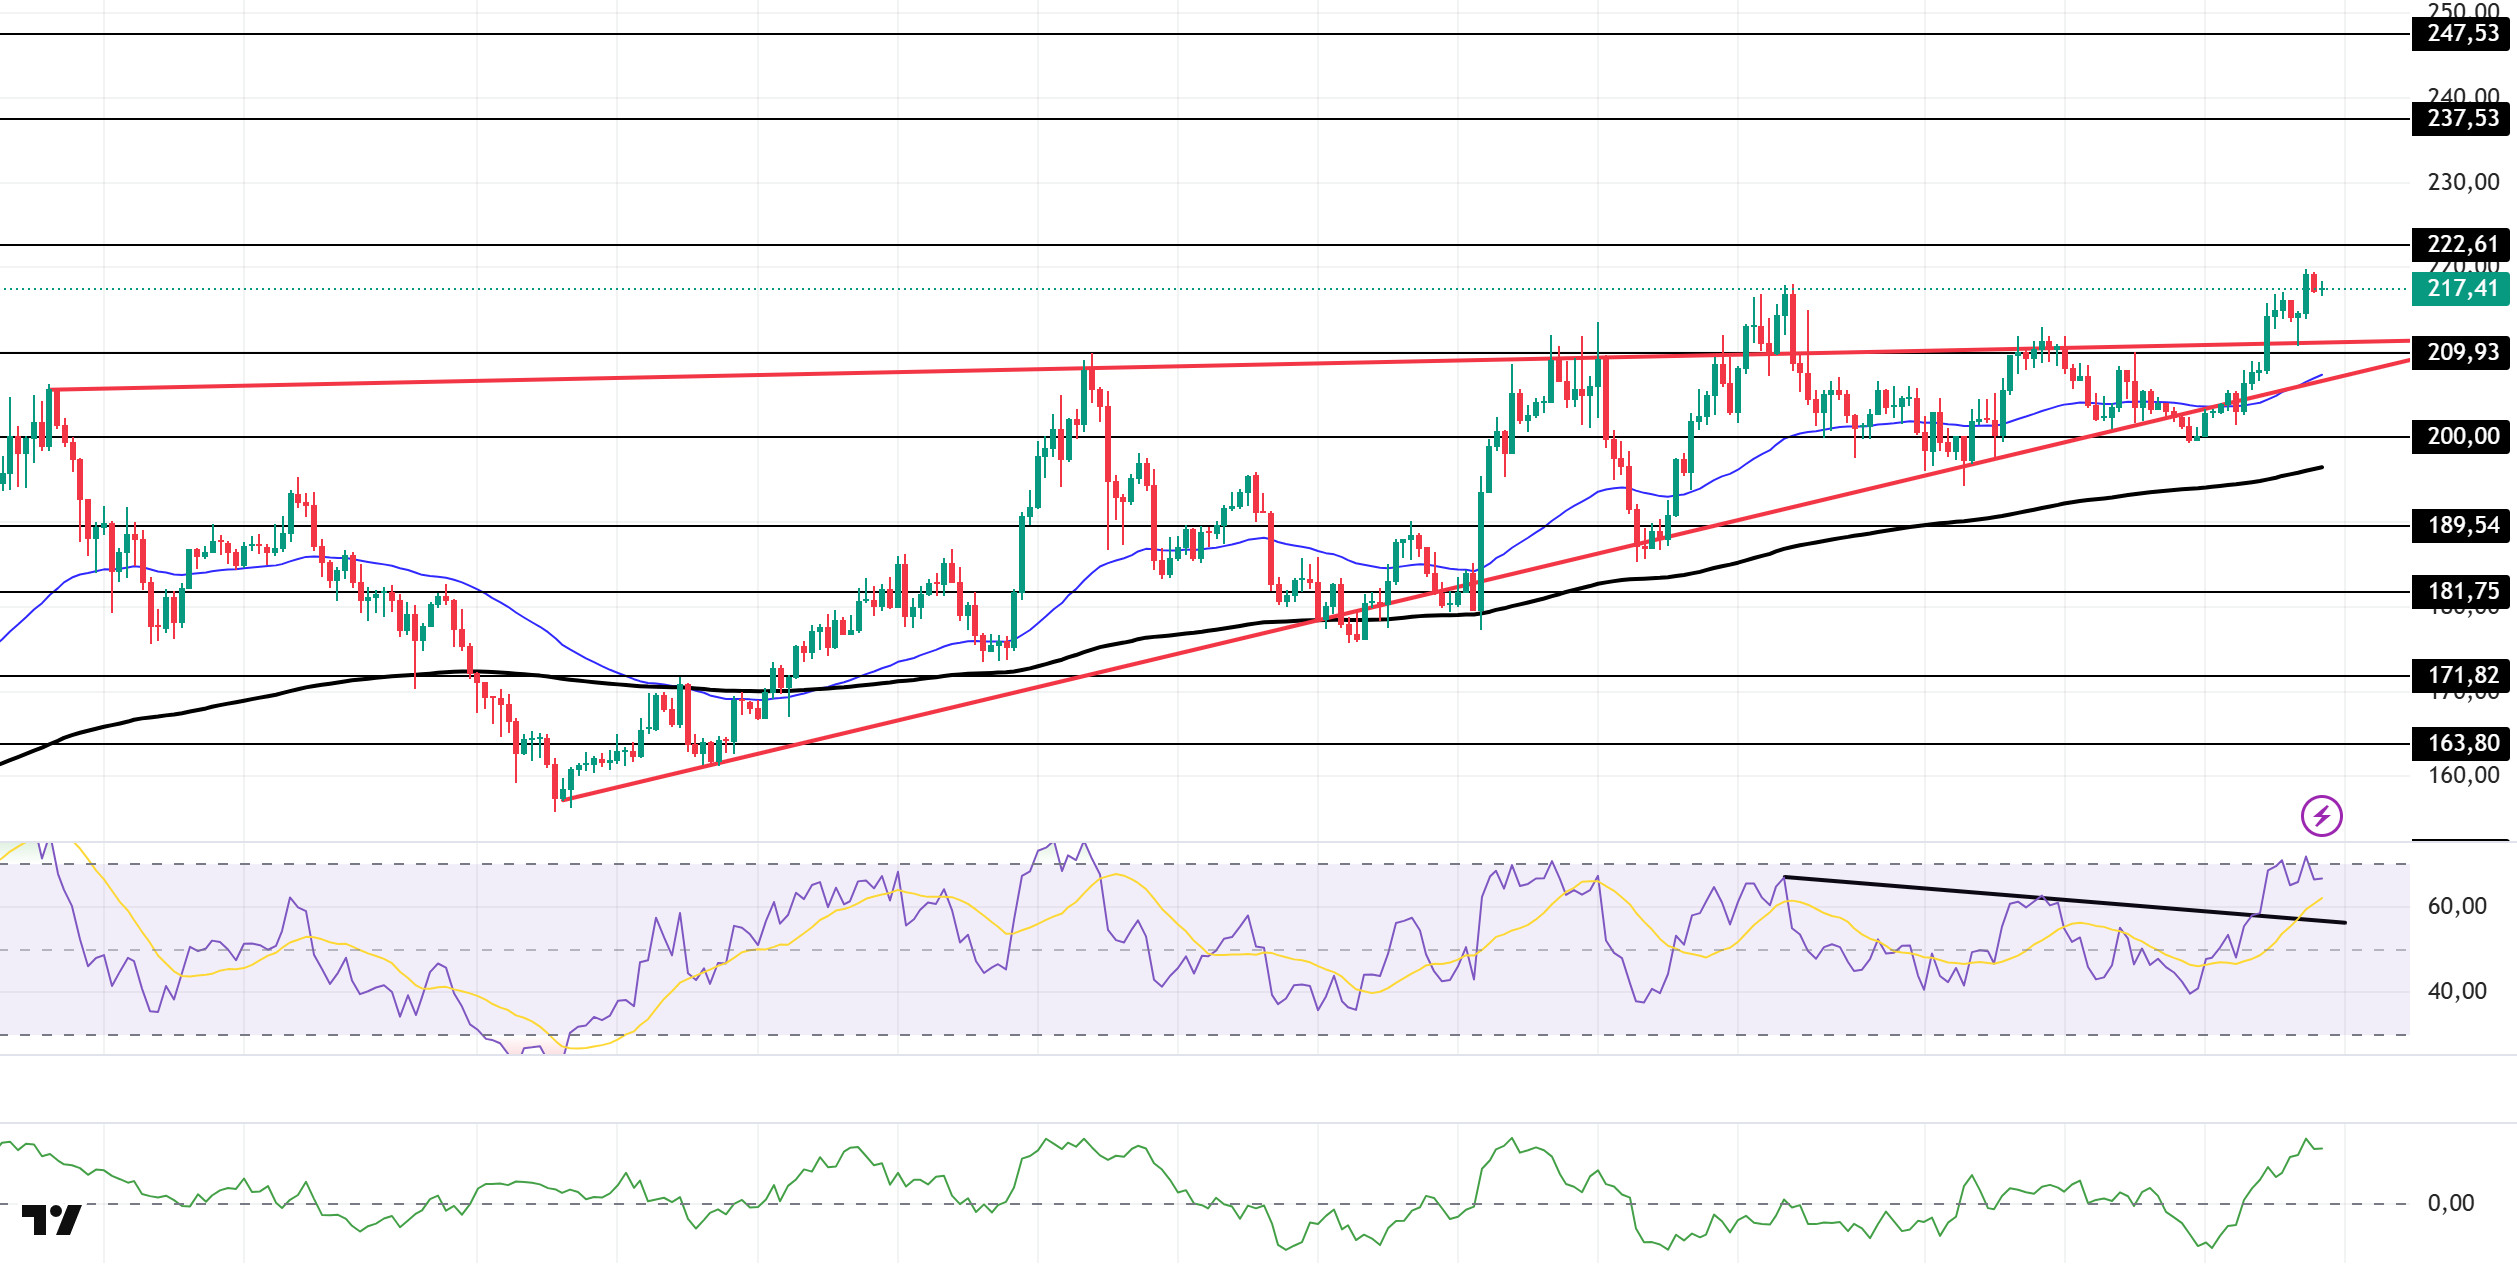
SOL price was slightly bullish during the day. The asset broke the rising wedge pattern that started on August 2 to the upside and remained there. The price, which tested the ceiling level of the rising wedge pattern as support, saw support from here and experienced a slight rise. In case of a continuation of the rise, the 222.61 dollar level can be followed as resistance. In retracements, the ceiling level of the pattern can work as support.
On the 4-hour chart, it continued to be above the 50 EMA (Exponential Moving Average – Blue Line) and the 200 EMA (Black Line). This suggests that the uptrend may continue in the medium term. At the same time, the fact that the price is above both moving averages suggests that the market is bullish in the short term. Chaikin Money Flow (CMF-20) continued to be in positive territory. However, an increase in inflows may keep CMF above the positive zone. Relative Strength Index (RSI-14) continued to be in positive territory. It also remained above the ceiling of the downtrend that started on August 29. This could exacerbate the upside. However, being in the overbought zone, profit sales may cause a pullback. In the event of an uptrend on the back of macroeconomic data or positive news on the Solana ecosystem , the $222.61 level stands out as a strong resistance point. If this level is broken upwards, the rise can be expected to continue. If there are pullbacks due to contrary developments or profit realizations, the $ 200.00 level can be tested. In case of a decline to these support levels, the increase in buying momentum may offer a potential bullish opportunity.
Supports 209.93 – 200.00 – 189.54
Resistances 222.61 – 237.53 – 247.53
DOGE/USDT
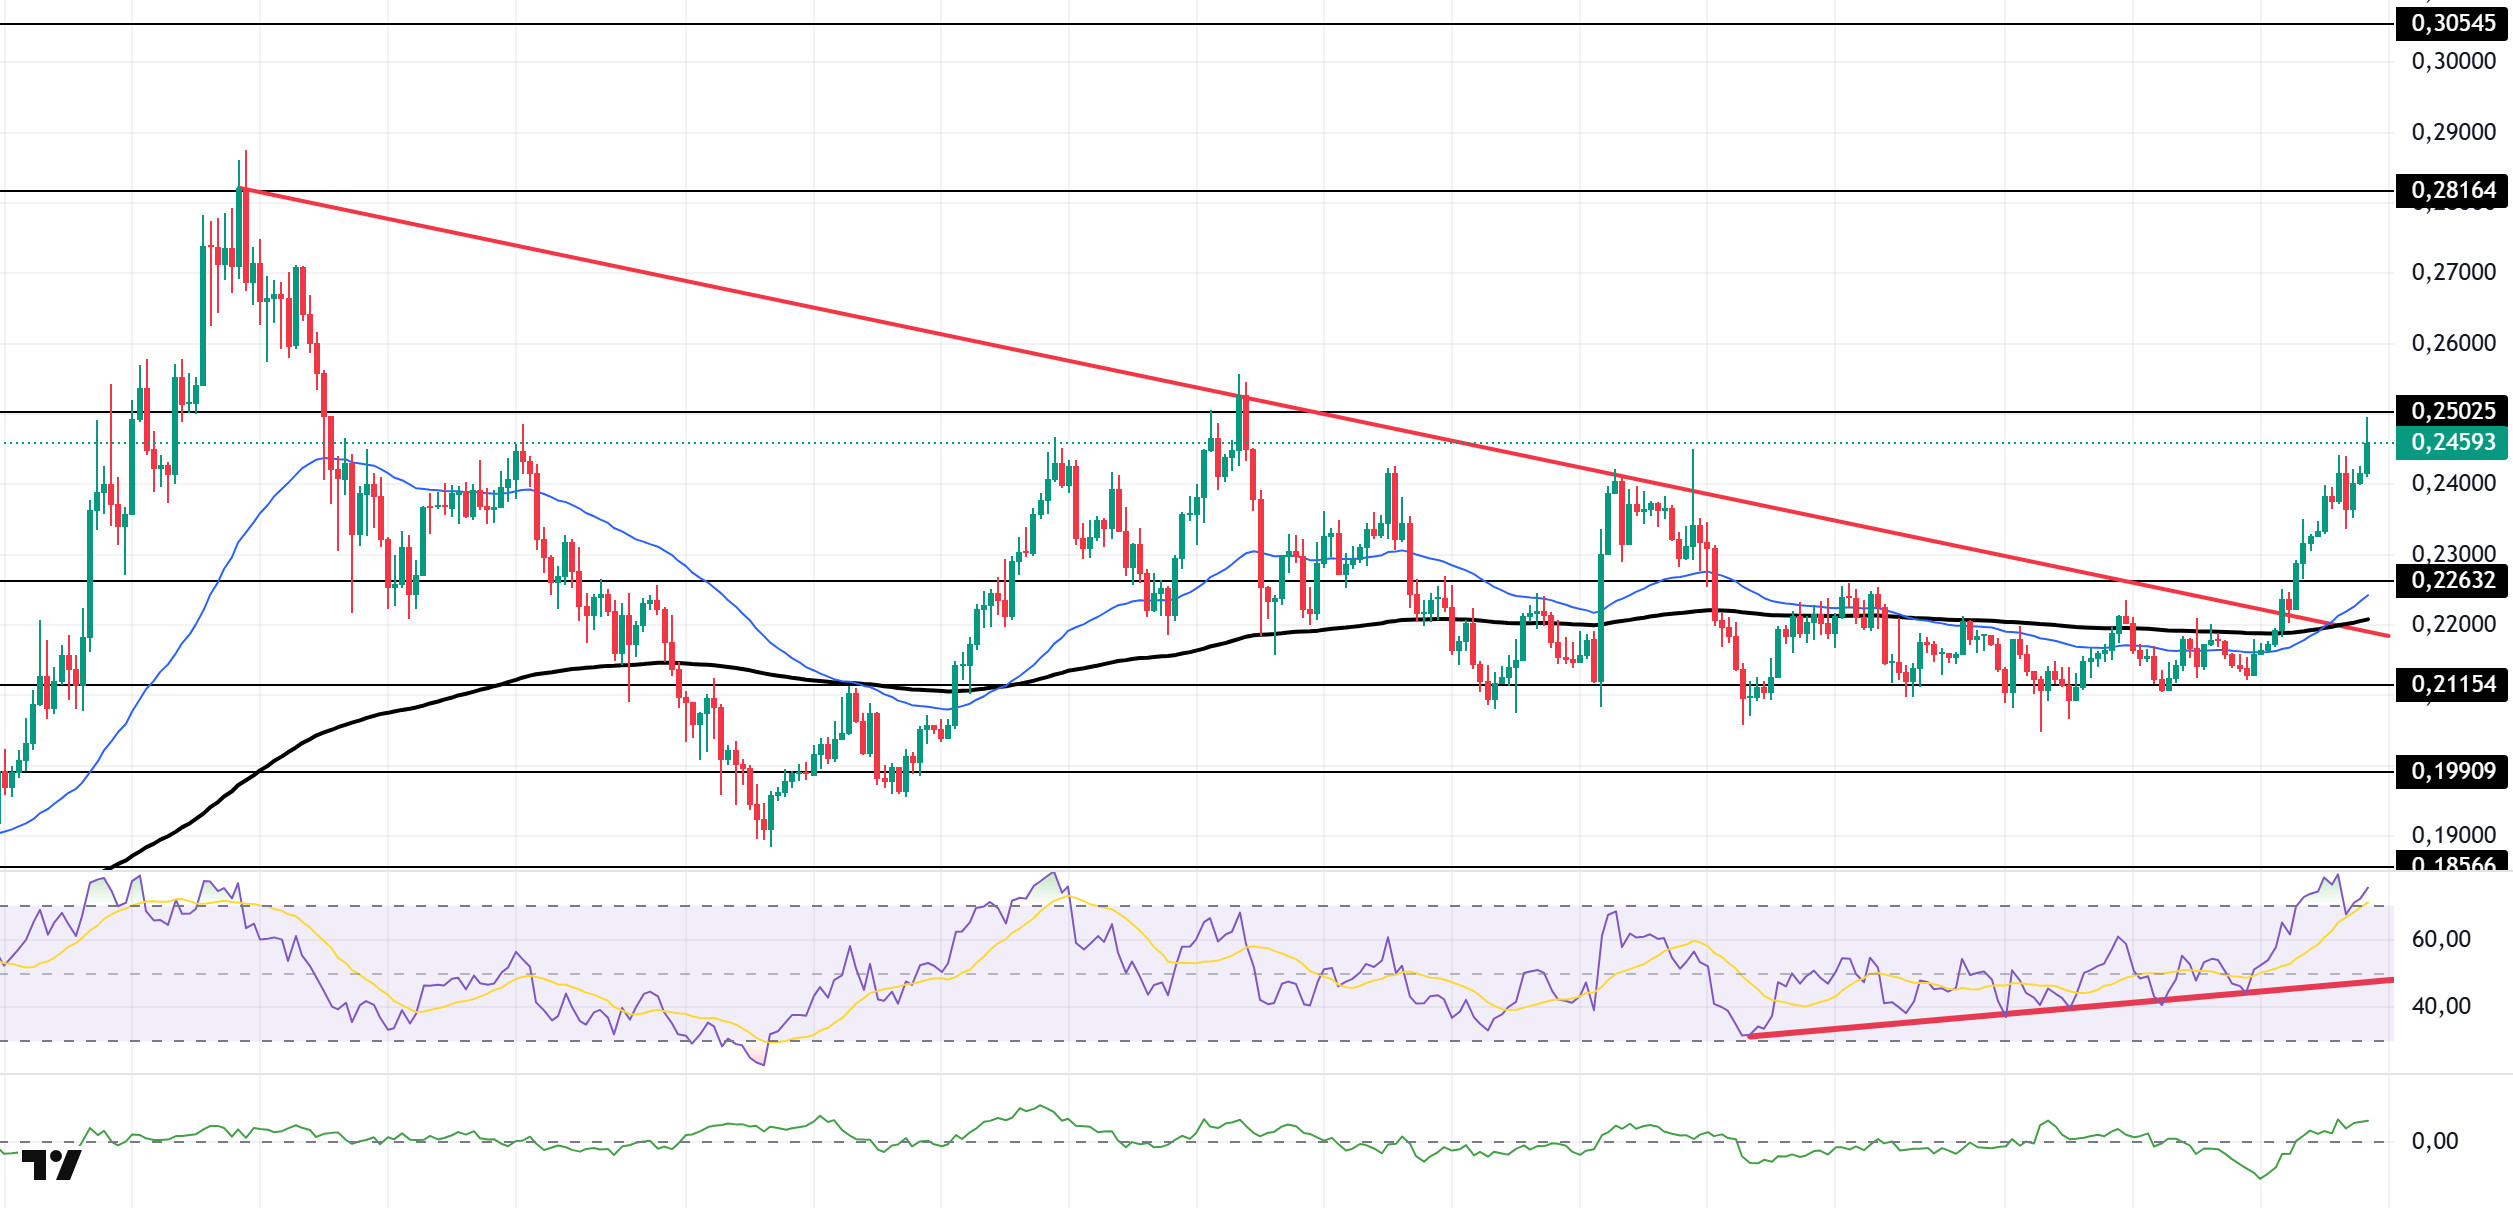
DOGE price continued its uptrend during the day. The asset broke the downtrend that started on July 21 with a strong candle and continues to hold above it. Above the 50 EMA (Exponential Moving Average – Blue Line) and 200 EMA (Black Line) moving averages, the price maintained its momentum and continued its uptrend, testing the strong resistance level of $0.25025 before pulling back. As of now, the asset, which maintains its momentum, may break the $0.25025 level if it continues its rise. In case of a possible pullback, the $0.22632 level may be triggered.
On the 4-hour chart, the 50 EMA (Blue Line) remained above the 200 EMA (Black Line). This signals the start of an uptrend in the medium term. The fact that the price is above both moving averages suggests a strong bullish bias in the short term. Chaikin Money Flow (CMF-20) continues to be in positive territory. In addition, an increase in money inflows may push CMF above the positive zone. Relative Strength Index (RSI-14) continued to hold in overbought territory. This indicates that profit sales may be possible. At the same time, it continues to be in the upper zone of the uptrend that started on August 26. This signaled that momentum may continue. The $0.28161 level stands out as a strong resistance zone in the rises that may be experienced in line with political developments, macroeconomic data or positive news flow in the DOGE ecosystem. In the opposite case or in case of possible negative news flow, the $0.22632 level may be triggered. In case of a decline to these levels, the momentum may increase and a new bullish wave may start.
Supports 0.22632 – 0.21154 – 0.19909
Resistances 0.25025 – 0.28164 – 0.30545
AVAX/USDT
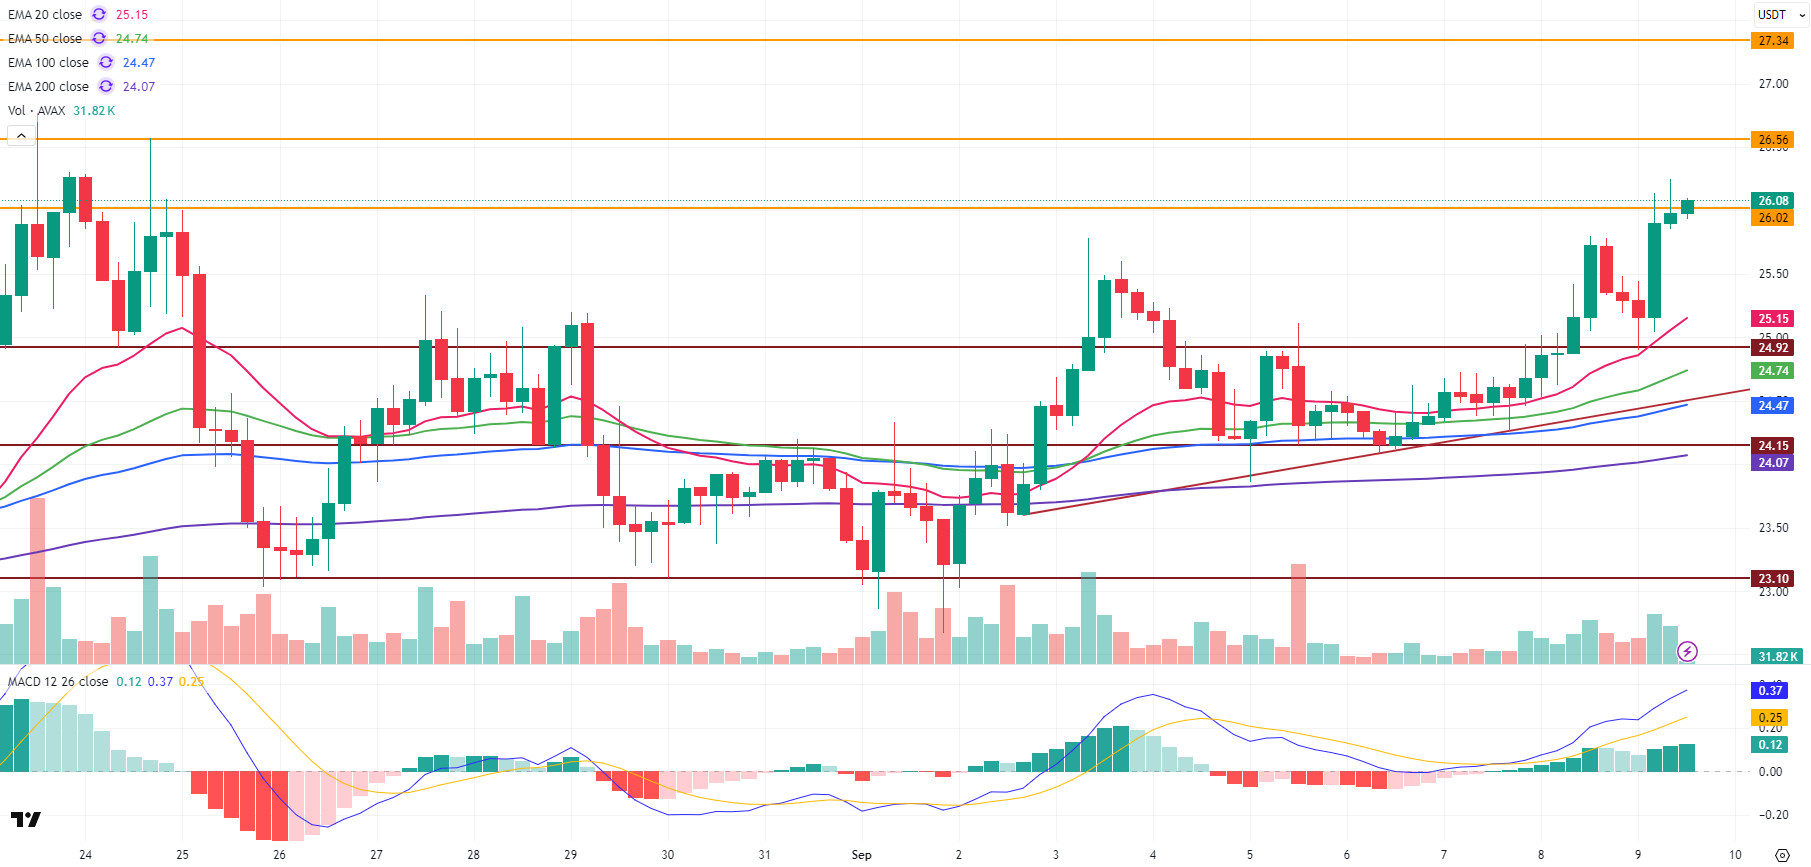
AVAX, which started the day with a rise, continues to test the $ 26 level. AVAX, which rose to $ 26.25 during the day, fell back to the $ 26 level with sales from this region. While the positive momentum prevents the selling pressure from deepening, as we have emphasized before, maintaining a permanence above the $ 26 level is critical for the continuation of the rise. If the persistence above this level is successful, the potential for a gradual rise towards the $ 30 level may come to the agenda in the short term in line with the technical outlook. Continued positive news flow and strong trading volume are important for this scenario to materialize.
On the technical indicators side, the Moving Average Convergence/Divergence (MACD) on the 4-hour chart is above the signal line and continues to rise. This indicates that the upward trend may continue. While AVAX is moving away from the critical Exponential Moving Average (EMA) levels in its rise, this situation weakens the selling pressure and increases the bullish potential. As we mentioned earlier, momentum continues to strengthen while selling pressure is decreasing.
AVAX has not yet closed above the $ 26.02 resistance level, which is seen as a critical threshold in its rise. Although the frequent testing of this level shows that buyers are increasing the pressure, there has been no clear breakthrough so far. The realization of 4-hour candle closures above this region is of great importance in terms of confirming the upward momentum in technical terms. If AVAX can maintain above this level, it can be expected that the uptrend will gain momentum as the selling pressure decreases and the volume on the buy side increases. In such a scenario, resistance levels of $ 26.56 and then $ 27.34 may come to the agenda. If these resistances are broken in volume, a gradual rise towards the $ 30 band seems likely. On the other hand, if the $ 26.02 level cannot be exceeded, there may be a risk of increased profit sales and the start of a technical correction movement. In such a pullback, the EMA20 and $ 24.92 support levels stand out in the first place, while the support levels of $ 24.15 and $ 23.10 may come to the agenda, respectively, if it falls below these levels. Although the overall outlook is still positive, it is critical that positive news flow and volume purchases continue in the market for the continuation of the upward movement. Otherwise, profit selling at resistance zones and weakening momentum may put pressure on the price in the short term.
(EMA20: Pink Line EMA50: Green Line, EMA100: Blue Line, EMA200: Purple Line)
Supports 24.92 – 24.15 – 23.10
Resistances 26.02 – 26.56 – 27.34
BNB/USDT
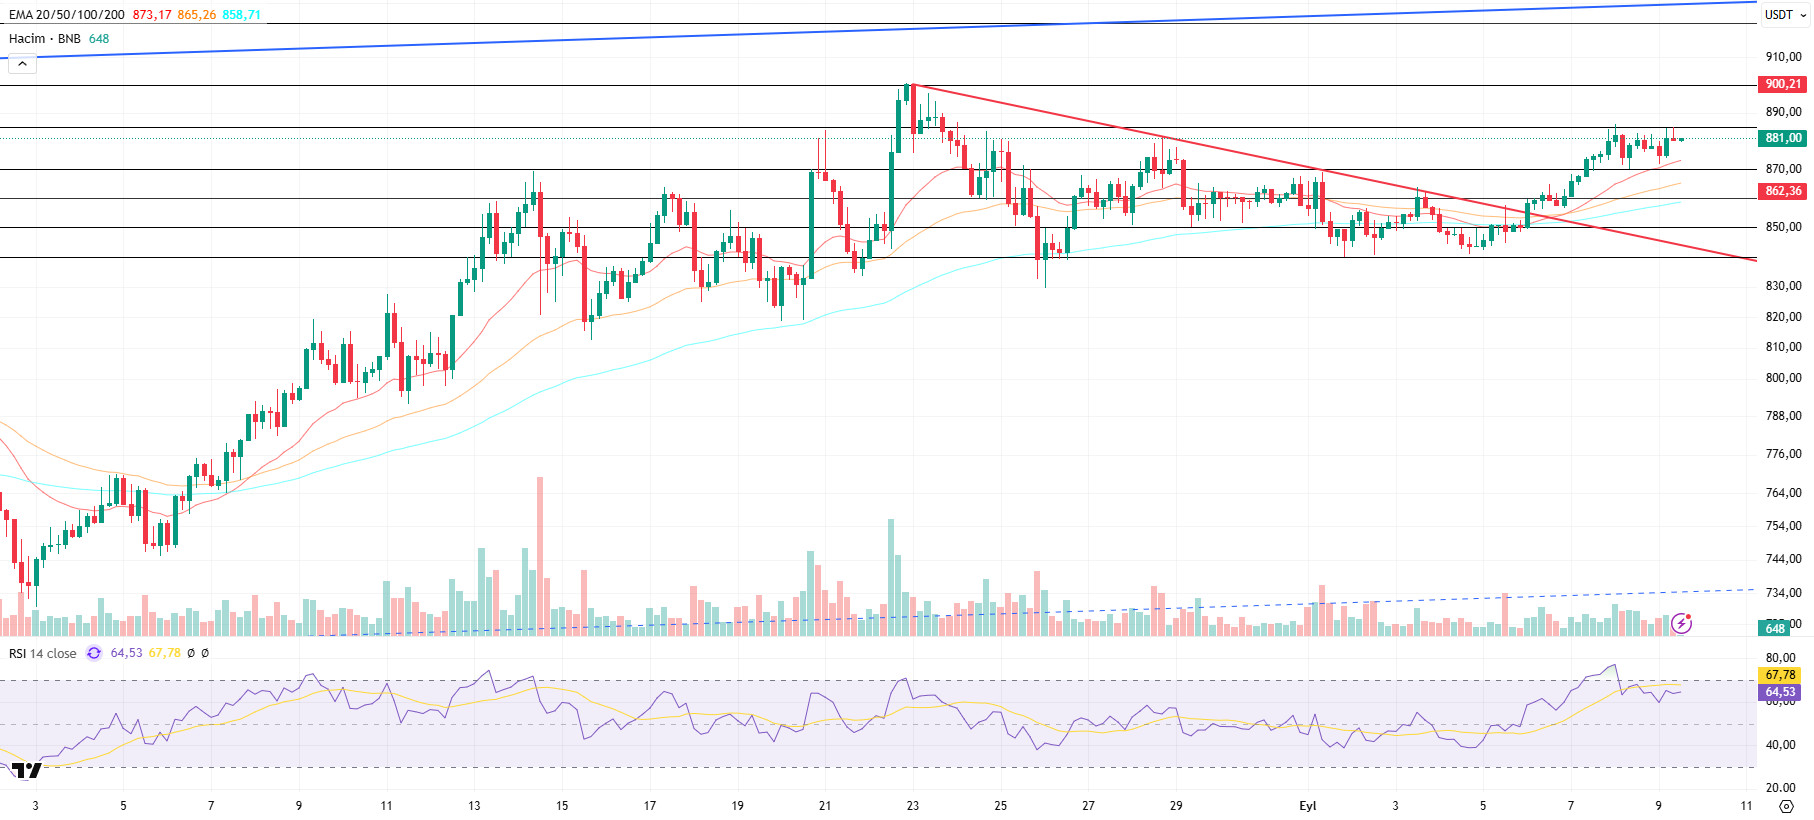
From a technical perspective, BNB/USDT retreated to $840 on the four-hour chart with selling pressure coming from the $900 peak. BNB, which received support three times from this level, regained bullish momentum and recovered to the $ 885 level. Thus, the price action generally displayed a horizontal outlook in the $ 840-885 band.
However, the selling pressure encountered below the $ 885 level caused the price to retreat to the $ 870 level in line with our expectation. With the purchases from here, BNB gained upward momentum again and stabilized in the range of $ 870-885. This outlook shows that the price is in the decision phase.
Technical indicators for BNB/USDT, which is currently trading in the range of $870-885, reveal that the recent weakness in trading volume has attracted attention. This picture indicates that indecision is prominent in the market. In addition, although the Relative Strength Index (RSI) rose above the 70 level, it declined under selling pressure with the new day and turned its direction down. This technical outlook indicates that downward pressure may continue in the short term.
According to the current picture, if the buying momentum is maintained, BNB is expected to test the $ 885 resistance level in the first place. If this level is exceeded, it is possible that the price may head towards the $ 900 and $ 990 levels, respectively. On the other hand, if the $ 885 level cannot be exceeded and sales strengthen, the price is likely to retreat back to $ 870 support. If this level is broken, the $ 860 and $ 850 levels stand out as critical regions to be monitored.
Supports 870 – 860 – 850
Resistances 885 – 900 – 920
ADA/USDT
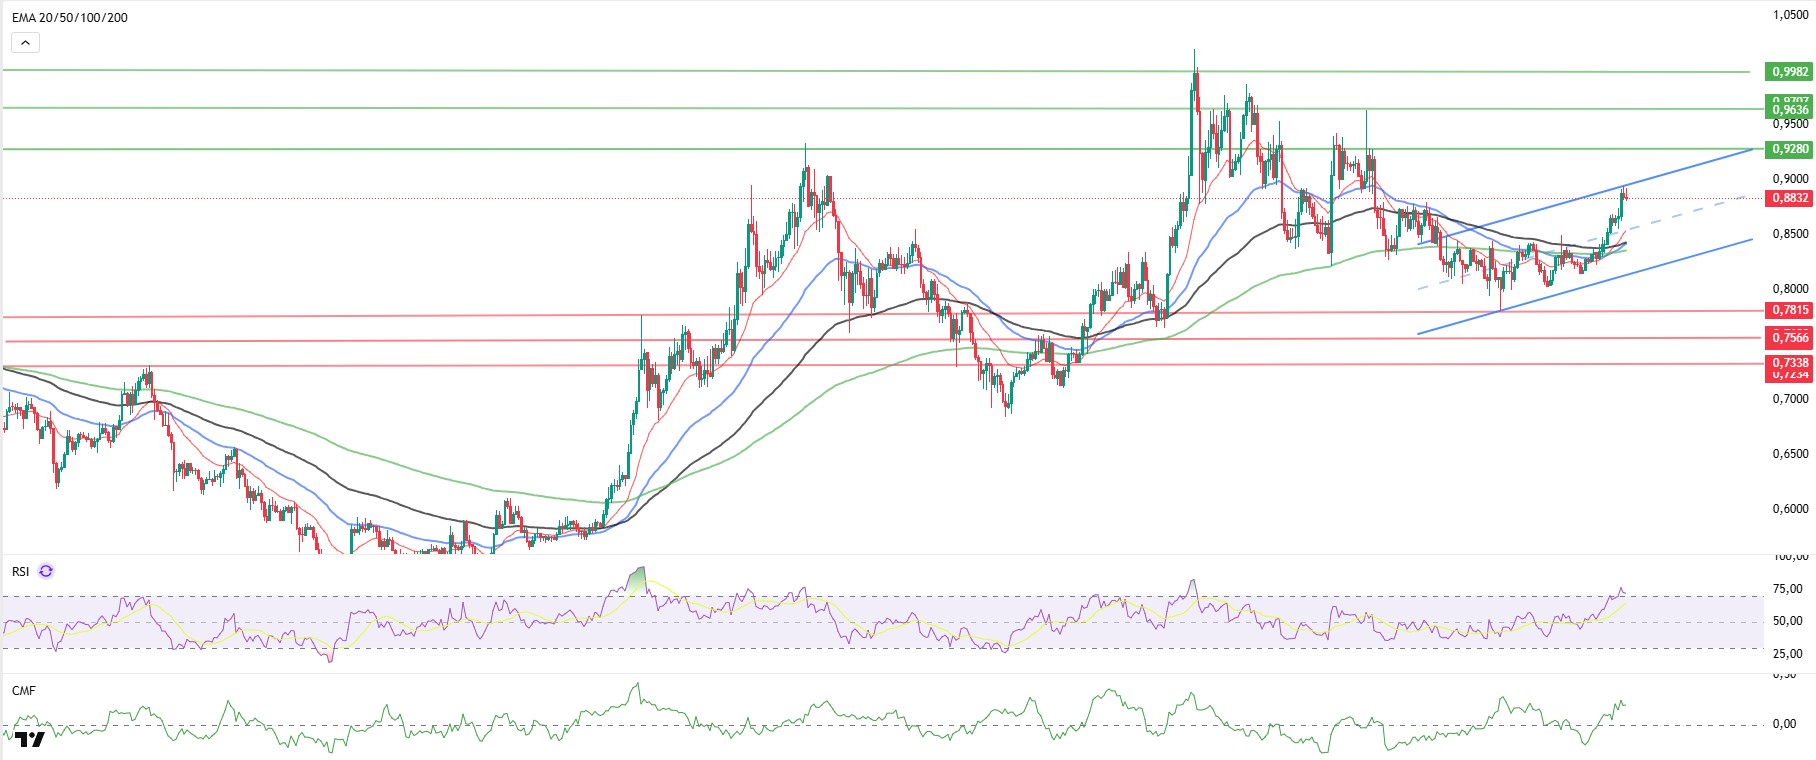
ADA executed the liquidation of leveraged orders accumulated above $0.8968, the long confirmation levels that I expect to rise during the day. With this move, the price took its first downside reaction by testing the first resistance point at $0.8956 and realized its re-test. Currently, 103.64K leveraged positions are pending at $0.9052. When the price reaches this level, it can be expected to rise to $0.9280, the top of the rising channel band within the major trend, with reaction purchases.
ADA continues its movement in the ascending channel band for the major trend, breaking the ascending symmetrical triangle pattern. The price remains above all moving averages, preserving the bullish potential on volume. Especially the 20-day Exponential Moving Average (EMA 20 – Red Line) and (EMA 50 – Blue Line) are critical for the continuation of the uptrend. Relative Strength Index (RSI) rose to 71, signaling that the overbought zone is approaching, while Chaikin Money Flow (CMF-20) rose to 0.18, indicating that the buying potential continues. A bullish signal in inflows may keep CMF in positive territory. The positive correlation between these two indicators gives a strong signal that a buying effect will continue. In case of Trump’s statements today or if there are purchases in the ADA ecosystem, the $0.9280 level may appear as our strong resistance point. If the decline starts, the 0.7851 dollar level should be followed as a critical support point.
Supports 0.7851 – 0.7566 – 0.7170
Resistances 0.9982 – 0.9636 – 0.9280
Legal Notice
The investment information, comments, and recommendations contained herein do not constitute investment advice. Investment advisory services are provided individually by authorized institutions taking into account the risk and return preferences of individuals. The comments and recommendations contained herein are of a general nature. These recommendations may not be suitable for your financial situation and risk and return preferences. Therefore, making an investment decision based solely on the information contained herein may not produce results in line with your expectations.


