
Technical Analysis
BTC/USDT
The idea of a 10% reciprocal tariff between the US and the European Union became the main compromise in trade negotiations. In Iran, trading restrictions were imposed on the country’s stock exchanges following an Israeli technological attack. Trump quietly reduced his stake in crypto project WLFI, while $3.9 billion worth of BTC and ETH options on the options market expire tomorrow. While it was a relatively quiet day for the markets, the news flow will continue to be the focus of the market for the rest of the day, although we reiterate that the US stock markets are closed.
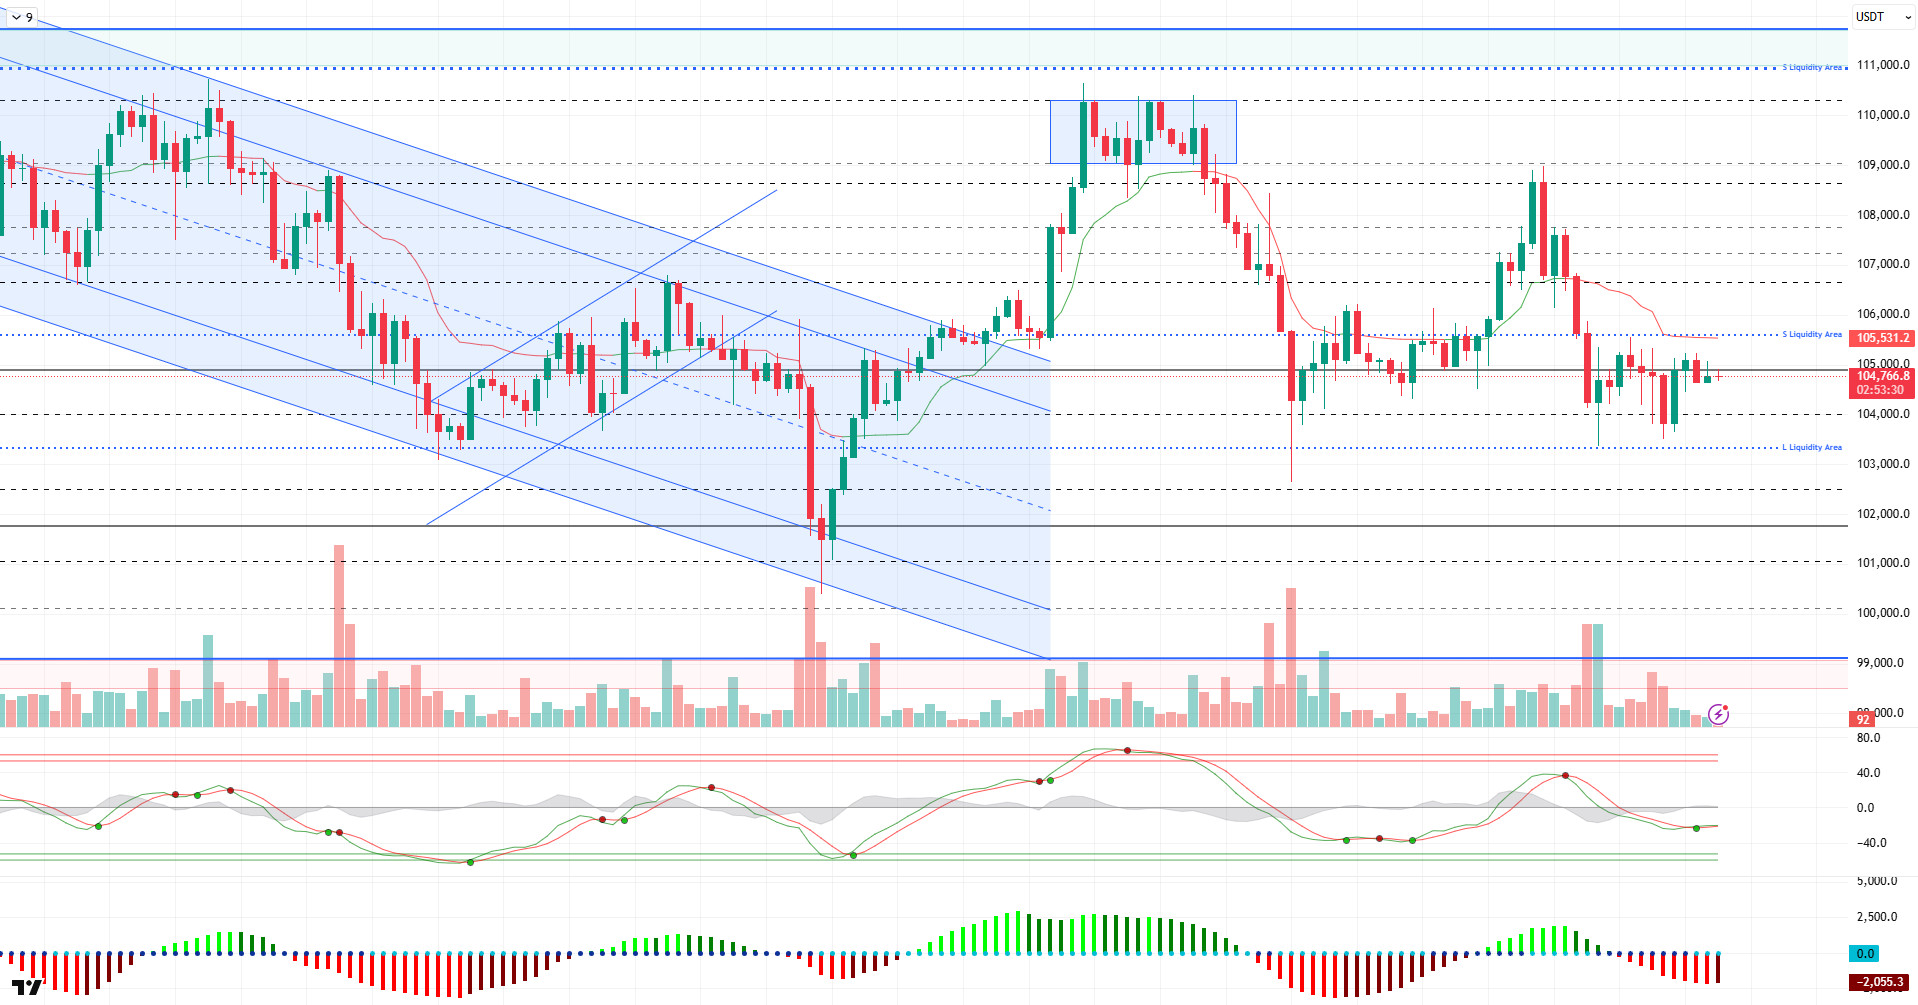
Looking at the technical outlook, we can say that the BTC price continues to move in low volatility and weak volume conditions in line with the previous analysis and is trading at 105,800 levels, just below the 105,000 resistance.
On the technical indicators front, the Wave Trend (WT) oscillator maintains its buy signal, albeit weak. This indicates that the upside potential of the price continues, while the Squeeze Momentum (SM) indicator is trying to regain momentum after reaching maximum levels. However, it is not yet clear whether this momentum is sustainable. The Kaufman moving average is just below the price at 105,500 and does not give a signal to fully support the rise. Unless the price breaks above this average with persistence, it would be premature to talk about a strong uptrend.
The picture has not changed on the liquidity data side either. While most of the buying positions have been liquidated, it is seen that the selling positions are maintained in the 105,700-107,000 band. This indicates that if the price rises to these levels, it may encounter resistance.
As a result, although BTC’s technical structure and liquidity data provide a bullish backdrop, the short-term direction is still undecided. If the 105,000 level is crossed on volume, the 106,600 level is likely to be targeted. On the other hand, in a scenario where fundamental developments are insufficient or negative surprises occur, the 104,000 and 103,300 levels will regain importance as support points. In this context, hourly closes above 105,000 and attacks above 106,000 will be decisive for determining the direction in the short term. In the long term, technical and fundamental data continue to show that BTC maintains its strong stance and may continue its upward movement in the appropriate environment.
Supports 104,000 -103,300 -102,400
Resistances 105,000 – 105,500 -106,600
ETH/USDT
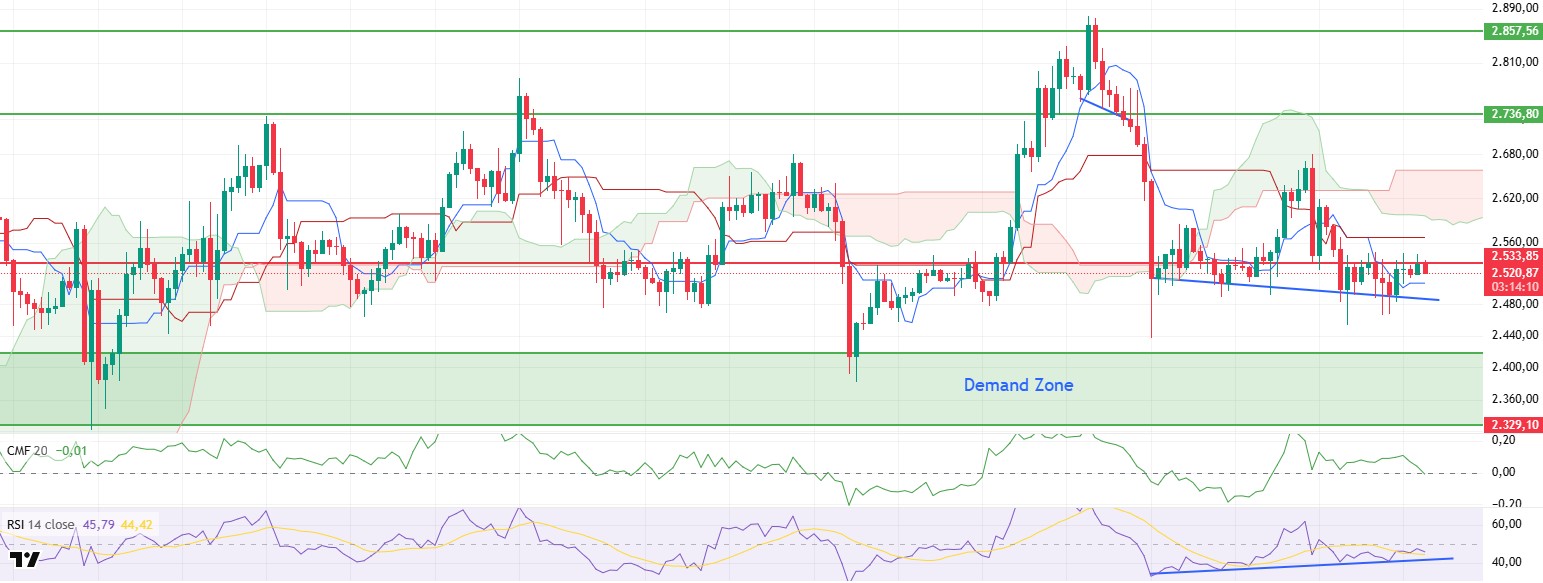
ETH continued to be priced at the level of $2,533, following a horizontal course as predicted in the morning hours in line with technical indicators during the day. This stable outlook shows that the market is in search of direction in the short term and investors continue to act cautiously.
When technical indicators are analyzed in more depth, it is noteworthy that the Chaikin Money Flow (CMF) indicator maintained its downward trend throughout the day and retreated to the zero line. This outlook reveals that capital outflows from the market continue and the selling pressure has not yet lost its effect.
On the other hand, the Relative Strength Index (RSI) is more stable than the CMF. The fact that the RSI continues to remain above its moving average (MA) can be considered as an important sign supporting the momentum in the market. In addition to this structure, other momentum-based indicators such as Commodity Channel Index (CCI) and Money Flow Index (MFI), including RSI, are showing positive divergence signals. This triple combination can be considered a strong bullish signal, especially in scenarios where price pressure is easing and upside potential is accumulating.
On the Ichimoku indicator side, the price seems to maintain its position under the kumo cloud. While this technical structure indicates that the market is generally priced in a bearish zone, the fact that the price remains stuck between the tenkan and kijun levels indicates that there is an undecided balance between market players. This squeeze represents a transition zone that should be carefully monitored in terms of possible breakouts both upwards and downwards.
Looking at the overall picture, the negative structure in CMF suggests that the pressure is still there, but the positive divergences observed in indicators such as RSI, CCI and MFI may be preparing the ground for an upward price move. If the ETH price manages to break above the $2,533 level, this could be considered as the beginning of a new bullish wave in technical terms. However, in the opposite scenario, that is, in case of permanent closures below this level, CMF-induced selling pressure may deepen and downside risks for the ETH price may come to the fore again.
Supports 2,329 – 2,130 – 2,029
Resistances 2,533 – 2,736 – 2,857
XRP/USDT
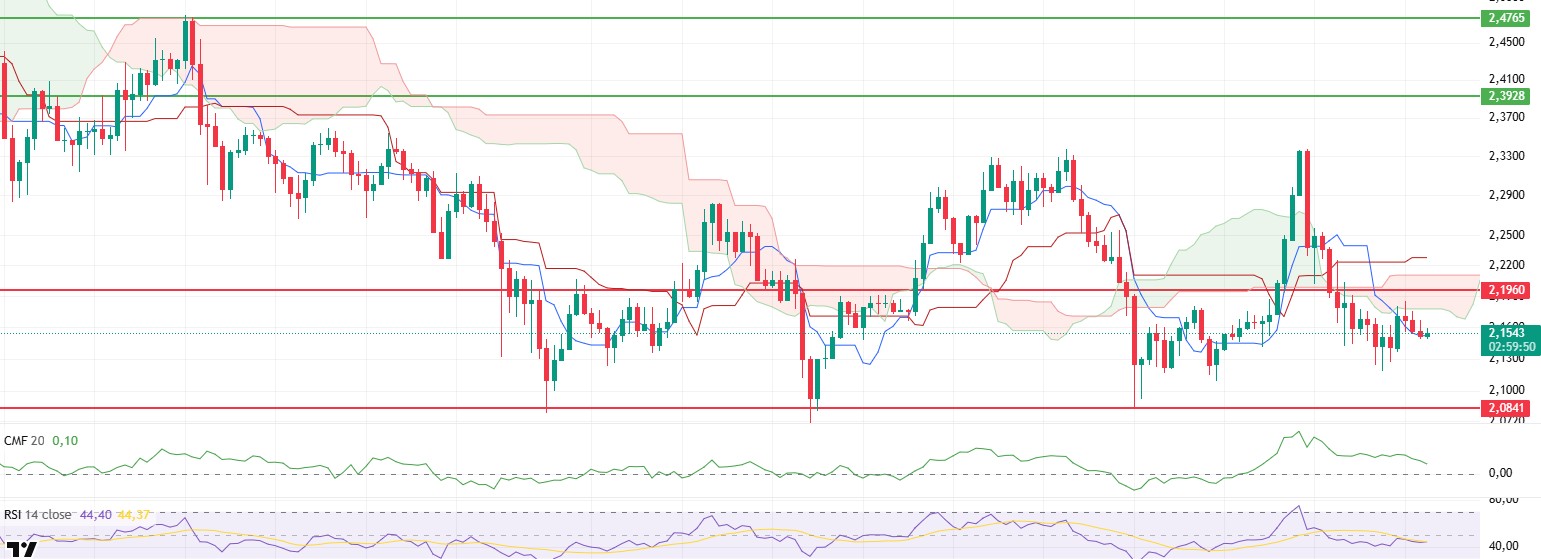
XRP continued its decline during the day with the effect of selling pressure and fell as low as $2.15. This move reveals that especially short-term buyers remain weak and the market continues to trend downward.
Looking at the overall outlook of technical indicators, it is noteworthy that the downward trend in the Chaikin Money Flow (CMF) indicator continues. The fact that CMF remains in negative territory indicates that liquidity outflows from the market continue and investors’ risk appetite is weak.
On the Ichimoku indicator, the price remains below both the kijun level and the kumo cloud, confirming that the market is still technically pricing in negative territory. This structure suggests that the downtrend remains technically intact and that there is not yet enough strength for an upside reversal. However, one of the noteworthy details is that the price continues to move close to the tenkan level. This may indicate that the search for short-term equilibrium continues and some buyers are trying to build support from this area.
Momentum indicators showed a horizontal trend throughout the day. The indecisive outlook of indicators such as Relative Strength Index (RSI), Commodity Channel Index (CCI) and Money Flow Index (MFI) reveals that market players are cautious and a strong direction has not yet been determined. This suggests that despite the bearish move, a serious panic mood has not set in, but at the same time, buyers have not stepped in strongly.
When the overall technical outlook is evaluated, as emphasized in the analysis made in the morning, if the price cannot exceed the lower band of the kumo cloud in the $2.17 – $ 2.18 band, the downward pressure is likely to continue. Since this zone is also a short-term resistance, a meaningful breakthrough in the technical structure may occur if it is exceeded. In this scenario, it may become possible for an upward movement to be triggered and the price to start a new upward wave. However, as long as it remains below this resistance, selling pressure and price weakness may continue in line with the current negative technical structure.
Supports 2.0841 – 1.9664 – 1.6309
Resistances 2.1960 – 2.3928- 2.4765
SOL/USDT
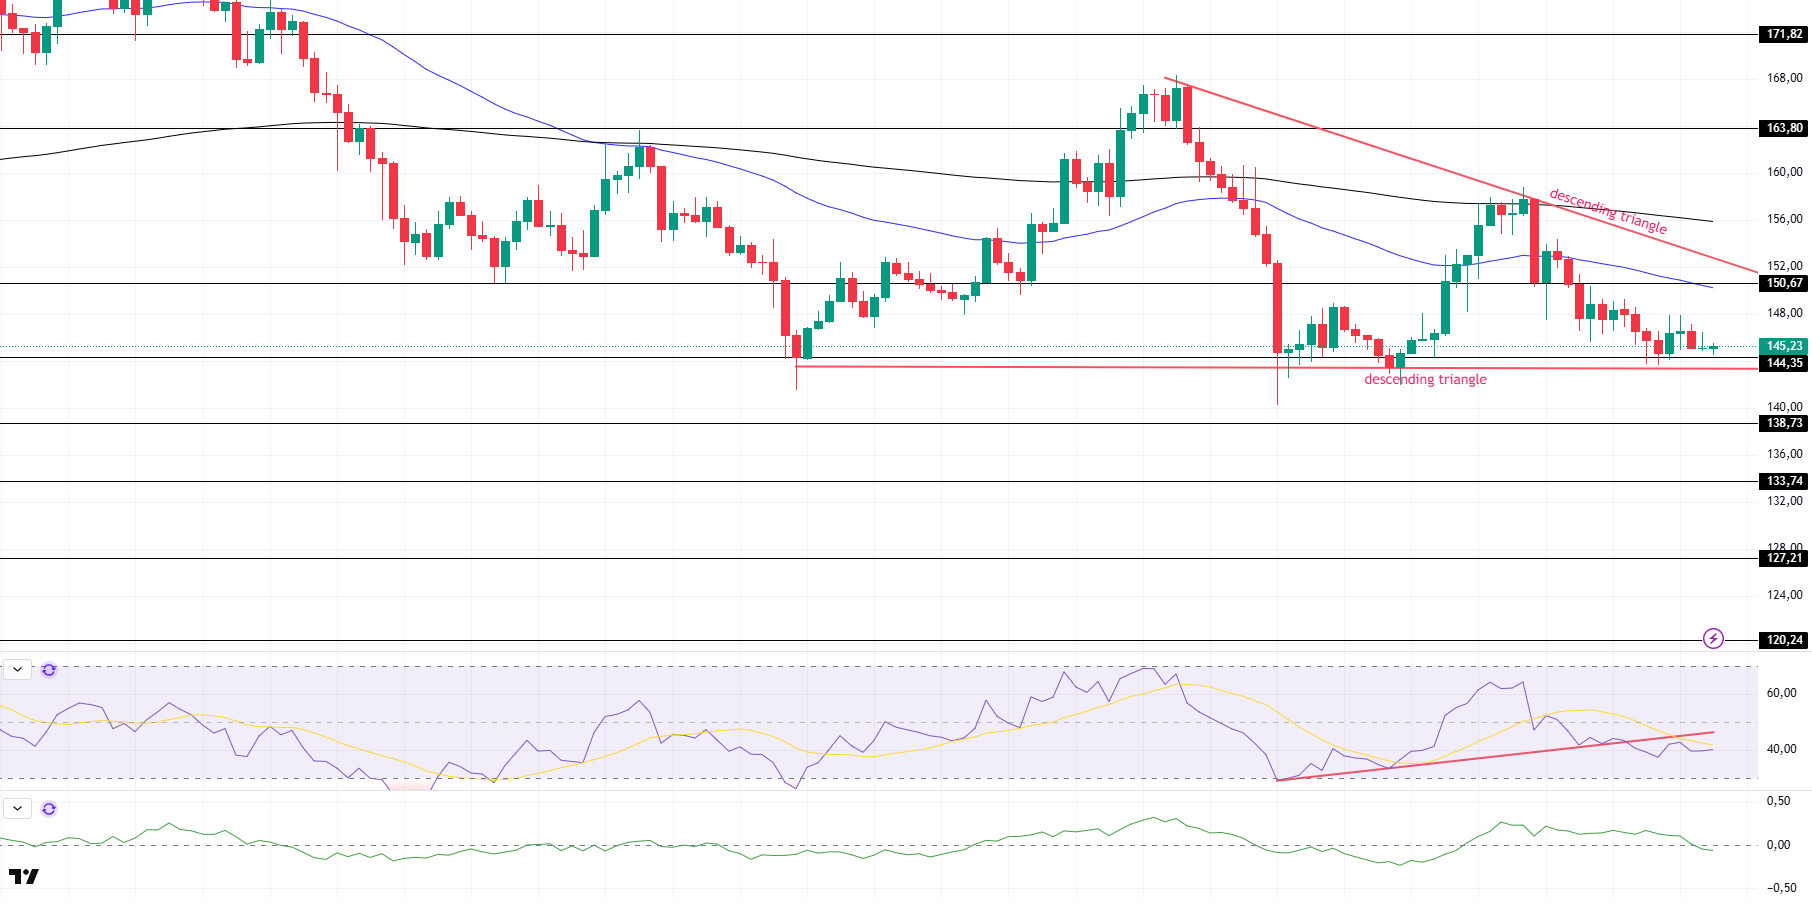
The SOL price followed a sideways trend during the day. The asset is currently retesting the $144.35 support level and the base level of the descending triangle pattern, which is a strong resistance. If it moves upwards, it may test the $150.67 level and the 50 EMA (Blue Line) moving average as resistance. The retracement may deepen on closures below the base level of the descending triangle pattern.
On the 4-hour chart, the 50 EMA continued to be below the 200 EMA. This suggests that the bearish trend may continue in the medium term. At the same time, the fact that the price is below both moving averages suggests that the market may continue to retrace in the short term at the moment. Chaikin Money Flow (CMF-20) has crossed into negative territory; in addition, a decrease in daily inflows may move CMF into negative territory. Relative Strength Index (RSI-14) continued to be in negative territory. On the other hand, it broke the uptrend that started on June 13 to the downside and may test the downtrend as resistance. If it breaks it, the uptrend may start. The $150.67 level stands out as a strong resistance point in case of an uptrend on the back of macroeconomic data or positive news on the Solana ecosystem. If this level is broken upwards, the rise can be expected to continue. If there are pullbacks due to contrary developments or profit realizations, the $138.73 level can be tested. In case of a decline to these support levels, the increase in buying momentum may offer a potential bullish opportunity.
Supports 144.35 – 138.73 – 133.74
Resistances 150.67 – 163.80 – 171.82
DOGE/USDT
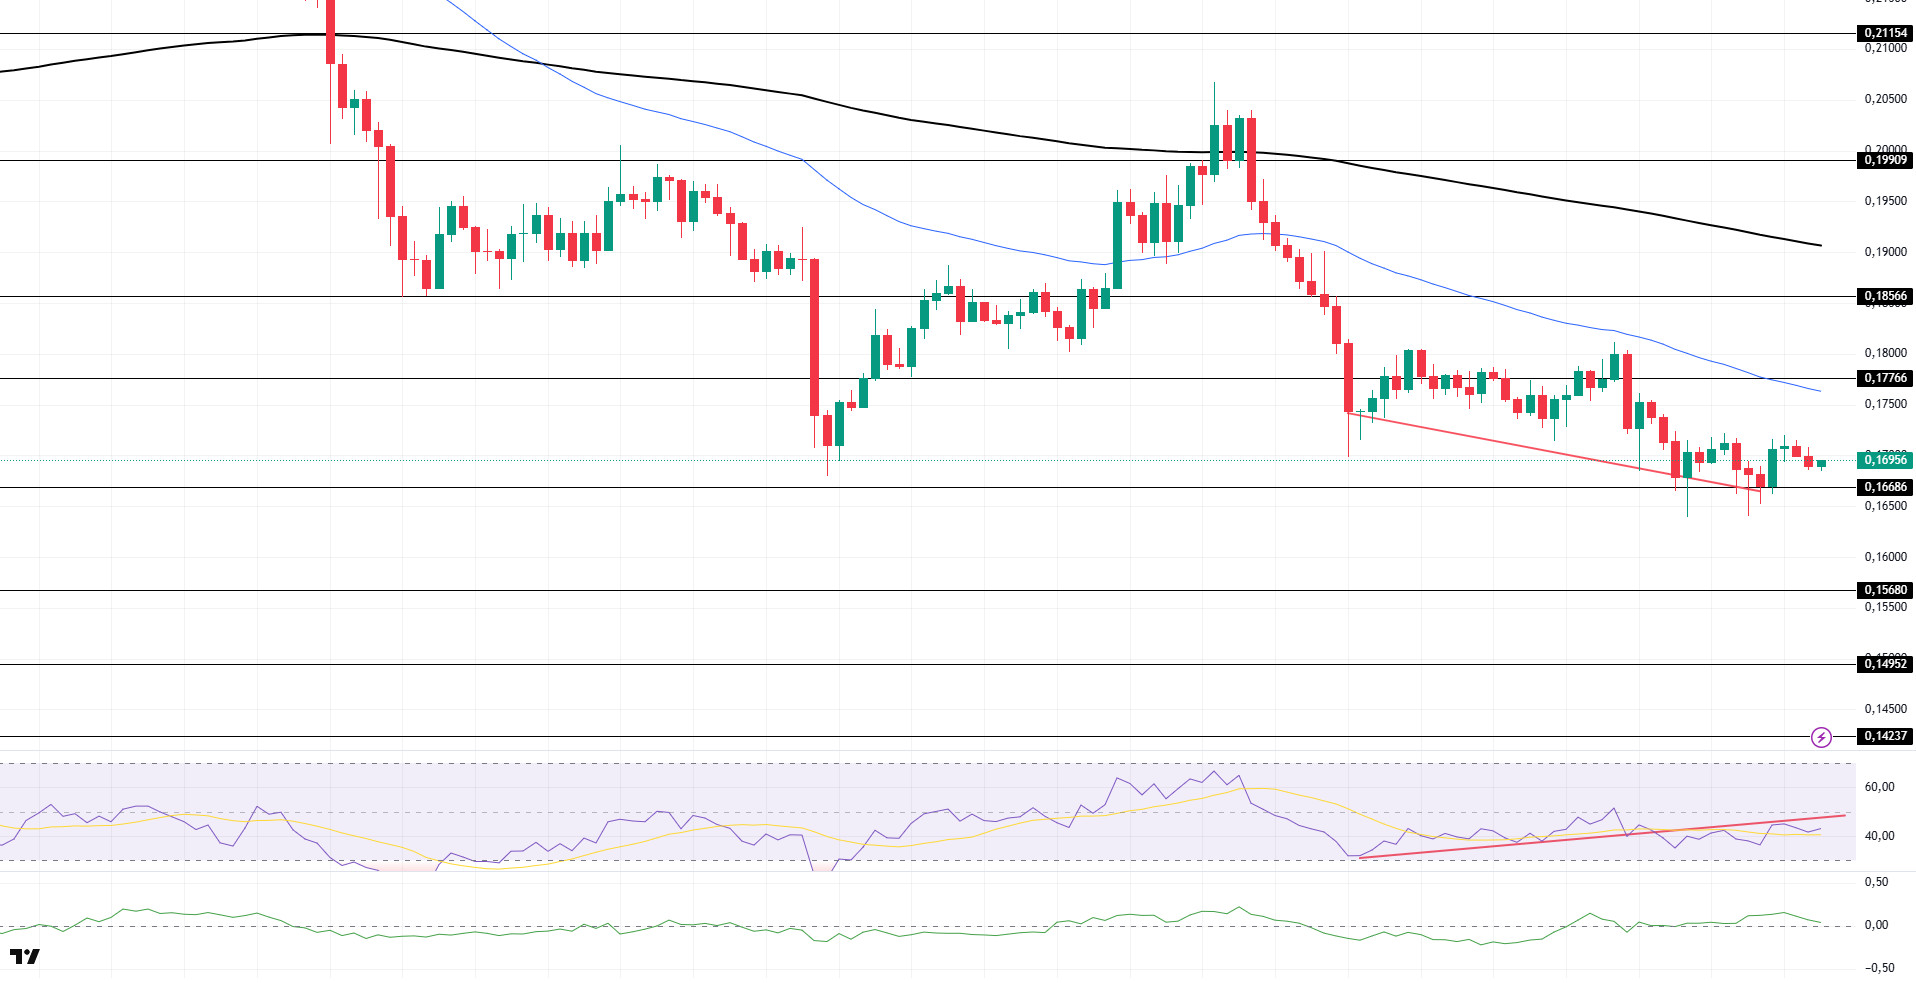
DOGE price followed a horizontal course during the day. The asset, which tested the strong support level of $0.16686 as support, accelerated from here and rose slightly. If the candle closure below the level of 0.16686 occurs, the retreat may deepen. Otherwise, the strong resistance level of $0.17766 and the 50 EMA (Blue Line) moving average should be followed.
On the 4-hour chart, the 50 EMA (Blue Line) continues to be below the 200 EMA (Black Line). This suggests that the asset is bearish in the medium term. The fact that the price is below the two moving averages signals that the asset remains bearish in the short term. Chaikin Money Flow (CMF-20) fell to neutral. In addition, negative money inflows may move CMF into negative territory. Relative Strength Index (RSI-14) continued to be in negative territory. However, it started to be below the uptrend formed since June 13 and although it tested it as resistance, it failed to break it, indicating that selling pressure continued. However, positive divergence should be monitored. This could be bullish. The $0.17766 level stands out as a strong resistance zone in the event of a rally in line with political developments, macroeconomic data or positive news flow in the DOGE ecosystem. In the opposite case or possible negative news flow, the $0.15680 level may be triggered. In case of a decline to these levels, the increase in momentum may start a new bullish wave.
Supports 0.16686 – 0.15680 – 0.14952
Resistances 0.17766 – 0.18566 – 0.19909
Legal Notice
The investment information, comments and recommendations contained herein do not constitute investment advice. Investment advisory services are provided individually by authorized institutions taking into account the risk and return preferences of individuals. The comments and recommendations contained herein are of a general nature. These recommendations may not be suitable for your financial situation and risk and return preferences. Therefore, making an investment decision based solely on the information contained herein may not produce results in line with your expectations.