
Technical Analysis
BTC/USDT
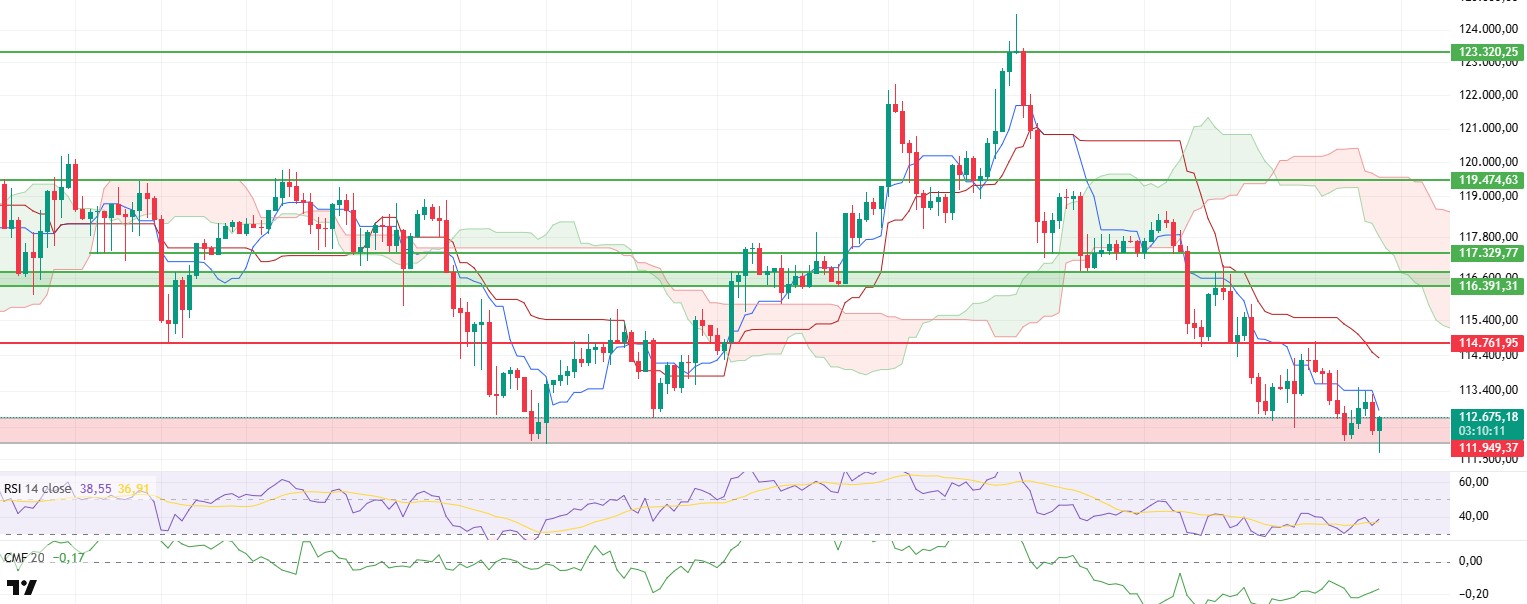
The BTC price fell below the 111,949-dollar level as the technical weaknesses highlighted in the morning analysis continued and is currently attempting to hold steady in this region. Both technical indicators and deteriorating market dynamics contributed to the price drop to this level, with increased selling pressure on the spot market appearing to be the primary catalyst for the decline.
When on-chain data and technical indicators are analyzed together, it is noteworthy that open interest and funding rate values have increased despite the price decline. This scenario indicates that long positions in the futures market continue to increase, while ongoing selling pressure in the spot market could accelerate the decline through liquidations. This situation makes it challenging for the price to stabilize in the short term and highlights the market’s fragile structure.
The Chaikin Money Flow (CMF) indicator remaining in negative territory confirms that liquidity outflows from the market are continuing and that sellers remain in a dominant position. The continuous withdrawal of liquidity from the market suggests that any upward attempts may remain limited unless there is a strong buyer demand.
When examining the Ichimoku indicator, the price moving below both the Kumo cloud and the Tenkan and Kijun levels supports the continued weakness in the technical outlook. In particular, the tenkan level’s sharp downward trend indicates that the short-term trend is entirely under sellers’ control. As long as this structure remains intact, the likelihood of rebound buying leading to a sustained reversal remains low.
On the macro front, the speech by US Federal Reserve Chair Jerome Powell later today holds critical importance. A hawkish tone and messages emphasizing tight monetary policy could trigger a deeper correction in BTC prices. In such a scenario, the $110,936 level serves as the key support, and a break below this level could lead to further declines. On the other hand, if the speech is dovish and includes statements supporting expectations of interest rate cuts, the price could retest the $114,761 level. A sustained break above this level could enable the market to initiate a new uptrend in the short term.
When technical, on-chain, and macroeconomic indicators are evaluated together, it appears that BTC is at a critical decision point. For the price to hold at current levels, selling pressure on the spot side needs to ease and liquidity outflows need to slow down. Otherwise, downside risks are expected to continue to come to the fore and volatility is expected to increase.
Support levels: 111,949 – 110,936 – 107,886
Resistance levels: 114,761 – 117,329 – 119,474
ETH/USDT
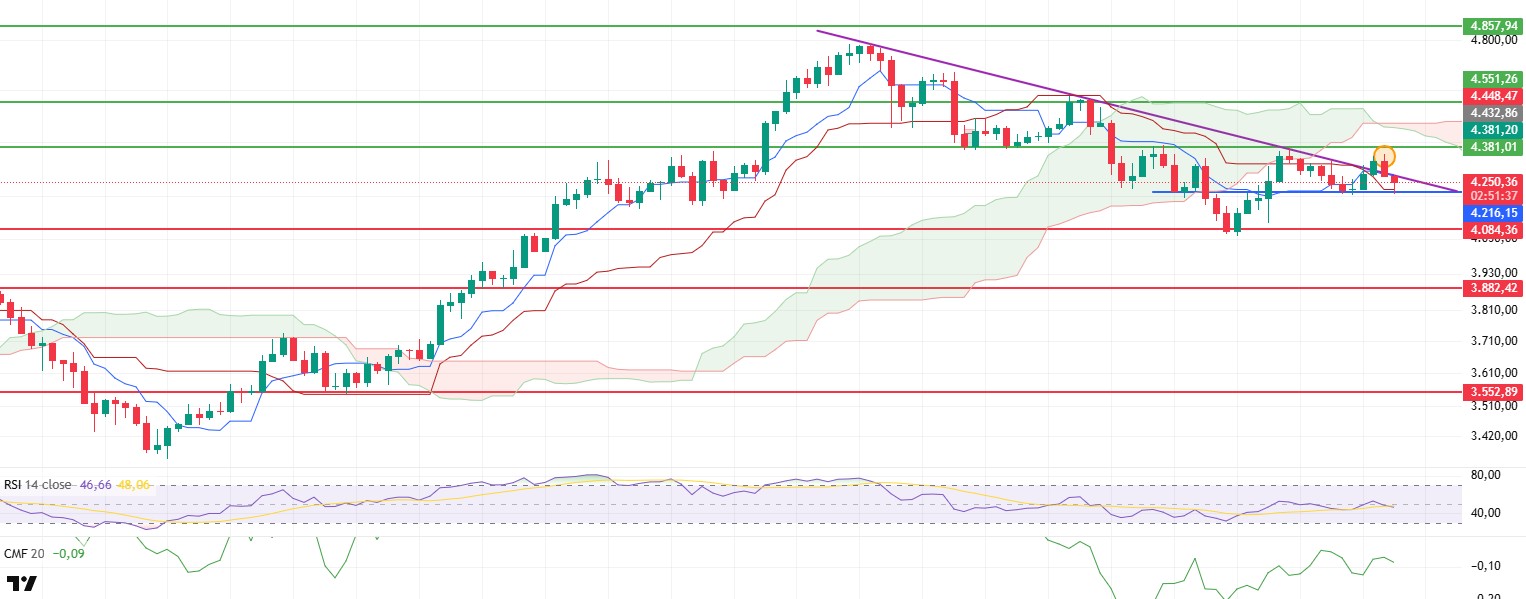
The ETH price managed to break above the falling trend line shown in purple on the chart during the day, but it failed to hold above this level and moved back down, forming a technical fakeout in the process. Subsequently, with increasing selling pressure, the price fell to the $4,216 support level and is currently attempting to hold in this area. However, due to continued strong institutional interest, ETH is maintaining its relative strength against BTC and continues to gain value.
When technical indicators and on-chain data are evaluated together, the rapid decline in open interest and the weak picture painted by the Cumulative Volume Delta (CVD) indicator on the futures side are noteworthy. However, the strong buying appetite in spot markets is contributing to the price stabilizing at these levels and limiting deeper declines for now. This structure indicates that the market remains vulnerable to sharp two-way movements as it tests critical levels in the short term.
The Chaikin Money Flow (CMF) indicator remaining in negative territory indicates that liquidity outflows continue across the market. However, despite the downward movement, the CMF value maintaining a flat appearance suggests that limited liquidity inflows persist on the spot side, supporting the price’s efforts to hold at these levels.
When examining the Ichimoku indicator, it can be seen that the tenkan level has crossed above the kijun level, generating a short-term buy signal. However, the price’s failure to break above the tenkan level indicates that this signal has not yet been confirmed. This situation highlights that the market is at a critical decision point and requires additional confirmation to determine the direction of the short-term trend.
The ETH price is currently stuck in a very narrow technical range, and a breakout from this structure could lead to significant price movements. Considering the positive picture in on-chain data, if the price rises above the blue trend line and breaks through the $4,381 level, a strong upward momentum could form, and prices could rise above the $4,600 level. On the other hand, if the $4,216 support level is broken, selling pressure could regain strength, and the price could drop to the $4,084 level. In this structure, where the $4,084 level retains its importance as the main support, a breach of this level could pave the way for more severe and deeper declines.
The overall outlook, based on a combination of technical and on-chain data, indicates that ETH is moving at a critical threshold. While buying appetite in spot markets supports price stability, weakening futures indicators should be monitored closely. Therefore, upcoming breakouts in the coming period will clearly determine the direction and momentum of price movements.
Support levels: 4,084 – 3,882 – 3,552
Resistance levels: 4,277 – 4,381 – 4,551
XRP/USDT
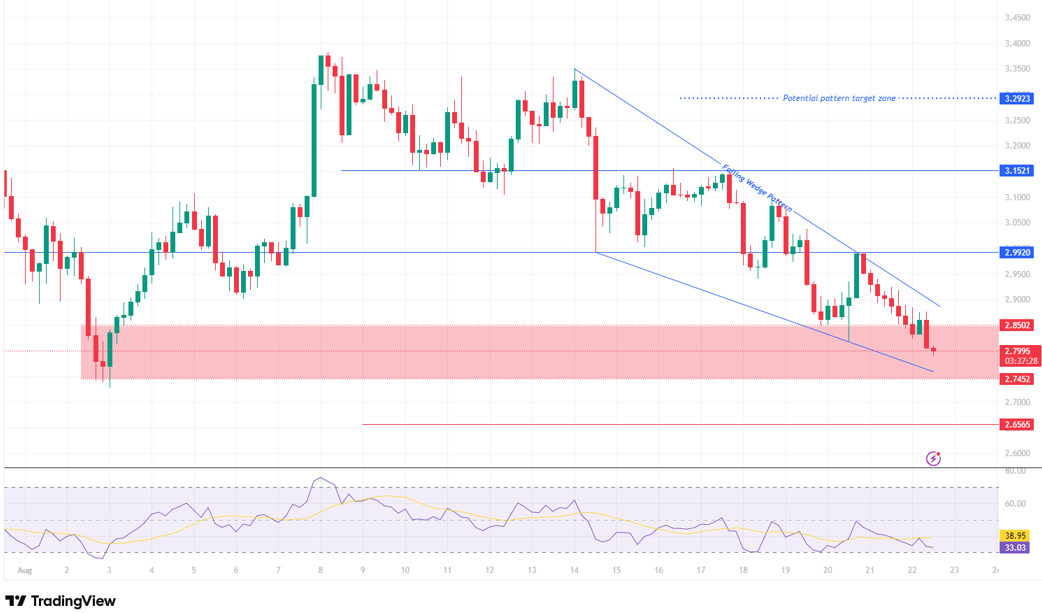
XRP is currently showing a weak appearance at the 2.89 level. It encountered selling pressure at the upper band of the formation and retreated to the 2.80 dollar band. In the current situation, we see that the upward reactions are insufficient and the price remains weak in reaching the formation resistance again. Therefore, sellers continue to dominate in the short term. We can say that the 2.99–3.00 band remains a critical threshold in terms of direction confirmation.
In a downward scenario, the current red zone (2.85–2.74) retains its importance. We are not seeing any developments that would support a potential upward movement in price at this time, and we are observing increased pressure from sellers. This range is a strong defense line as it coincides with both horizontal support and the lower trend line of the wedge. However, a sustained move below this level could bring a pullback towards the 2.6565 support level.
In the upward scenario, the price must break above the 2.99–3.00 band for a recovery. Unless there are closes above this region, the upward momentum may remain weak. If this breakout occurs, first 3.1521 and then the formation target zone of 3.29 could come into focus. On the Relative Strength Index (RSI) side, momentum remains weak compared to yesterday’s analysis, and a move above the 45–50 band is needed to signal a recovery. In short, the critical threshold for XRP remains unchanged. The 2.85–2.74 range below and the 2.99–3.00 band above continue to be the main levels that will determine the price direction.
Support levels: 2.8502 – 2.7452 – 2.6565
Resistance levels: 2.9920 – 3.1521 – 3.2923
SOL/USDT
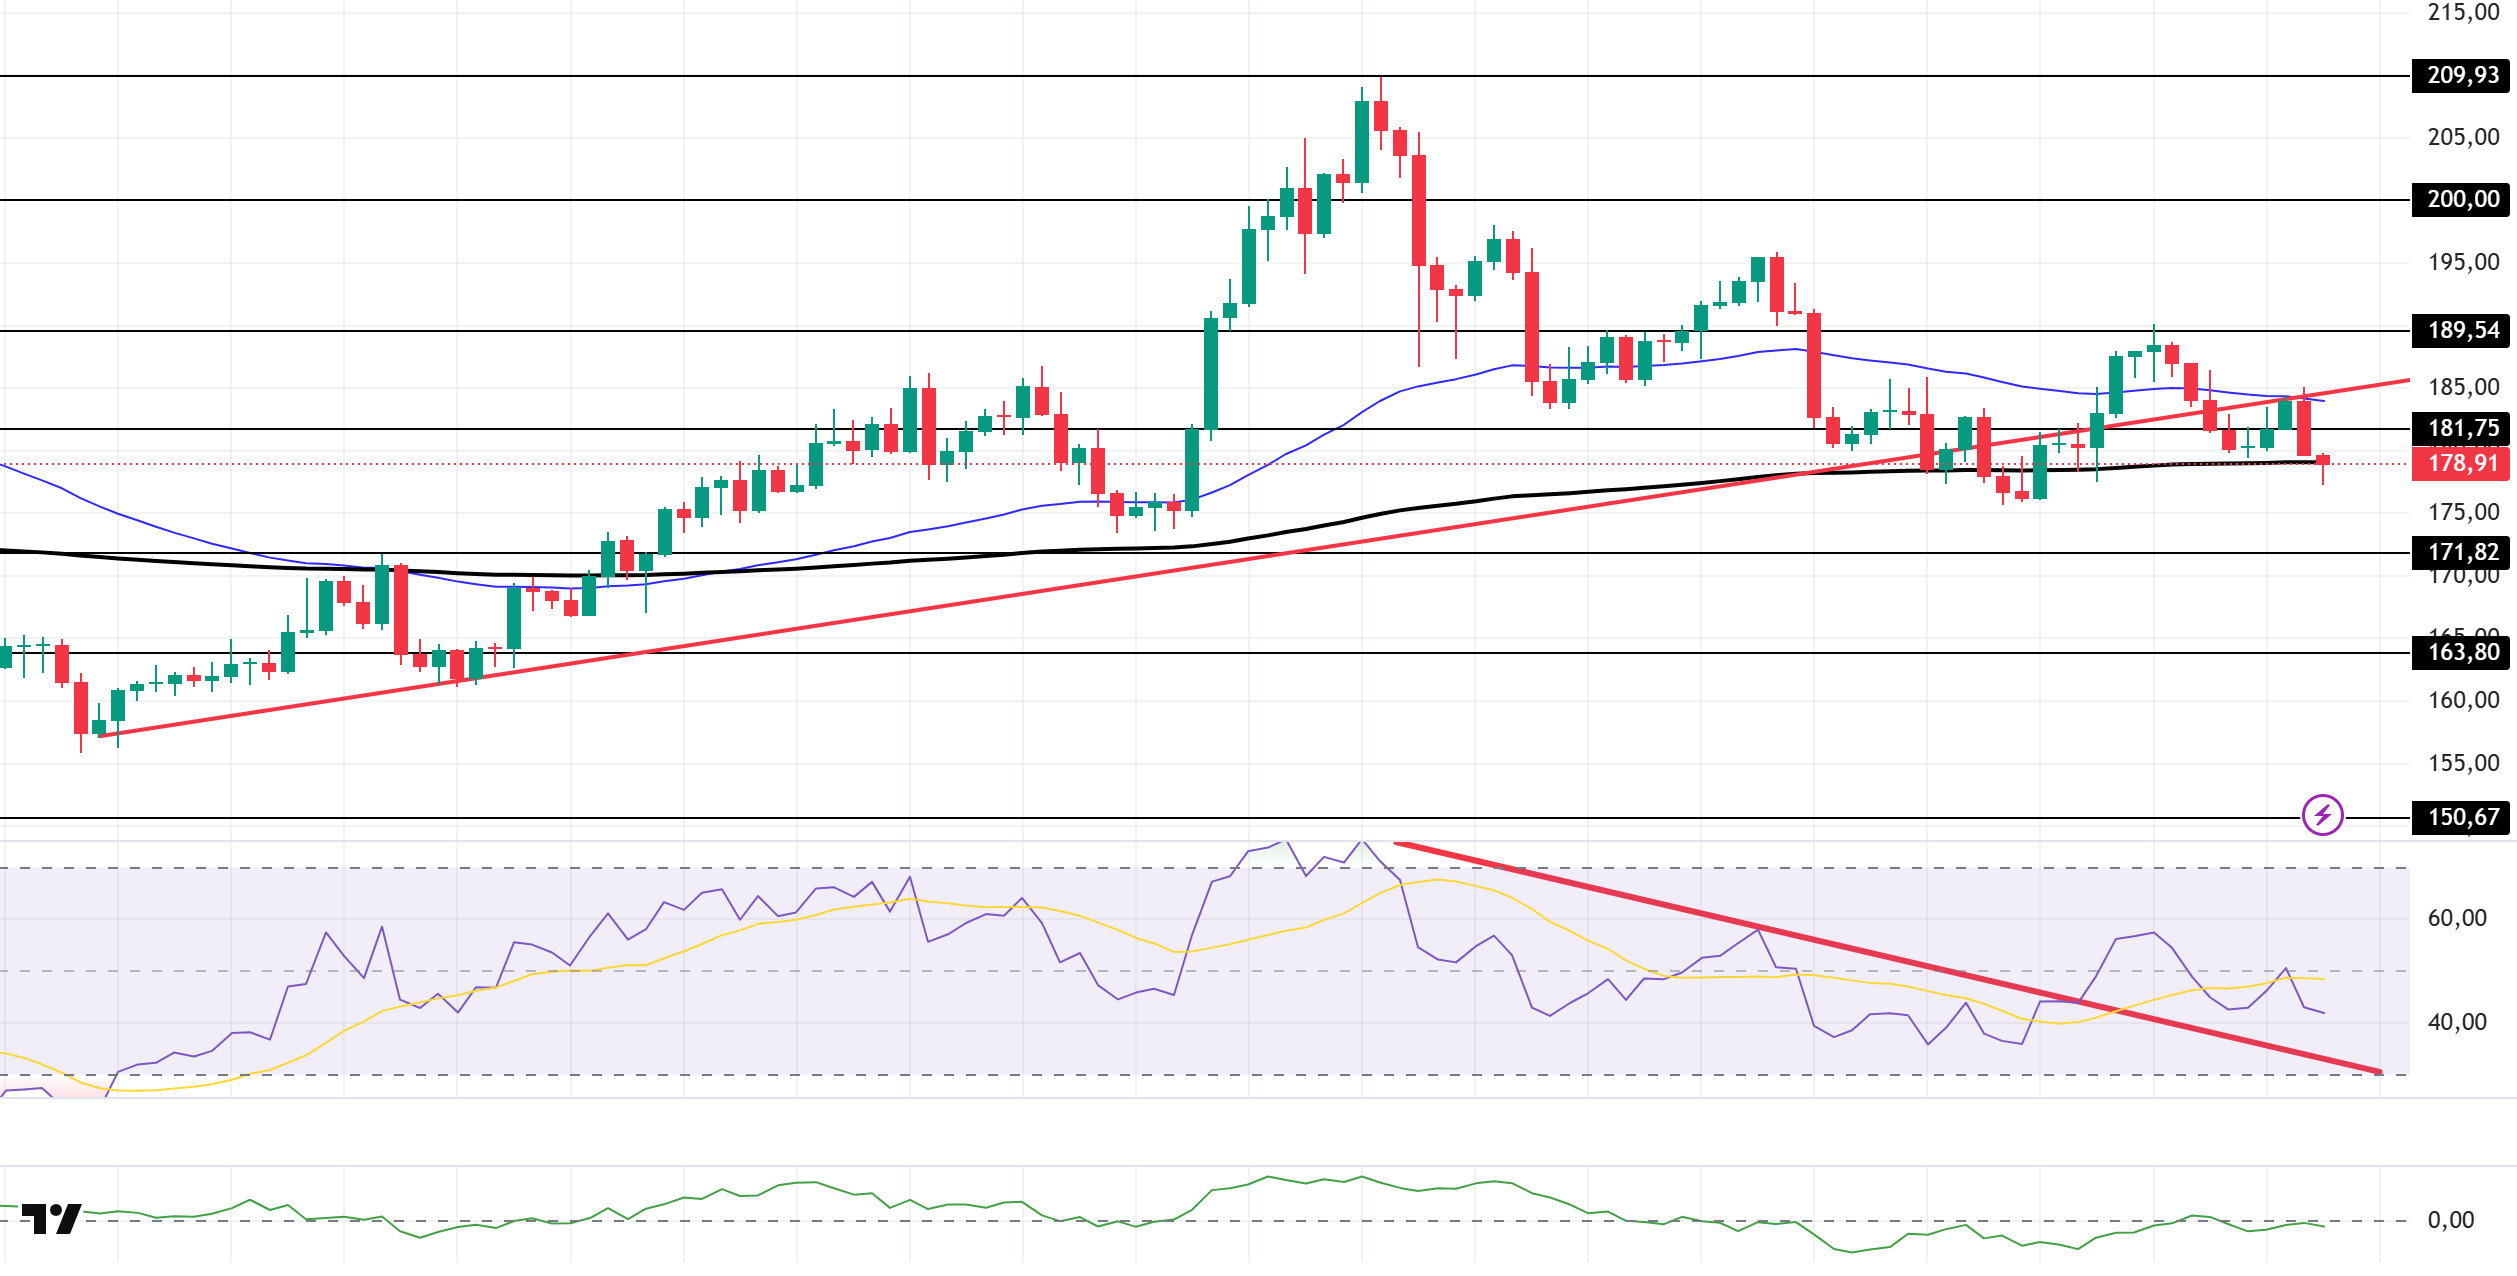
The SOL price experienced a decline during the day. The asset tested the 50 EMA (Exponential Moving Average – Blue Line) moving average and the upward trend that began on August 2 as resistance but failed to break through and retreated. As of now, it is testing the 200 EMA (Black Line) moving average as support. The 171.82 dollar level should be monitored in case of a candle close below this level.
On the 4-hour chart, the 50 EMA remains above the 200 EMA. This indicates that the upward trend may continue in the medium term. Additionally, the price being between the two moving averages suggests that the market is in a decision phase in the short term. The Chaikin Money Flow (CMF-20) has dropped below the negative level. A further decline in money inflows could push the CMF deeper into the negative zone. The Relative Strength Index (RSI-14) remained above the downward trend that began on August 14, but its decline into the negative zone indicates an increase in selling pressure. In the event of an upward movement driven by macroeconomic data or positive news related to the Solana ecosystem, the $189.54 level emerges as a strong resistance point. If this level is broken upward, the upward trend is expected to continue. In case of pullbacks due to developments in the opposite direction or profit-taking, the $171.82 level could be tested. A decline to these support levels could increase buying momentum, presenting a potential opportunity for an upward move.
Support levels: 171.82 – 163.80 – 150.67
Resistance levels: 181.75 – 189.54 – 200.00
DOGE/USDT
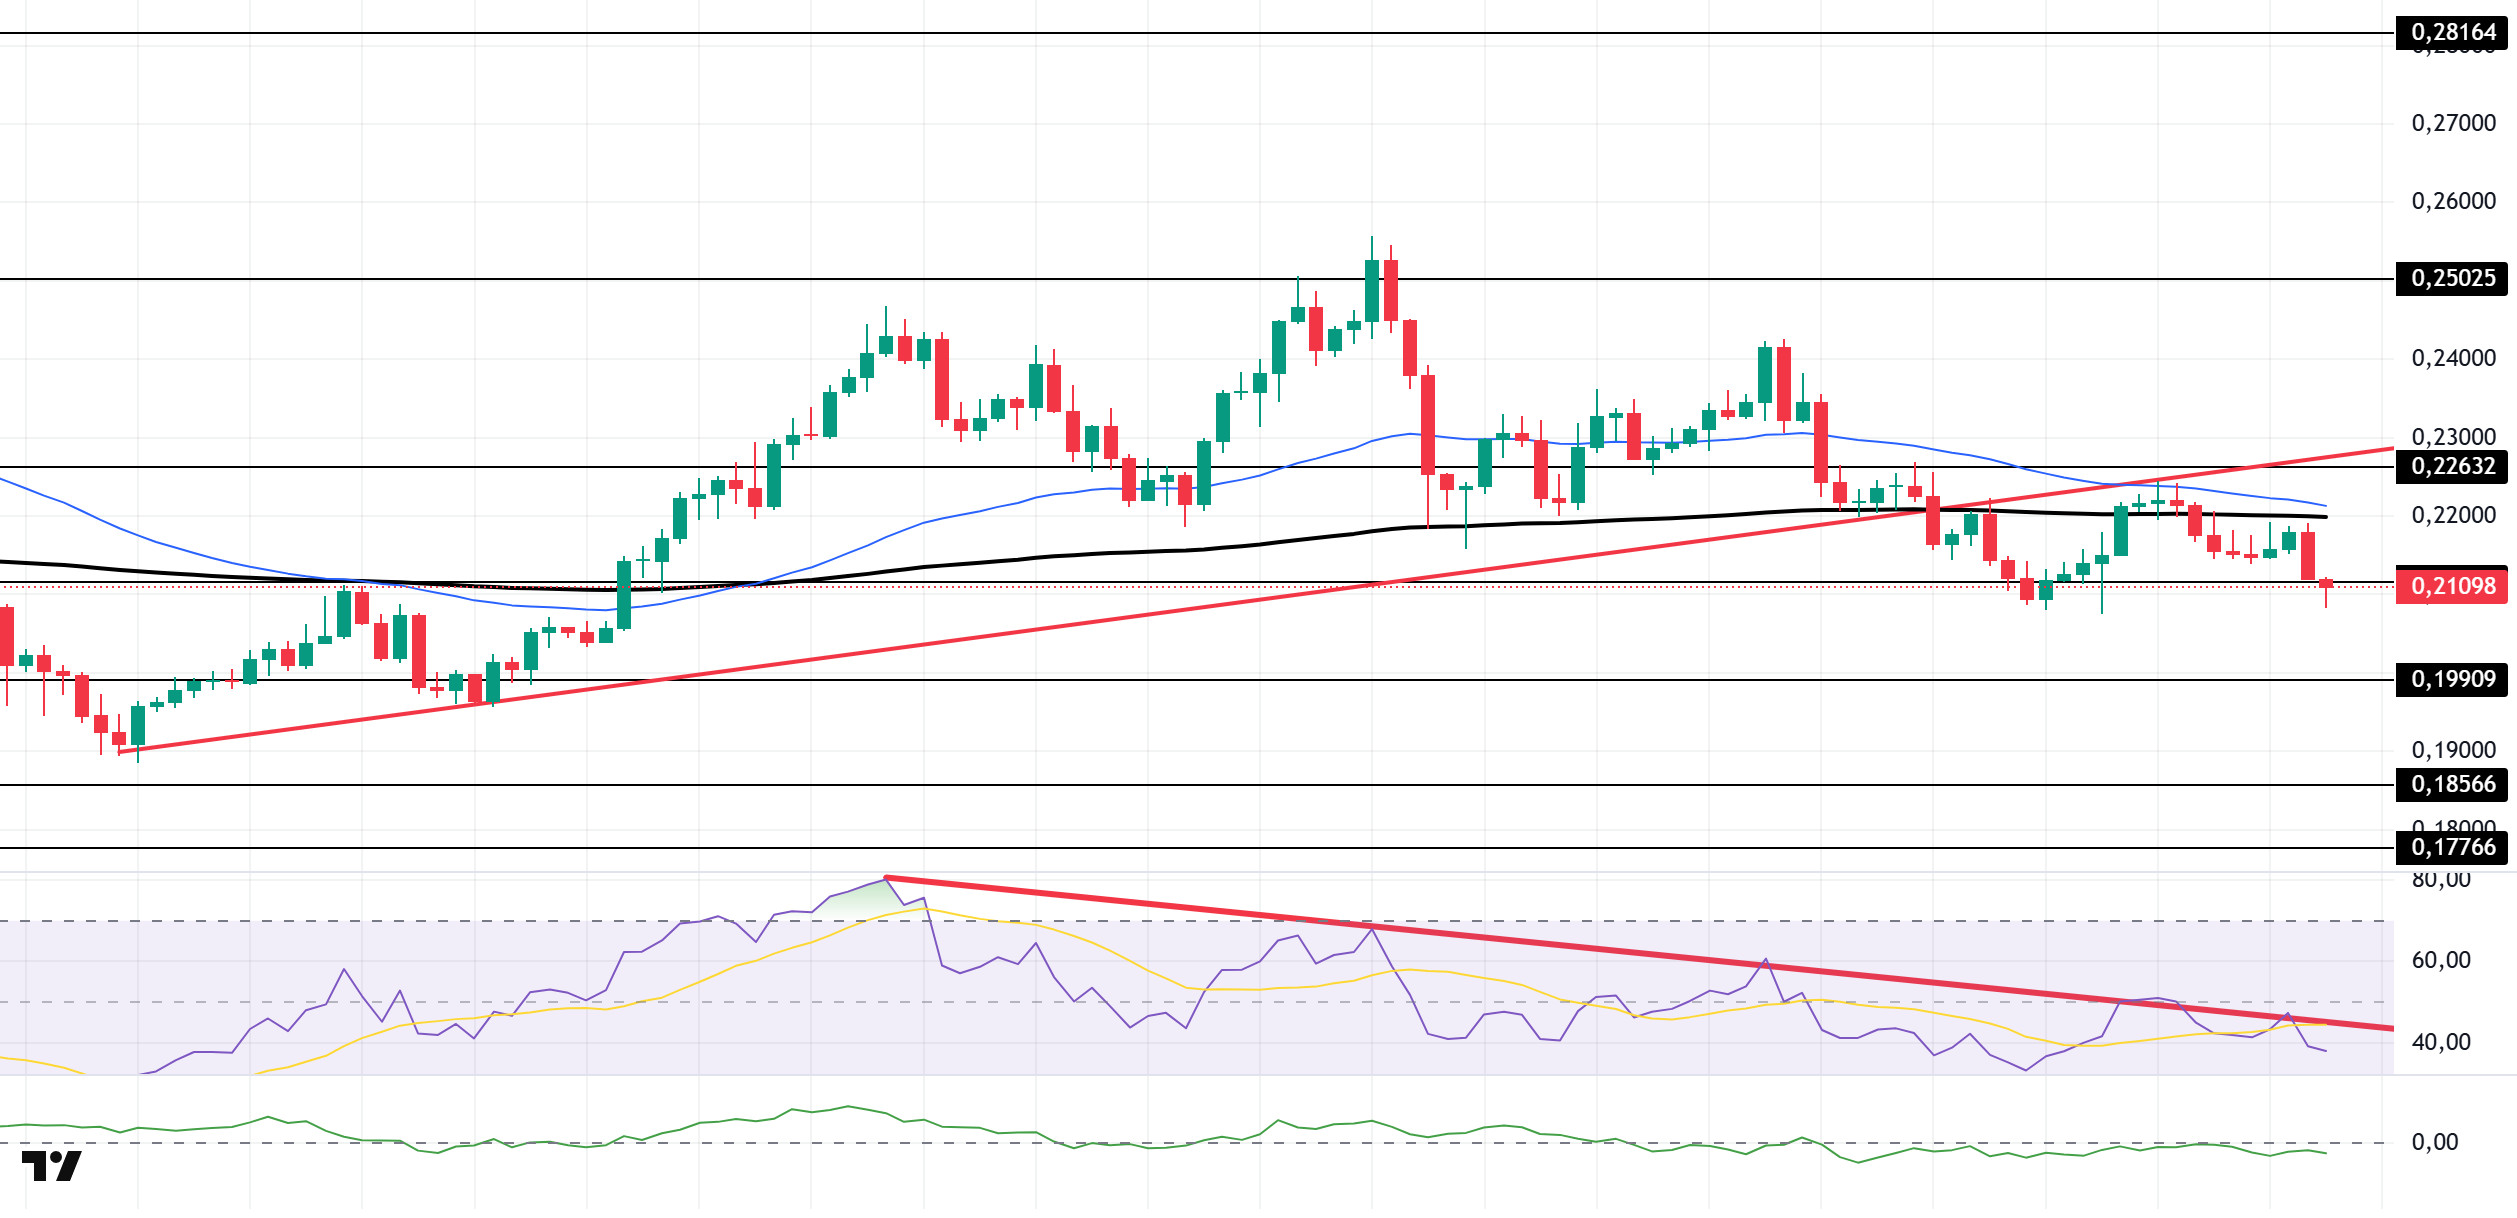
The DOGE price showed a downward trend during the day. The asset continued to trade below the upward trend that began on August 2. This could keep the selling pressure going. The price, which is facing resistance from the 200 EMA (Exponential Moving Average – Black Line), is currently testing the strong support level of $0.21154. If the price closes below this level, the $0.19909 level should be monitored. In an upward scenario, the 0.22632 dollar level should be monitored.
On the 4-hour chart, the 50 EMA (blue line) continues to remain above the 200 EMA. This indicates that the asset is in an upward trend in the medium term. The price being below both moving averages indicates that the asset is also in a downward trend in the short term. Chaikin Money Flow (CMF-20) has fallen back into negative territory. Additionally, a decrease in capital inflows could push the CMF further into the negative zone. The Relative Strength Index (RSI-14) remains in the negative zone. At the same time, it tested the resistance level of the downward trend that began on August 9 but failed to break through, losing momentum and increasing selling pressure. In the event of an upward movement driven by political developments, macroeconomic data, or positive news flow within the DOGE ecosystem, the $0.22632 level emerges as a strong resistance zone. In the opposite scenario or in the event of negative news flow, the 0.19909 dollar level could be triggered. A decline to these levels could lead to increased momentum, potentially initiating a new upward wave.
Support levels: 0.19909 – 0.18566 – 0.17766
Resistance levels: 0.21154 – 0.22632 – 0.25025
LINK/USDT
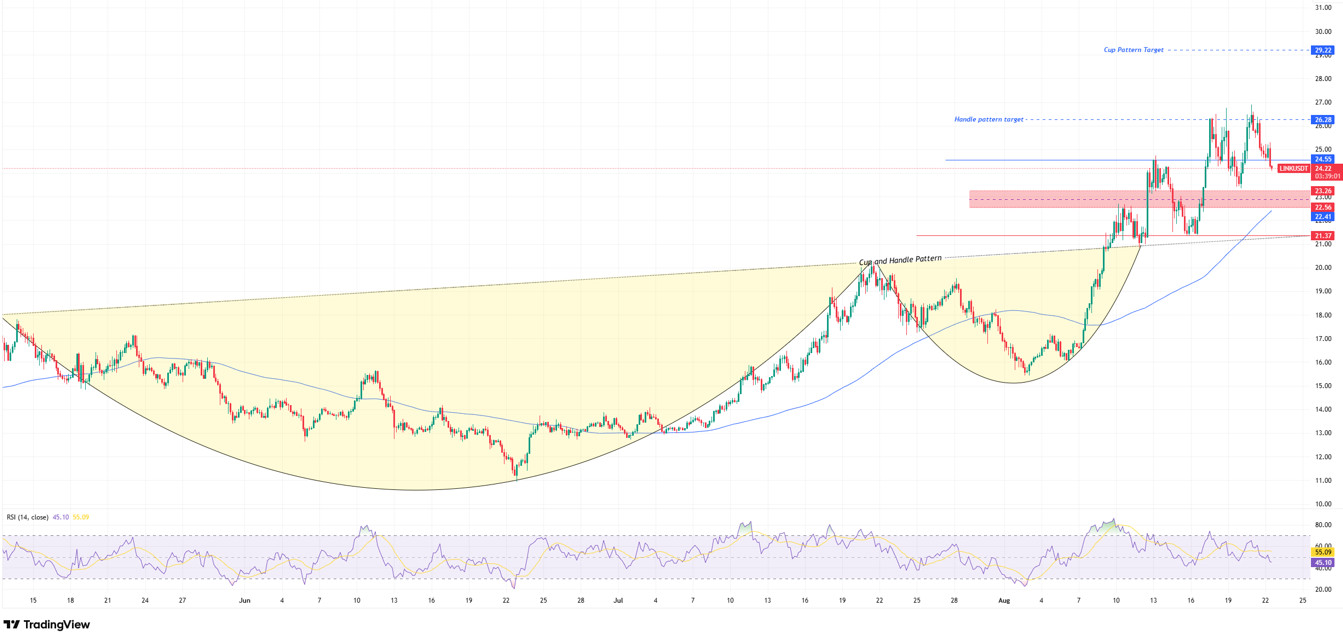
LINK has broken below the critical $24.55 level we mentioned in our previous analysis. In the current outlook, the next demand zone will be the 23.26 – 22.56 region. This region is also significant as it aligns with the Fibonacci 0.786 retracement level of the upward movement that began on August 16 and our 100-day moving average (SMA100). The demand the price encounters in this region could support an upward movement.
In such a movement, our first resistance point is the previous support level of $24.55. However, the most critical resistance line that must be crossed for a strong upward movement and the cup formation target to be realized is the $26.28 band, which the price has tested but failed to break through in the last 5 days.
In the opposite scenario, the loss of both the 0.786 region and the SMA100 level could increase selling pressure and pull the price down to the horizontal support and trend support levels at $21.37. In the medium to long term, as long as the $21.37 level is maintained, our trend will support upward movement.
On the indicator side, the Relative Strength Index (RSI) is at the 45 level and in the negative zone. This indicates that selling pressure may continue. For the upward momentum to gain strength, it is important for the RSI to rise above 60 and hold at this level.
Support levels: 23.26 – 22.56 – 21.37
Resistance levels: 24.55 – 26.28 – 29.22
ADA/USDT
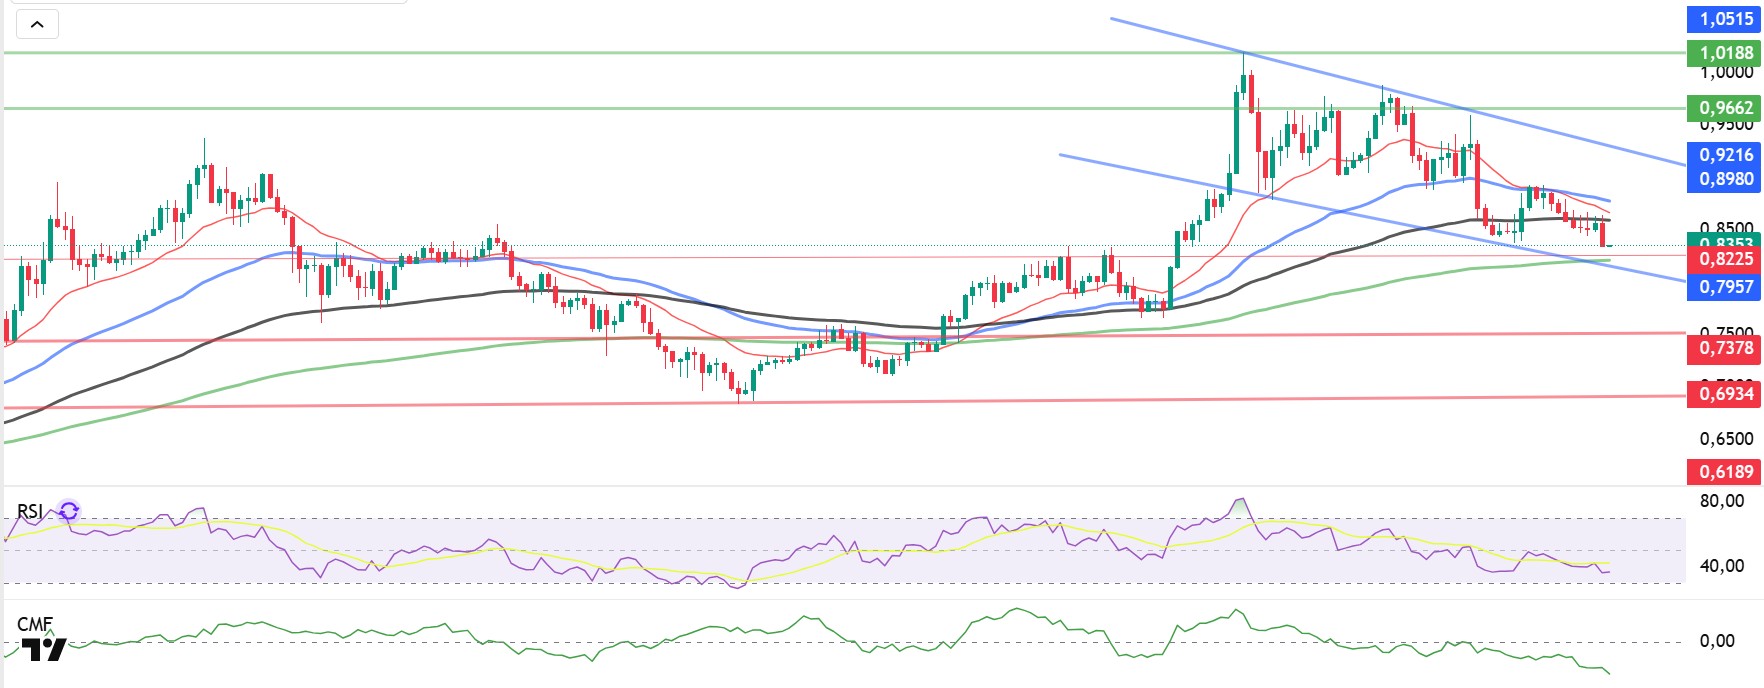
ADA price maintained its bearish trend ahead of the Fed’s speech this evening and failed to hold above the 100-day Exponential Moving Average (EMA-Black Line) during the day. It broke below the support level of 0.8225. The next retest zone is the critical area around the 200-day Exponential Moving Average (EMA-Green Line) at 0.8208. If the FED’s statements take a hawkish tone or fail to provide clear signals, the price may fail to break through the retest zone and drop below the downtrend line. If the FED’s speech this evening is dovish, we may see an increase in cryptocurrencies. In this case, the price may close above the 100-day EMA, and if it reaches this level, it may test the 0.8980 level again. If the price breaks above the descending channel on the 4-hour chart, it is expected to maintain its position above the 0.9662 level. The Relative Strength Index (RSI-14) has dropped to the 32 level and continues to move in the sell zone, while the Chaikin Money Flow (CMF-20) has fallen to the -0.35 level, confirming the downtrend signal. The decline in capital inflows may keep the CMF in the sell zone and exert a downward pressure on prices. In the event of positive macroeconomic data or news related to the Cardano ecosystem, the 1.0188 dollar level could emerge as a strong resistance point. In the event of a decline, the 0.8225 level will be the key support level to monitor.
Support levels: 0.8208 – 0.7378 – 0.6934
Resistance Levels: 1.0515 – 1.0188 – 0.9662
Legal Notice
The investment information, comments, and recommendations contained herein do not constitute investment advice. Investment advisory services are provided individually by authorized institutions taking into account the risk and return preferences of individuals. The comments and recommendations contained herein are of a general nature. These recommendations may not be suitable for your financial situation and risk and return preferences. Therefore, making an investment decision based solely on the information contained herein may not produce results in line with your expectations.

