
TECHNICAL ANALYSIS
BTC/USDT
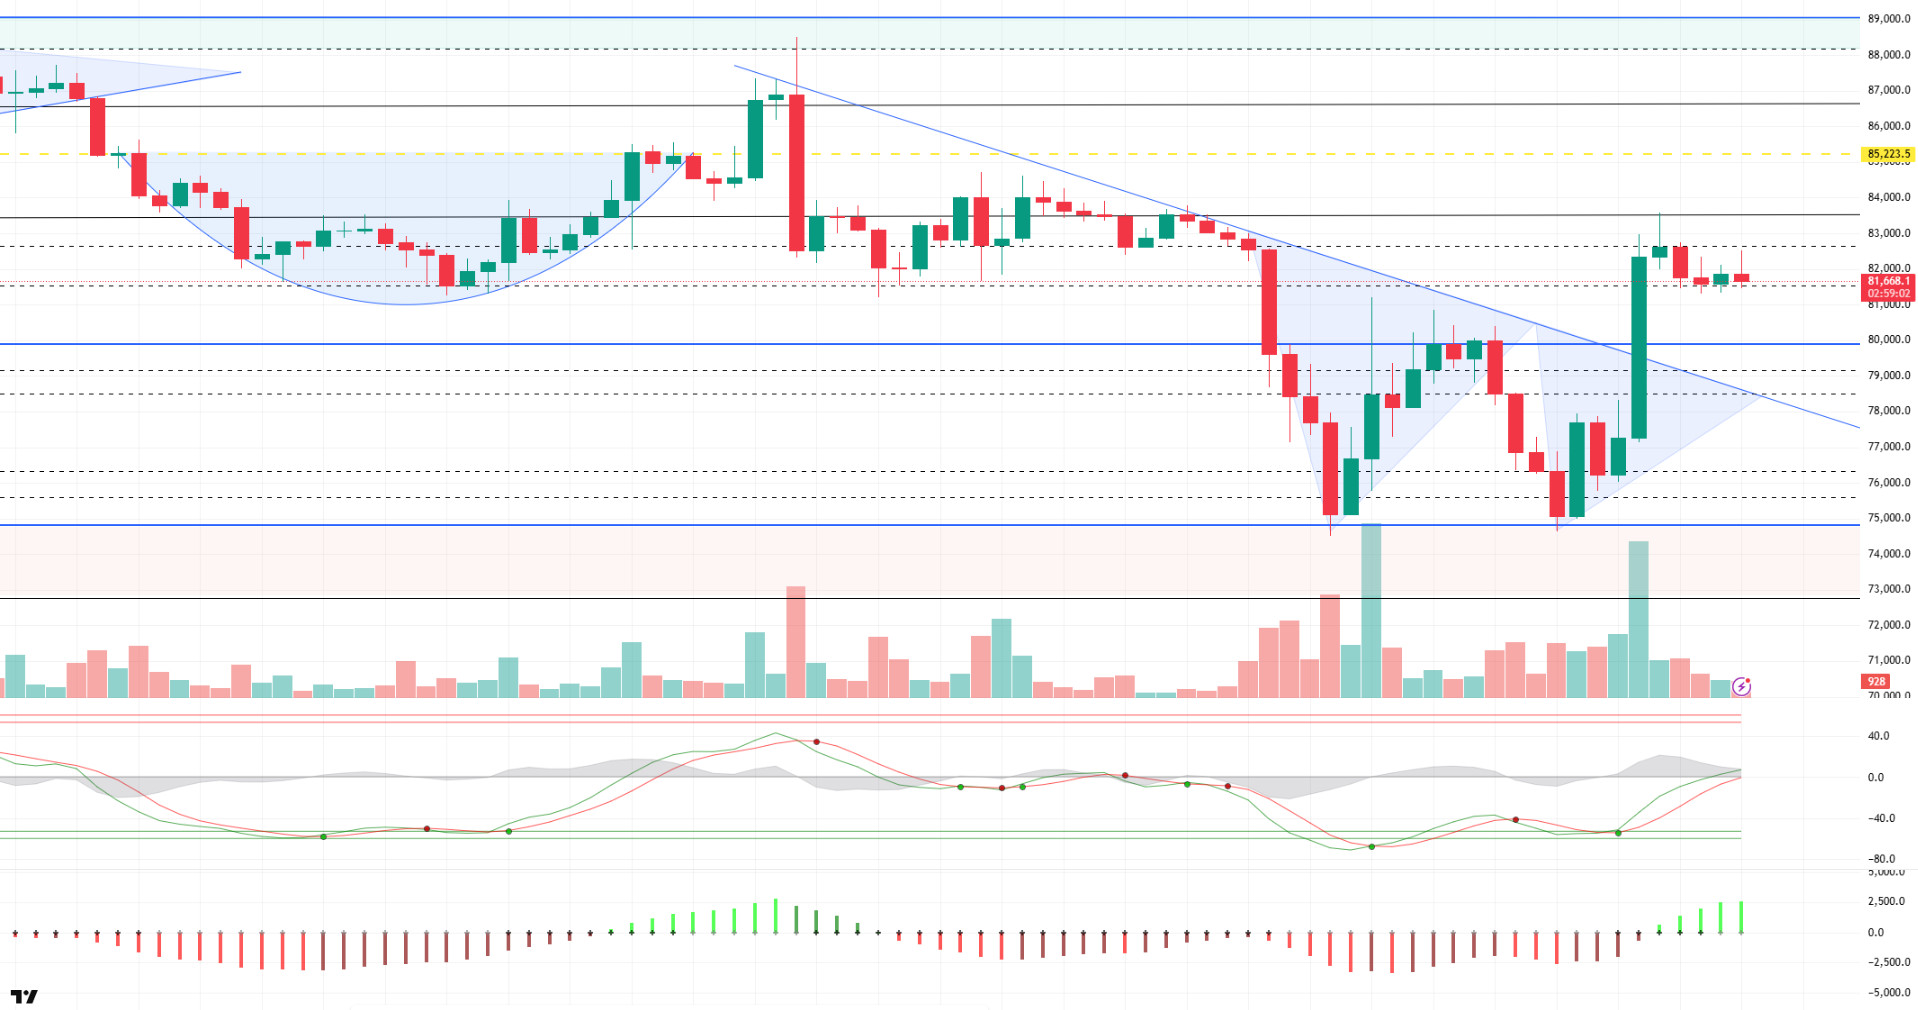
While data on the macro front offered a supportive outlook for crypto markets in the short term, volatility expectations are increasing. US Consumer Price Index (CPI) came in at 2.4% yoy, below expectations (2.5%), indicating that some inflationary pressures have eased. Unemployment claims came in at 223K, in line with market forecasts. These data reinforced expectations that the Fed may create room for a rate cut timetable.
When we look at the technical outlook, it is seen that the BTC price exhibits low volatility despite the incoming data compared to the previous analysis. BTC, which briefly rose as high as 82,500, was unable to maintain these gains and retreated and is trading at 81,600 at the time of writing. When the Wave Trend Oscillator is analyzed, it is noteworthy that the buy signal has started to weaken, and the price is stuck in a narrow band range. This outlook suggests that the market is indecisive and in search of direction. Technically, there is a possibility that the current price action could form a flag pattern. If this scenario is confirmed, if the price breaks to the upside, it may be possible to target the area where short positions are concentrated at the 85,000 level. On the other hand, in a possible selling pressure, the 80,000 level stands out as both a technical and psychological support point. Closures above this level strengthen the possibility of upward movement by preventing downward pressure on the price, while the price brings selling pressure if it sags below it. In summary, in the current structure where BTC is stuck in a narrow range, both the formation of technical patterns and the support strength above the 80,000 level should be closely monitored in terms of price movements. These two scenarios will be decisive for determining the direction in the short term.
Supports 81,500 – 80,000 – 78,500
Resistances 83,500 – 85,200 – 86,600
ETH/USDT
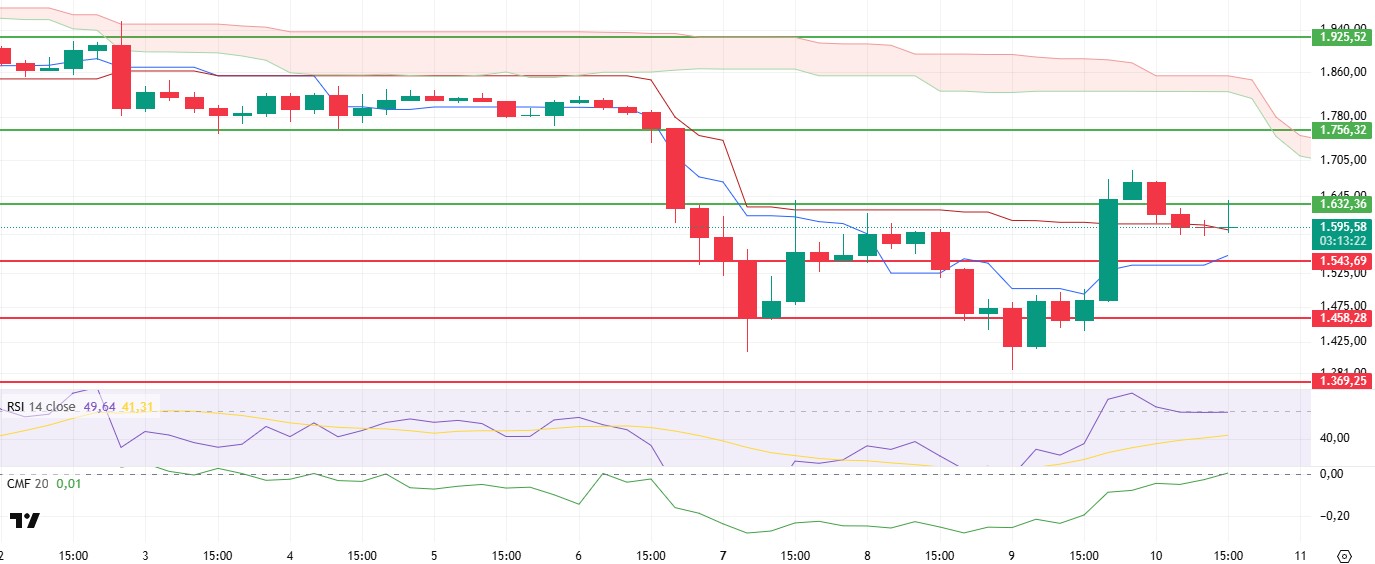
ETH followed a horizontal course at the kijun level during the day. The Consumer Price Index data from the US fell below expectations, increasing the risk appetite in the markets and paving the way for ETH to retest the important resistance point at $1,632. However, increased selling pressure at this level caused the price to retreat back towards the kijun level. This move indicates that profit realizations have come into play in the market and the buying momentum has weakened in the short term.
When technical indicators and on-chain data are evaluated together, some noteworthy developments in market dynamics stand out after yesterday’s rally. First of all, funding fee turned negative again and open interest declined in line with this, indicating that long positions were closed and risk appetite in derivatives markets decreased. On the other hand, Cumulative Volume Delta (CVD) data shows that buy orders continue to strengthen, especially in spot markets. This indicates that spot demand-driven buying pressure continues. A positive picture is also seen on the liquidity side. The Chaikin Money Flow (CMF) indicator moved into positive territory and continued to rise, indicating that net capital inflows to the market increased and the buy side took control. The Relative Strength Index (RSI) indicator, on the other hand, remained flat after yesterday’s rise, reflecting that the current momentum has stabilized, and the market is in a decision phase.
In light of this data, if the price continues to stay above the kijun level, it is likely that the $1,632 level will be breached again in the evening. A sustained break above this level could push the price towards the $1,700 and $1,756 resistance zones respectively. However, a downside breaks of the kijun level, coupled with a possible US session volatility, could lead the price to retreat to the $1,543 support level. In the short term, continued spot buying power and positive on-chain signals support the upside scenario, but whether the kijun level can be maintained will be decisive in determining the direction.
Supports 1,543 – 1,458 – 1,369
Resistances 1,632 – 1,756 – 1,925
XRP/USDT
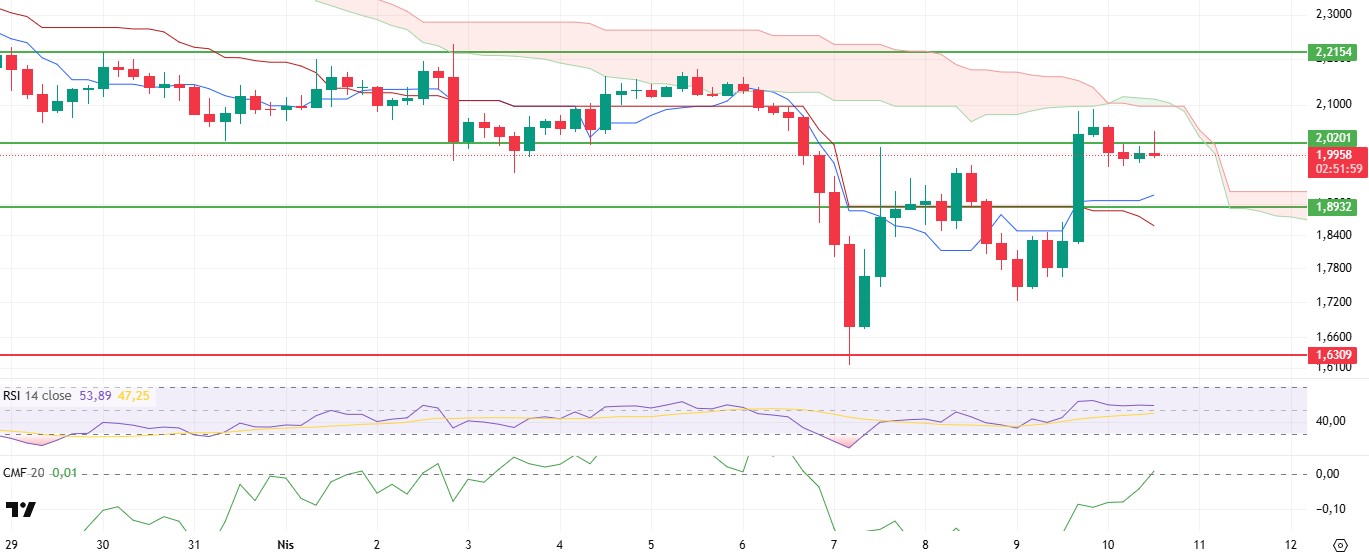
Although XRP tried to break the $2.02 level upwards once again during the day, it experienced a slight retracement, encountering sharp sales from this region. However, despite the price pullback, the positive outlook in technical indicators continues to be maintained, indicating that the fundamental dynamics of the bullish trend have not yet been disrupted.
The Chaikin Money Flow (CMF) indicator crossed into positive territory, indicating that liquidity flows to the market have strengthened and the buy side has regained its weight. This suggests that bullish potential is still alive, and pullbacks may remain limited. Looking at the Ichimoku indicator, it is seen that the buy signal formed by the tenkan line crossing the kijun line upwards remains valid and the tenkan line continues its upward trend. This supports that the price tends to move upwards by taking strength from short-term supports. At the same time, the horizontal appearance of the Ichimoku cloud suggests that the market is searching for direction within a certain equilibrium, but the current trend remains upward.
In the light of all these technical data, if the $2.02 level is permanently exceeded, it can be expected that the uptrend in XRP will continue, and new resistance levels will be tested. However, in a possible risk scenario, the selling pressure that will increase throughout the market, especially with the impact of negative developments in the US stock markets, may cause XRP to retreat to the support level of $ 1.89.
Supports 1.8932 – 1.6309 – 1.4264
Resistances 2.0201 – 2.2154 – 2.4492
SOL/USDT
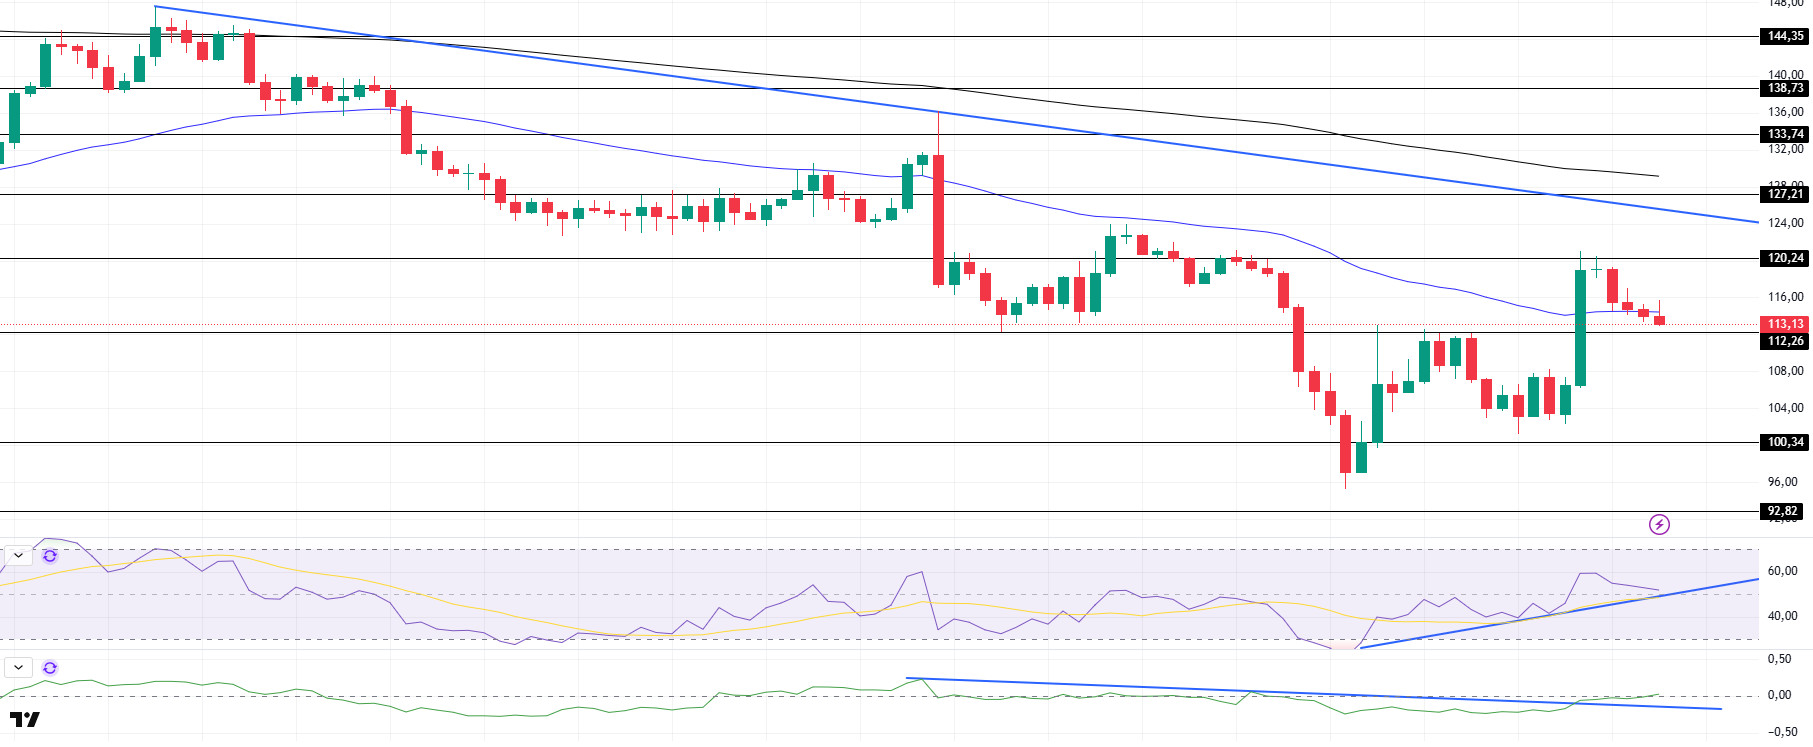
SEC accepts Fidelity Solana Fund application. KAST launched the first M^0 Stablecoin on Solana. Onchain, blockchain-based transaction tracker Whale Alert reported that a crypto whale moved 1,030,000 SOLs worth $110.29 million from a centralized exchange.
SOL has been slightly bearish since our analysis in the morning. The asset is down about 4% after testing the strong resistance level of $120.24. It is currently testing the moving average of 50 EMA (Blue Line) as support. If the upside momentum continues, it may test the downtrend that started on March 25 as resistance. On the 4-hour timeframe, the 50 EMA (Blue Line) remained below the 200 EMA (Black Line). This could continue the decline in the medium term. At the same time, the price started to move between two moving averages. This shows us that the market is in the decision phase. When we examine the Chaikin Money Flow (CMF)20 indicator, it has moved into positive territory. However, the fact that the daily volume is also on the rise may enable CMF to reach the upper levels of the positive zone. On the other hand, CMF has broken the downtrend that started on April 2. However, Relative Strength Index (RSI)14 maintains the uptrend that started on April 7. This could push the price higher. The $120.24 level appears as a resistance point in the rises driven by the upcoming macroeconomic data and the news in the Solana ecosystem. If it breaks here, the rise may continue. In case of retracements for the opposite reasons or due to profit sales, the support level of 112.26 dollars can be triggered. If the price comes to these support levels, a potential bullish opportunity may arise if momentum increases.
Supports 112.26 – 100.34 – 92.82
Resistances 120.24 – 127.21 – 133.74
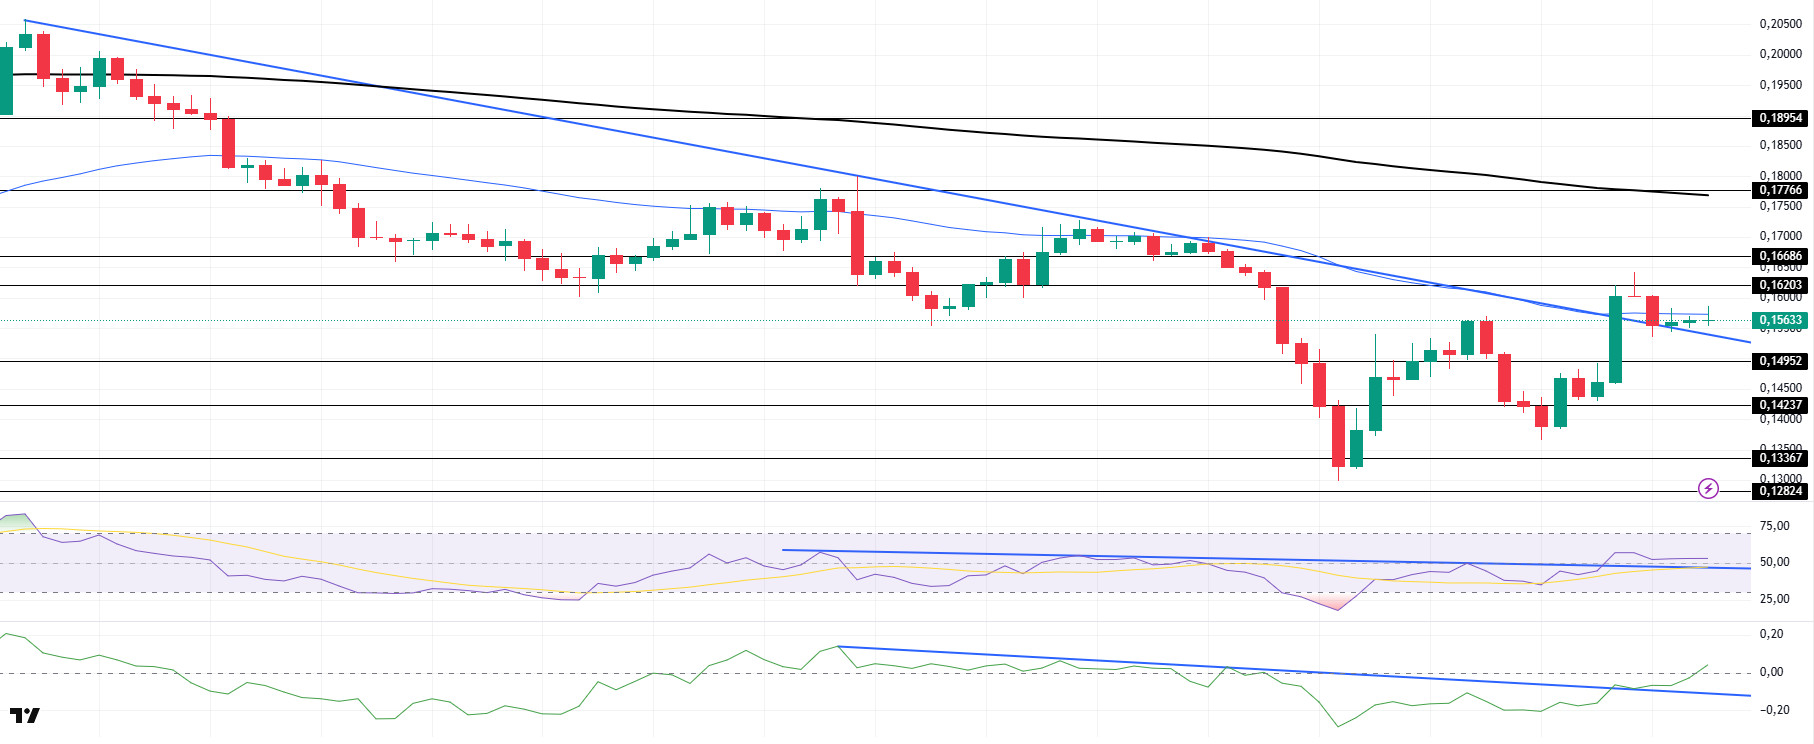
DOGE/USDT
DOGE moved sideways after our morning analysis. The asset turned from the resistance level at $0.16203 and started pricing below the 50 EMA moving average and is currently testing the 50 EMA moving average. Located between the downtrend and the 50 EMA (Blue Line), the price may retest the strong resistance at $0.16203 if the favorable market dynamics continue. On the 4-hour timeframe, the 50 EMA (Blue Line) remains below the 200 EMA (Black Line). This could mean that the decline could continue in the medium term. However, the price continues to price below the two moving averages. When we examine the Chaikin Money Flow (CMF)20 indicator, it has crossed into positive territory. In addition, the negative 24-hour volume may cause CMF to move back into negative territory. However, the downtrend in CMF has broken to the upside. This may continue the rise. On the other hand, Relative Strength Index (RSI)14 has broken the downtrend that started on April 1, as well as transitioning from the middle zone of the negative level to the positive zone. It may test this trend as support and continue its uptrend. The level of $ 0.16686 is a very strong resistance in the rises caused by political reasons, macroeconomic data and innovations in the DOGE coin . In case of possible retracements due to political, macroeconomic reasons or negativities in the ecosystem, the $ 0.14952 level, which is a strong support place, is an important support place. If the price reaches these support levels, a potential bullish opportunity may arise if momentum increases.
Supports 0.14952- 0.14237 – 013367
Resistances 0.16203 – 0.16686 – 0.17766
Legal Notice
The investment information, comments and recommendations contained herein do not constitute investment advice. Investment advisory services are provided individually by authorized institutions taking into account the risk and return preferences of individuals. The comments and recommendations contained herein are of a general nature. These recommendations may not be suitable for your financial situation and risk and return preferences. Therefore, making an investment decision based solely on the information contained herein may not produce results in line with your expectations.
