
TECHNICAL ANALYSIS
BTC/USDT
China raised its tariffs on US imports to 125% as of April 12, bringing trade tensions to a new level. On the European front, there is a more moderate approach; the EU announced that it has proposed a zero-to-zero tariff agreement with the US on all products. On the other hand, the March PPI data announced in the US remained below expectations (3.3%) with 2.7%, while this development was interpreted as the Fed could create room for an interest rate cut. On the crypto side, the bill presented in New York gave a positive signal for the sector by bringing the legalization of Bitcoin in government payments to the agenda.
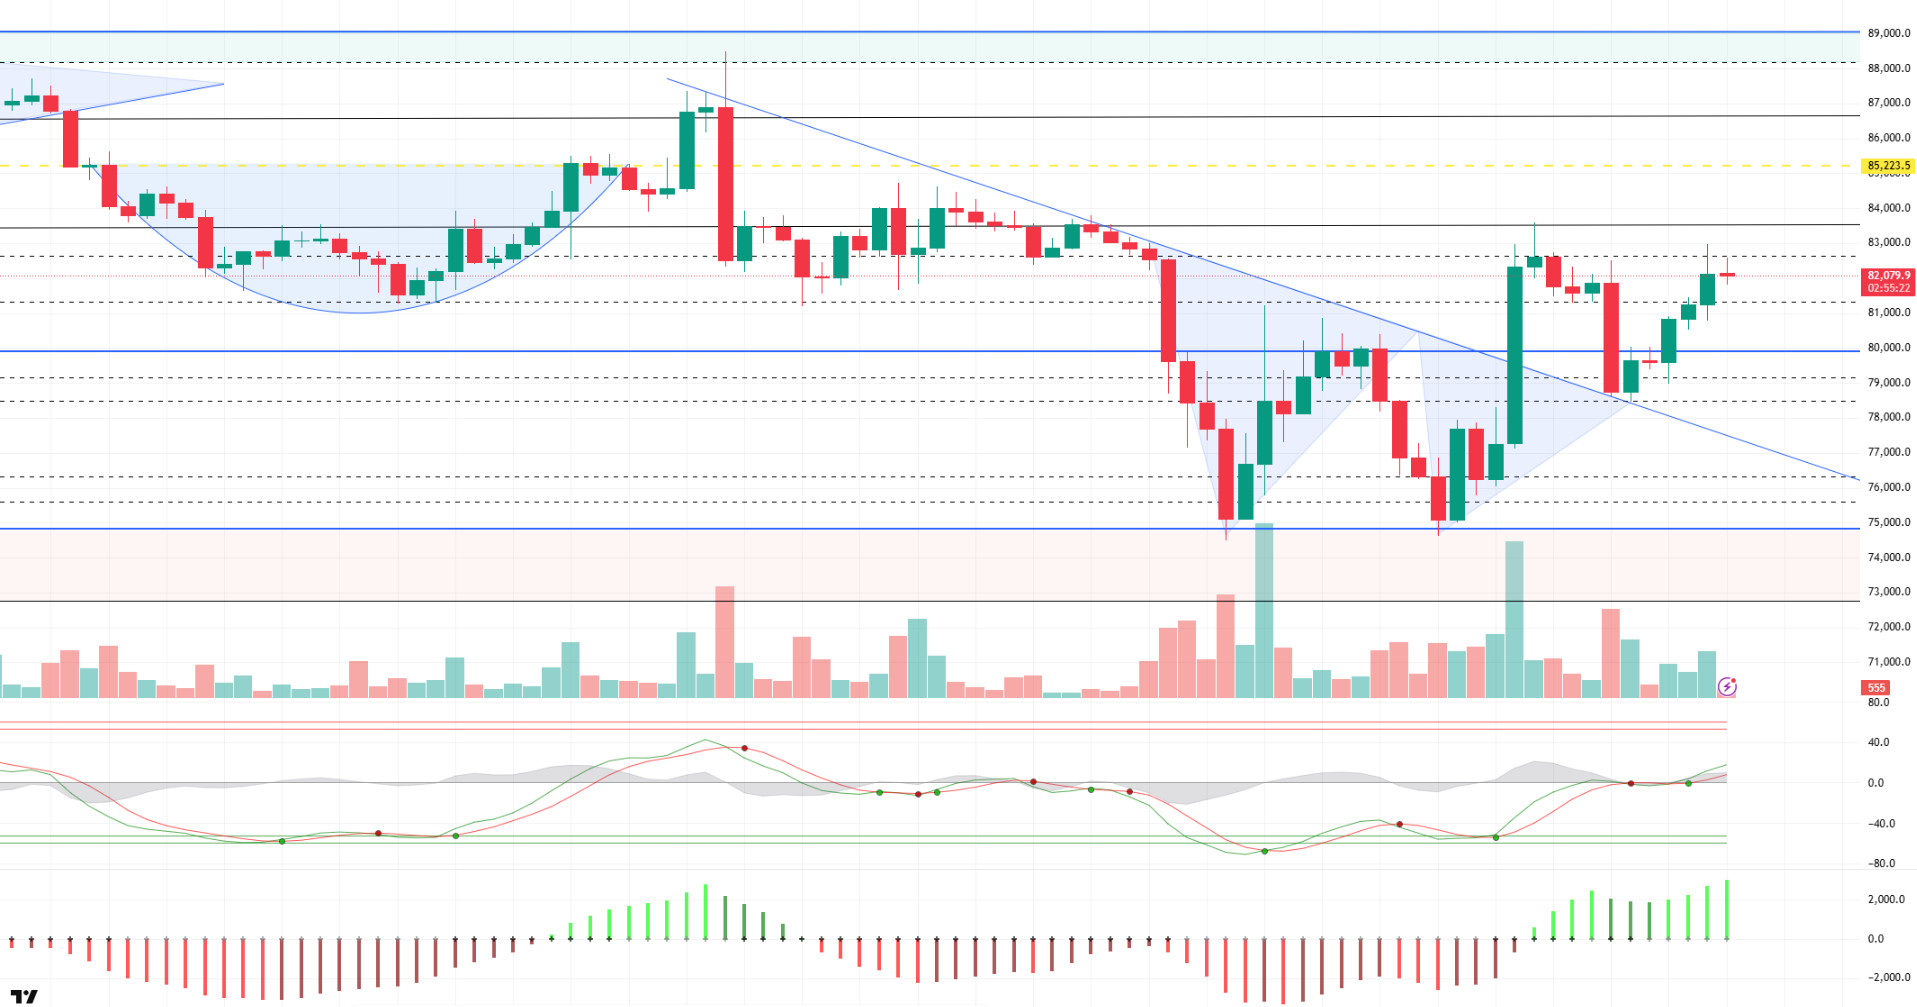
Looking at the technical outlook, BTC tested the 81,500-82,600 band during the day and managed to hold within this range. The price continues its upward movement by maintaining the uptrend that started at 74,600, which stands out as the second bottom. At the time of writing, BTC is trading at 82,000. On the technical indicators, the wave trend oscillator continues to maintain its buy signal, while momentum indicators are also showing an upward increase again. This indicates a positive technical structure in the short term. Looking at the liquidation data, as we mentioned before, short positions concentrated at the 85,000 level stand out. While this level technically stands out as the first target, it is also considered as a strong resistance zone. In the coming period, the focus of the market is largely on the statements that may come from the Trump front. In particular, messages on tariffs can have a direct impact on crypto markets and play a decisive role in the direction of BTC. In a possible selling pressure, the 80,000 level will continue to appear as a reference point.
Supports 81,500 – 80,000 – 78,500
Resistances 83,500 – 85,200 – 86,600
ETH/USDT
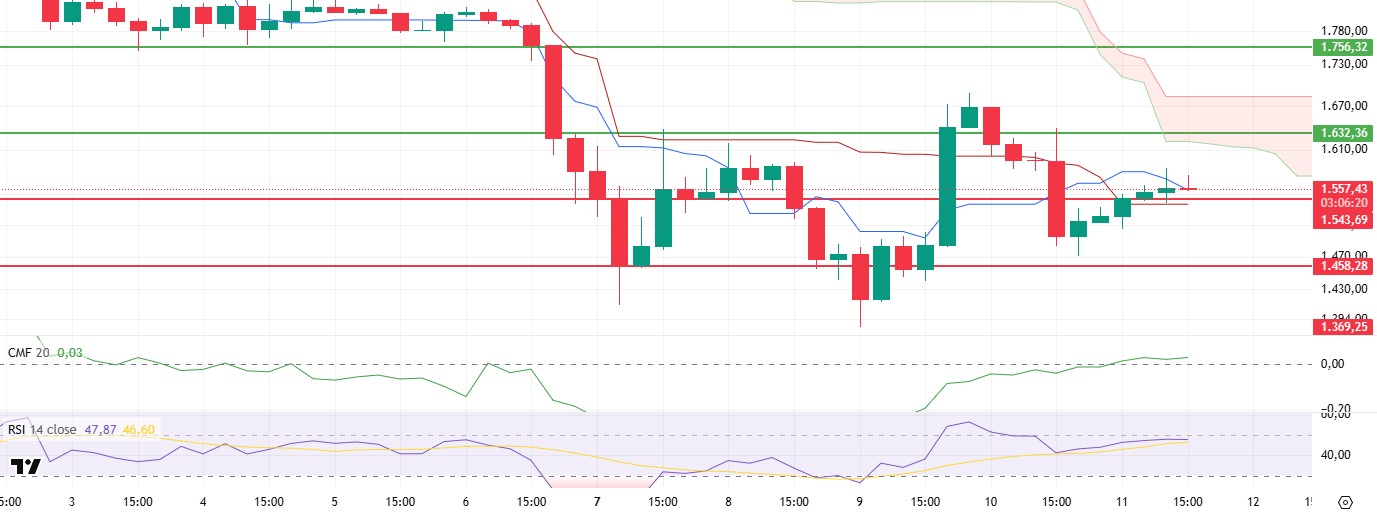
ETH followed a relatively calm but positive course during the day and managed to stay above the support level at $1,543. The importance of this area was emphasized in the technical analysis in the morning. Price action throughout the day supported this view and showed that investors continue to defend this level for now.
Technical indicators also support this sideways-positive outlook. The Chaikin Money Flow (CMF) indicator remains in positive territory and continues its upward momentum. This suggests that money inflows to the market are still strong, meaning that the buy side is dominating. This preservation of liquidity prevents the price from reacting sharply to the downside for the time being. On the Ichimoku indicator, the price remains above both the tenkan and kijun lines. The movement in these areas indicates that the short and medium-term trends overlap positively. In addition, the ‘buy’ signal formed by the intersection of the tenkan and kijun lines is still valid. As long as the price stays above these lines, the technical outlook tends to remain strong. Momentum indicators are similarly in positive territory, meaning that the momentum that could move the price up is not yet exhausted.
To summarize briefly, if there is no major news flow or a sudden market breakout, ETH’s stay above the $1,543 level strengthens the possibility of a continued upward movement. In this case, a gradual rise towards $1,632 could be possible. However, if the price slides below $1,543, this scenario weakens and the possibility of the price retracing back towards $1,458 could materialize with increased selling pressure.
Supports 1,543 – 1,458 – 1,369
Resistances 1,632 – 1,756 – 1,925
XRP/USDT
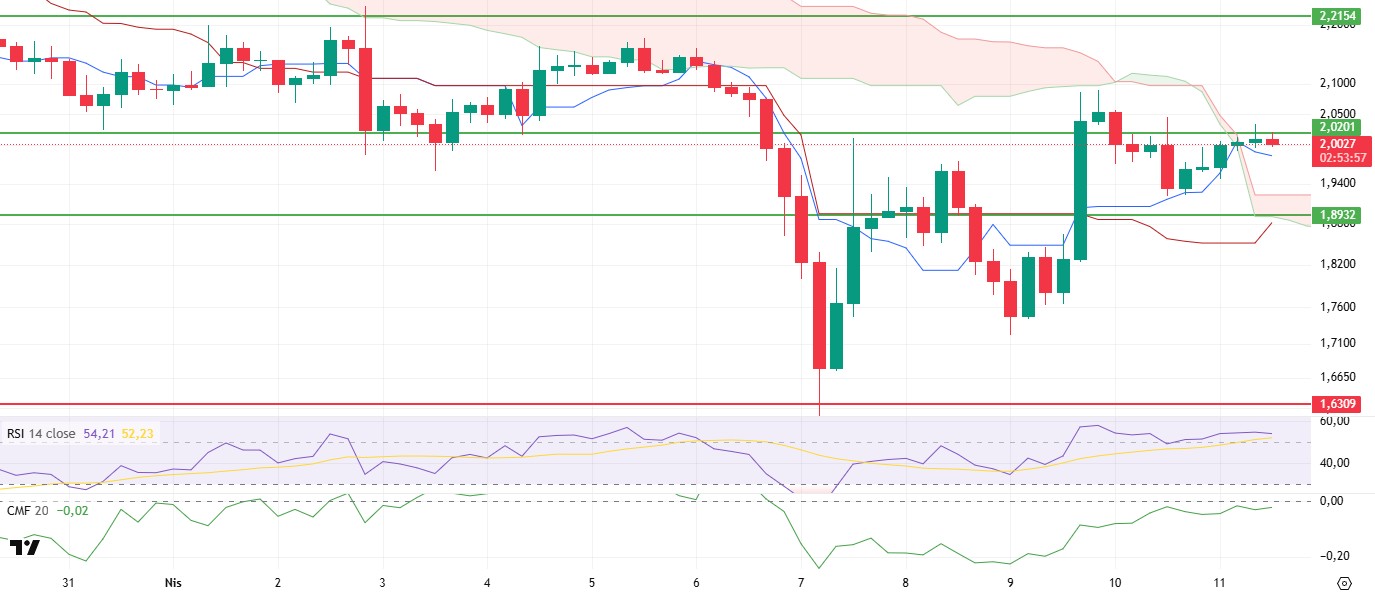
XRP moved in line with expectations during the day, rising as high as $2.02. However, it encountered strong resistance in this region and the price experienced a slight retracement with selling pressure from here. The $2.02 level stands out as a resistance point that is still difficult to overcome, although it has been tested many times recently. Breaking this level, especially in the evening hours, could pave the way for a strong upward momentum to be triggered.
Looking at the technical indicators, the Chaikin Money Flow (CMF) indicator is trending sideways just below the zero line. This suggests that although there have been upward attempts in the price, the selling pressure, which intensified especially around $ 2.02, is still in effect and sellers at this level are in control in the short term. This outlook suggests that buyers need to create a more decisive volume in their next attempt. On the Relative Strength Index (RSI) indicator, although there is a short-term weakening signal as the price rejected the resistance zone, the RSI value is still above the based MA line. This shows that the overall positive structure continues and the momentum is not completely lost. In other words, the buying trend continues, but buyers need to overcome the short-term selling pressure in order to move higher. When the Ichimoku indicator is analyzed, the picture is a little more positive. XRP price has managed to rise above the kumo cloud under which it has been moving for a while. This development can be considered as a trend reversal signal. In addition, the price continues to stay above the tenkan line and the positive intersection of this line with Kijun is still valid. This technical structure supports that the overall outlook is starting to turn upwards.
To summarize, the fluctuations in the XRP price between $1.89 and $2.02 can be read as a natural consolidation process in the current market conditions. However, the positive signals, especially in the Ichimoku indicator, suggest that the upward movement may gain momentum if the price exceeds the $2.02 resistance. On the other hand, if the $1.89 support breaks downwards, this positive picture may deteriorate, and the price may unwind towards lower levels again. For this reason, the $1.89 – $2.02 band should be followed as a critical threshold in the short term.
Supports 1.8932 – 1.6309 – 1.4264
Resistances 2.0201 – 2.2154 – 2.4492
SOL/USDT
FTX unlocked $21 million worth of Solana again. Janover made its first $4.6 million SOL purchase under a new crypto treasury strategy and plans to start staking immediately to generate returns and support the network.
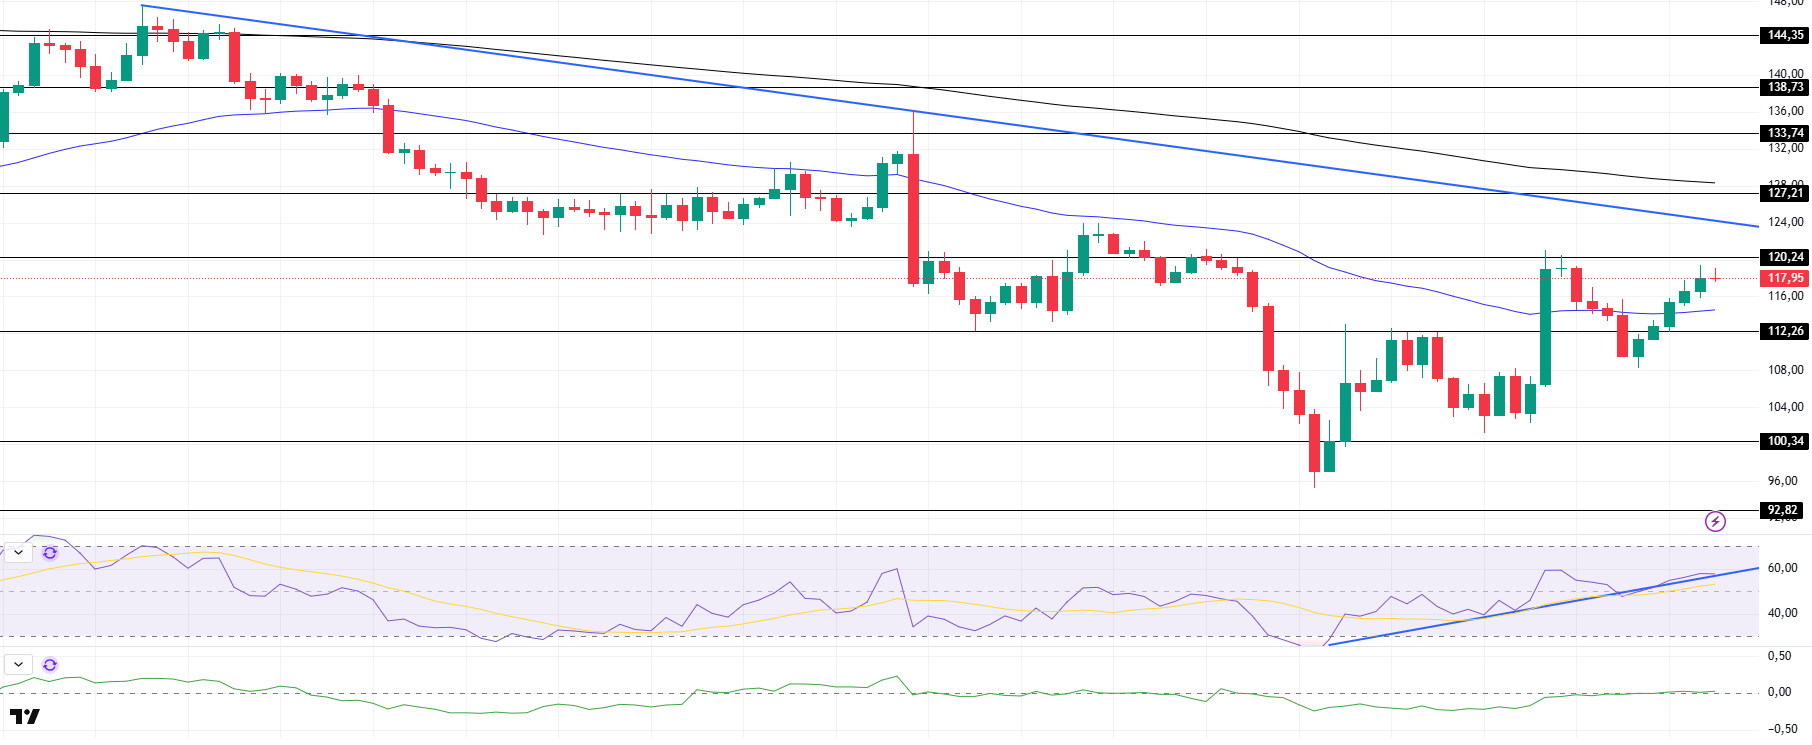
SOL continued its uptrend during the day. The asset is heading towards retesting the strong resistance level of $120.24. The asset, which broke the 50 EMA (Blue Line), which is the moving average, to the upside, may test the downtrend that started on March 25 as resistance if it breaks the strong resistance level of $120.24 if the momentum continues. On the 4-hour timeframe, the 50 EMA (Blue Line) remained below the 200 EMA (Black Line). This could continue the decline in the medium term. At the same time, the price started to move between two moving averages. This shows us that the market is in the decision phase. When we examine the Chaikin Money Flow (CMF)20 indicator, it has moved into the positive zone near the neutral level. However, the negative daily volume may move CMF back to the negative zone. However, Relative Strength Index (RSI)14 remains in positive territory, maintaining the uptrend that started on April 7. This could push the price higher. The $120.24 level appears as a resistance point in the rises driven by the upcoming macroeconomic data and the news in the Solana ecosystem. If it breaks here, the rise may continue. In the event of pullbacks for the opposite reasons or due to profit sales, the support level of $ 112.26 can be triggered. If the price comes to these support levels, a potential bullish opportunity may arise if momentum increases.
Supports 112.26 – 100.34 – 92.82
Resistances 120.24 – 127.21 – 133.74
DOGE/USDT
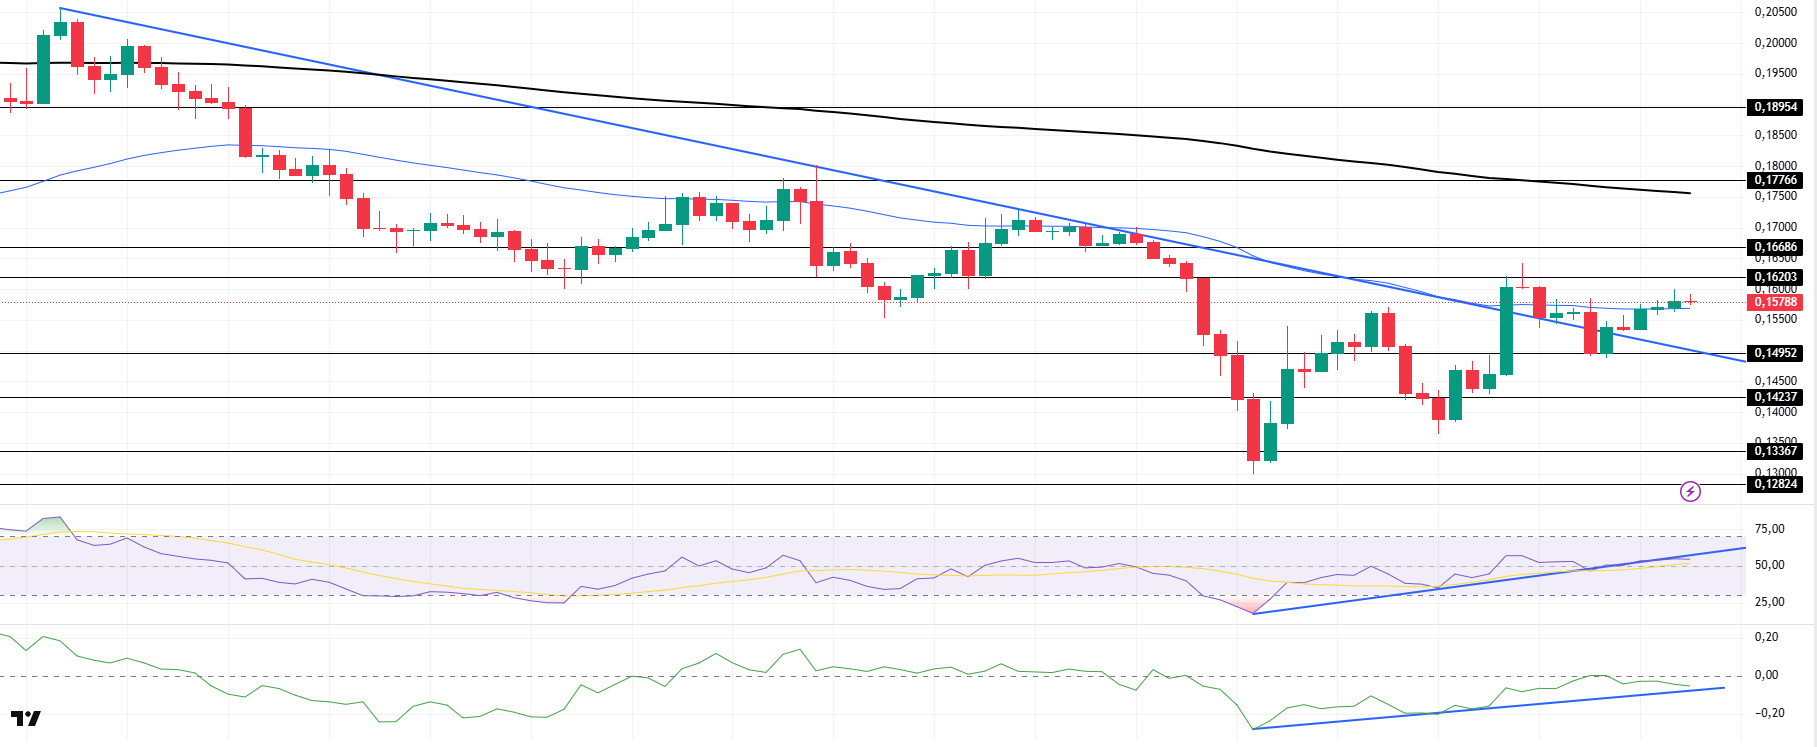
DOGE continued its uptrend during the day. The asset turned from the resistance level at $0.16203 and started pricing below the 50 EMA, the moving average. It then tested the strong support at $0.14952 and gained momentum from there. As of now, it remains above the 50 EMA (Blue Line), the moving average, making it a place of support. The price, which has managed to stay above the downtrend and the 50 EMA (Blue Line), may retest the strong resistance level of $0.16203 if the positive market dynamics continue. On the 4-hour timeframe, the 50 EMA (Blue Line) remains below the 200 EMA (Black Line). This could mean that the decline could continue in the medium term. However, the price started to price between two moving averages. When we examine the Chaikin Money Flow (CMF)20 indicator, it is in negative territory, falling from the neutral level. In addition, the negative 24-hour volume may increase the retracement of CMF. However, although the uptrend that started on April 7 continues in CMF, it is once again testing this place as support. This may continue the decline. On the other hand, Relative Strength Index (RSI)14 is in the middle zone of the positive level and is currently testing the uptrend that started on April 7 as support. The level of 0.16686 dollars appears as a very strong resistance point in the rises due to political reasons, macroeconomic data and innovations in the DOGE coin. In case of possible retracements due to political, macroeconomic reasons or due to negativities in the ecosystem, the $ 0.14952 level, which is a strong support place, is an important support place. If the price reaches these support levels, a potential bullish opportunity may arise if momentum increases.
Supports 0.14952- 0.14237 – 013367
Resistances 0.16203 – 0.16686 – 0.17766
Legal Notice
The investment information, comments and recommendations contained herein do not constitute investment advice. Investment advisory services are provided individually by authorized institutions taking into account the risk and return preferences of individuals. The comments and recommendations contained herein are of a general nature. These recommendations may not be suitable for your financial situation and risk and return preferences. Therefore, making an investment decision based solely on the information contained herein may not produce results in line with your expectations.
