
TECHNICAL ANALYSIS
BTC/USDT
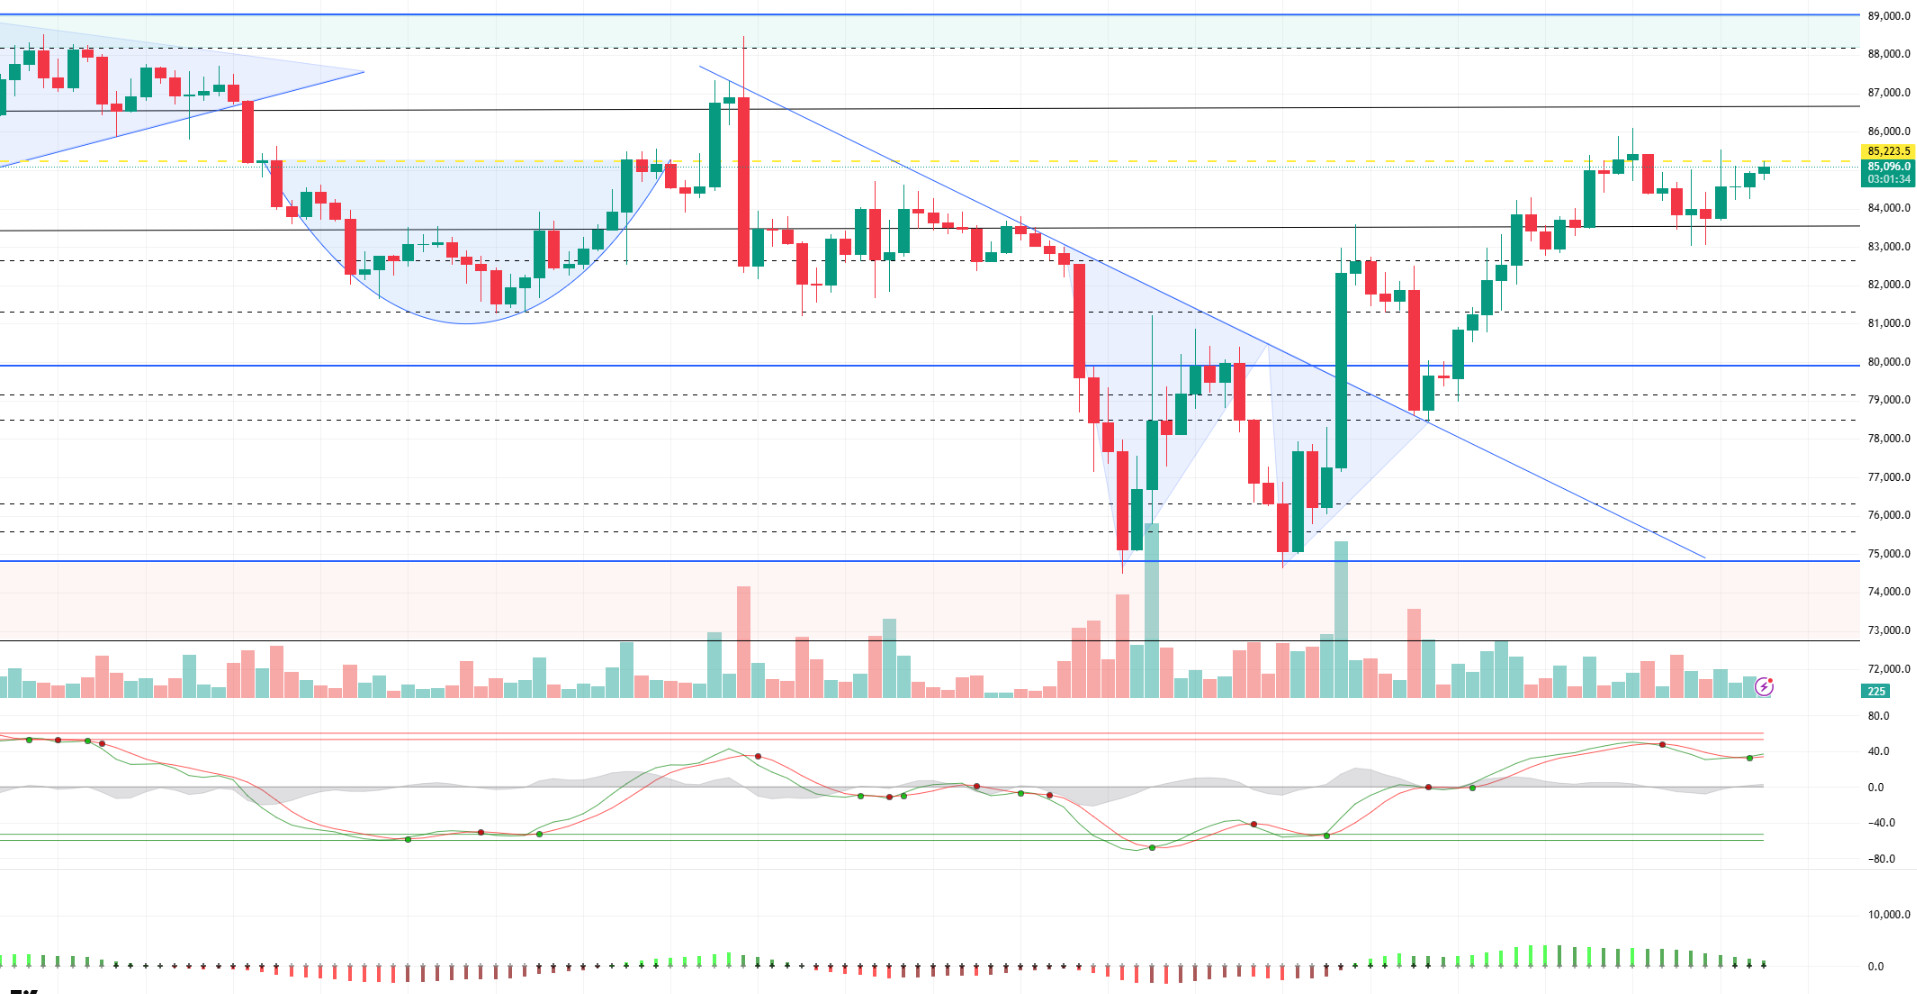
Strategy bought another 3,459 BTC during the week of April 7-13, bringing its total holdings to 531,644 BTC. These purchases showed a continued appetite for institutional interest, with Michael Saylor noting that investment returns this year have reached 11.4%. However, the CoinShares data painted a different picture for the broader market: there were weekly net outflows of $795 million from digital asset investment products. Most of these outflows were driven by Bitcoin, totaling $751 million, while all inflows since the beginning of the year were reported to be almost zero.
Looking at the technical outlook, we see that BTC is once again pushing the 85,000 level in an environment where technical indicators gave a buy signal in the previous analysis. Continuing its uptrend, BTC continues to hold its gains and this supports short-term optimism in the market. In the US futures market, crypto and tech companies closed the day on a positive note, which may trigger upward momentum in BTC as the spot market opens. Accordingly, the price can be expected to continue its upward attempts. Liquidation data suggests that market participants are still on the buying side and the risk appetite is still there, as evidenced by the scarcity of short-term short trades. Technically, this supports that BTC has room for upside. However, another noteworthy factor is the concentration of short trades above 88,000 on a monthly basis. This area stands out as a strong resistance level that the price may face and may be an area where selling pressure may increase in upward movements. On the fundamental side, tariff announcements will play an important role in pricing. Positive or negative statements may support the technical outlook or reverse the current scenario. Therefore, news flows should be carefully monitored. In a possible pullback, we will follow the 83,500 level as an important technical support point.
Supports 83,500 – 81,500 – 80,000
Resistances 85,200 – 86,600 – 89.000
ETH/USDT
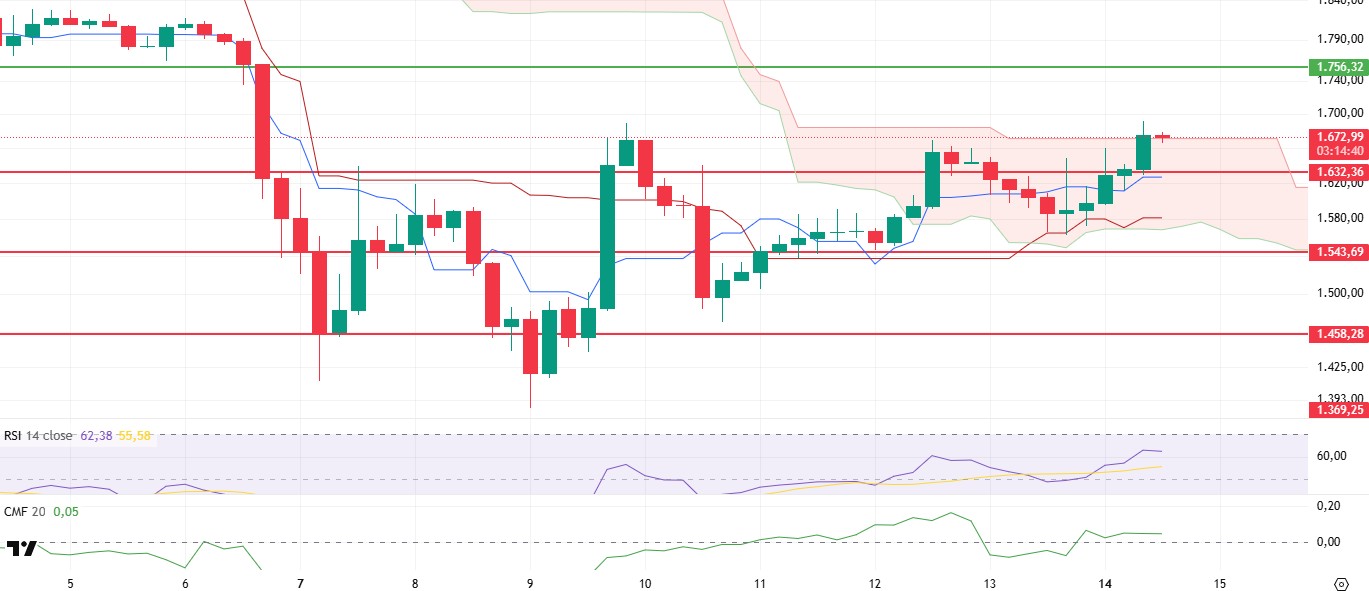
With the momentum it gained in the morning hours, ETH managed to break the important resistance zone at $1,632. With the surpassing of this level, the price’s upward crossing of the kumo cloud resistance, which is critical in the Ichimoku indicator, can be considered as an extremely important technical development. This move not only shows that the price is gaining momentum, but also that the positive structure is consolidating across technical indicators. The break above the Kumo cloud is considered one of the strongest signals of trend reversals within the Ichimoku structure, while at the same time reflecting that the general perception in the market has started to change in a bullish direction.
The fact that the Tenkan level continues its upward trend along with the price is another important factor indicating that this bullish move is technically supported. Since the slope of the Tenkan level reflects the strength of the short-term momentum, the upward slope indicates that the pressure on the buy side still persists. However, it is observed that the negative divergence in the Relative Strength Index (RSI) indicator, which was also noted in previous analyzes, has disappeared with the recent rise. The fact that the RSI continues its upward movement in parallel with the price reveals that the market has increased momentum and the uptrend is progressing on a technically healthy ground. The fact that the RSI value is approaching the overbought zone but has not yet reached this level supports that there is no serious obstacle to the rise in the short term. However, Chaikin Money Flow (CMF) stands out as the only indicator that does not accompany the current bullish movement. The fact that CMF continues to move sideways indicates that the net liquidity entering the market is not strong enough and that the rise is largely due to the purchases on the futures side. This may raise some questions about the sustainability of the rally. In the absence of adequate support from the spot side, such rallies may find it difficult to be permanent. Although the fact that CMF is still pricing in the positive zone is not technically an indicator of weakness, the fact that these values remain horizontal indicates that caution should be exercised in the market.
Overall, the majority of technical indicators are generating positive signals in ETH pricing. The strong buy signal that emerged with the break above the Kumo cloud suggests that the price may have entered a new technical bullish phase. If this positive structure is maintained and trading volumes continue to support the price, especially in the spot market, it is highly likely to test the $1,756 level in the short term. However, if the liquidity that forms the basis for the rise comes from the futures side and there is not enough provision in the spot market, the price may retreat to find support again before reaching these levels. Especially if the kumo cloud support is lost, it is one of the technically possible scenarios for the price to experience a correction towards the $1,632 level again. For this reason, the persistence of the price above the cloud support and the movement in the CMF indicator are among the most critical factors to be closely monitored in the coming days in terms of the continuation of the trend.
Supports 1,632 – 1,543 – 1,458
Resistances 1,756 – 1,952 – 2,205
XRP/USDT
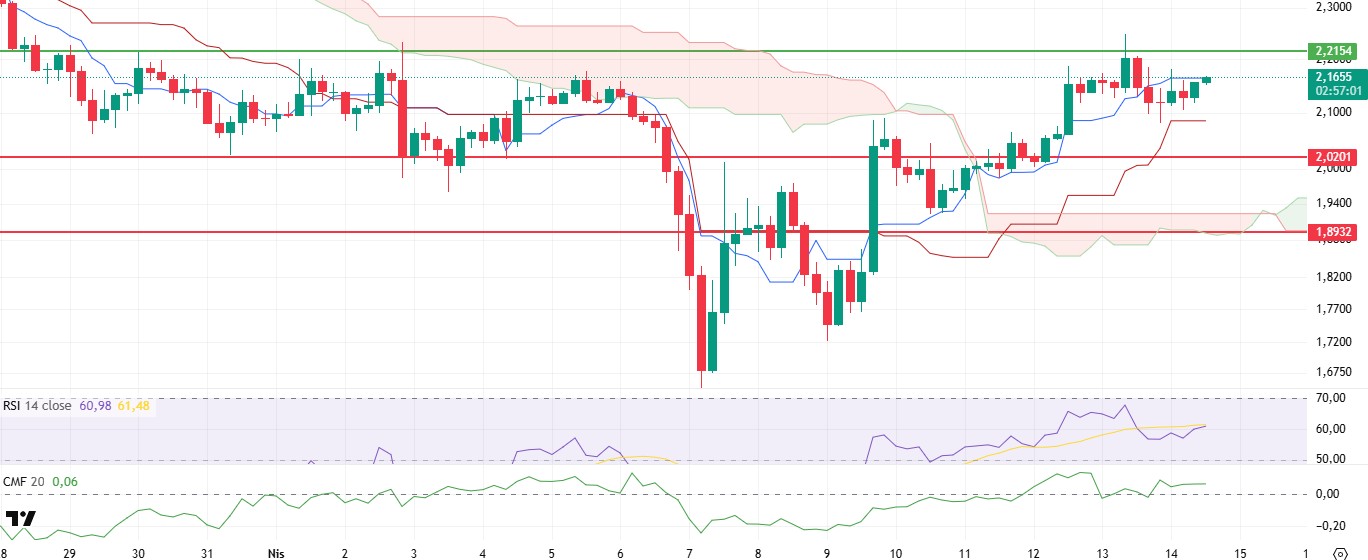
XRP managed to rise to the Tenkan level with limited positive movements during the day and continues its horizontal movement at a level very close to the $2.21 resistance. This compressed structure suggests that breakouts from this region could cause sharp price movements. Such structures usually result in bullish breakouts, although the fact that the price is moving in a narrow range suggests that traders remain indecisive about the direction.
Looking at the technical indicators, Chaikin Money Flow (CMF) remains flat in positive territory. This indicates that the liquidity entering the market is maintained, but a clear directional preference has not yet formed. While the liquidity balance is maintained, the RSI indicator has started to give positive signals on the momentum side by entering a recovery trend with the recent rise. This can be considered as a sign that the buying side is regaining strength. The Ichimoku indicator shows that the price continues to move between the tenkan and kijun levels. This situation reveals that the market maintains its indecisive structure in the short term and the critical levels for determining the direction have not yet been exceeded. If the price settles above the Tenkan level, it may signal an upward momentum, while if it sags below kijun, correction movements may continue.
As of the general outlook, it is critical to clearly exceed the $2.21 level for XRP to continue its rise. Crossing this level with a voluminous breakout may pave the way for the price to accelerate up to the resistance of $2.39. Otherwise, the most important support level in a possible retreat stands out as $2.02. Although buyers are likely to re-engage at this level, a short-term negative outlook may occur if it breaks.
Supports 2.0201- 1.8932 – 1.6309
Resistances 2.2154 – 2.3938 – 2.4721
SOL/USDT
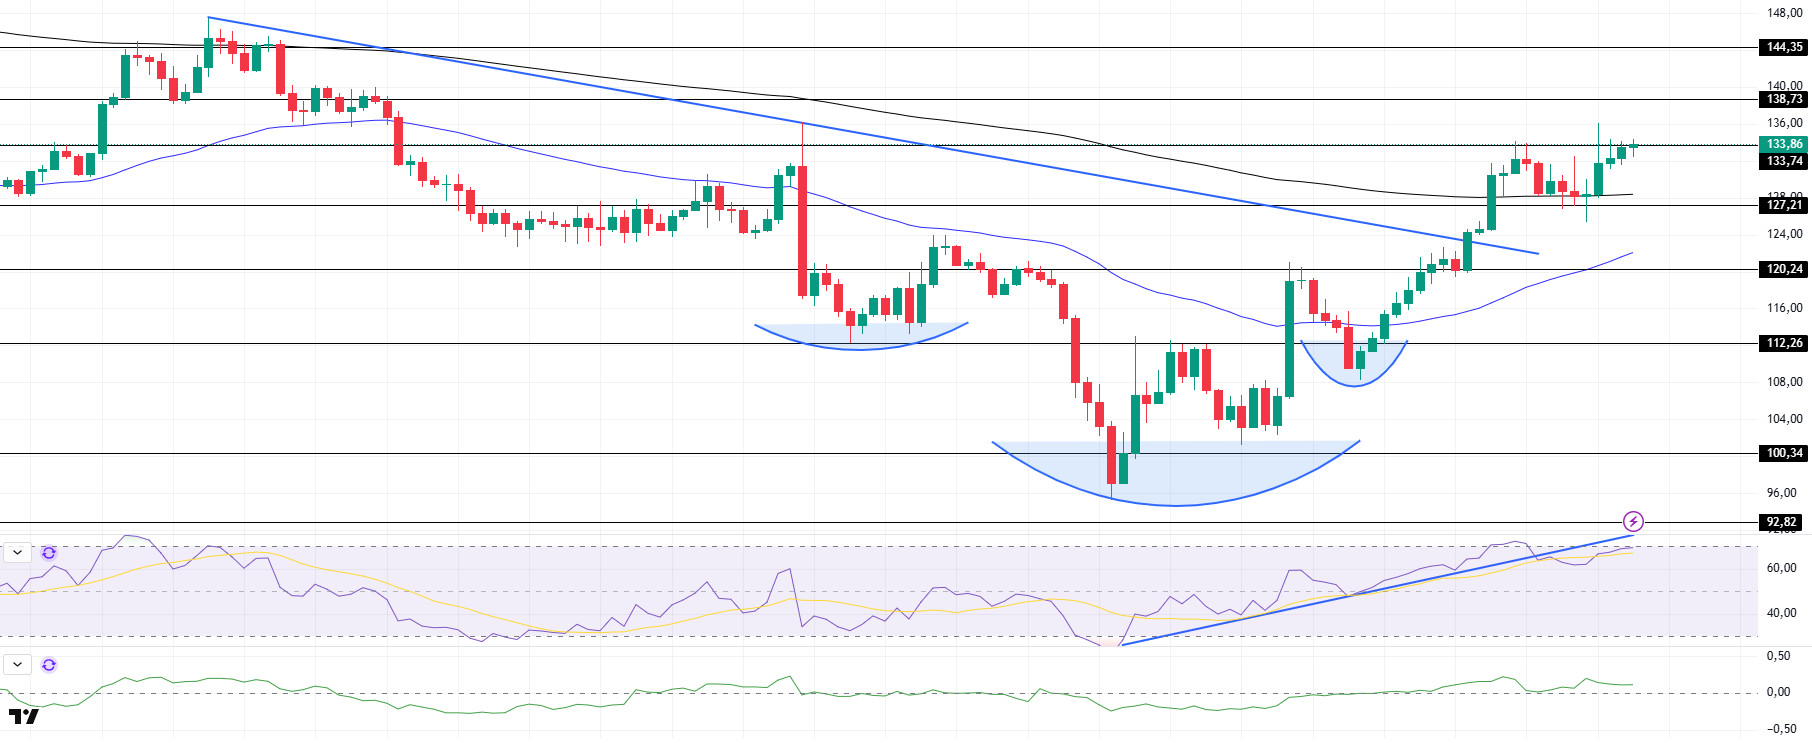
SOL moved sideways during the day. The asset remained above the strong resistance level of $127.21 and the moving average of 200 EMA (Black Line). It tested the strong resistance level of 133.74 twice as resistance but failed to break it and retreated slightly. It is currently testing this level again. On the other hand, the reverse shoulder-head-shoulder pattern should be taken into consideration. On the 4-hour timeframe, the 50 EMA (Blue Line) remained below the 200 EMA (Black Line). This may continue to be bearish in the medium term. At the same time, the price continued to move above the two moving averages. This suggests that buyers are becoming more dominant in the market. The Chaikin Money Flow (CMF)20 indicator is also at a positive level. However, positive daily volume may move CMF to the middle levels of the positive zone. However, Relative Strength Index (RSI)14 fell below the trend, failing to maintain the uptrend that started on April 7, but the buying dominance did not disappear. However, profit sales may cause a pullback. The $144.35 level appears as a resistance point in the rises driven by the upcoming macroeconomic data and the news in the Solana ecosystem. If it breaks here, the rise may continue. In case of retracements for the opposite reasons or due to profit sales, the support level of $127.21 can be triggered. If the price comes to these support levels, a potential bullish opportunity may arise if momentum increases.
Supports 127.21 – 120.24 – 112.26
Resistances 133.74 – 138.73 – 144.35
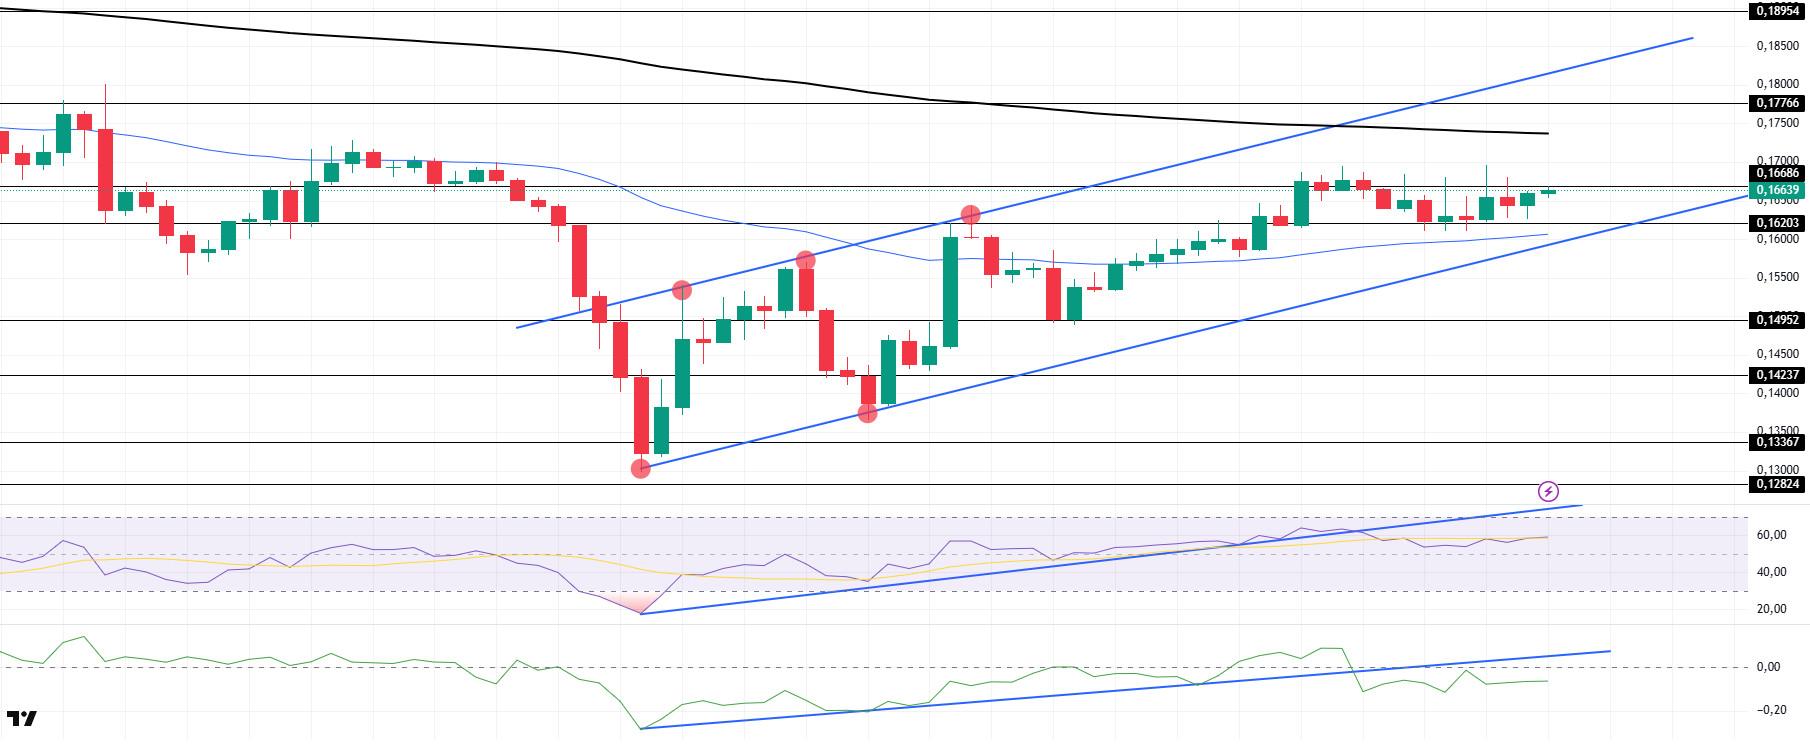
DOGE/USDT
DOGE moved sideways during the day. Although the asset tested the resistance level of $0.16686 multiple times, it failed to break it and narrowed to a narrow band of $0.16203 – $0.16686. However, the price managed to stay above the 50 EMA (Blue Line), the moving average, and remains at the mid-level of the uptrend that started on April 7. On the 4-hour timeframe, the 50 EMA (Blue Line) remains below the 200 EMA (Black Line). This could mean that the decline could continue in the medium term. However, the price started to price between the two moving averages. This shows us that the price is in the decision-making phase. When we examine the Chaikin Money Flow (CMF)20 indicator, it fell from the neutral level and found value in the negative zone. In addition, the positive 24-hour volume may push CMF back into positive territory. However, the uptrend in CMF, which started on April 7, broke downwards. This may continue the decline. On the other hand, Relative Strength Index (RSI)14 is in the middle zone of the positive level and has broken the uptrend that started on April 7. This may cause a slight pullback. The $0.16686 level is a very strong resistance point in the uptrend due to political reasons, macroeconomic data and innovations in the DOGE coin. In case of possible pullbacks due to political, macroeconomic reasons or negativities in the ecosystem, the $ 0.16203 level, which is a strong support place, is an important support place. If the price reaches these support levels, a potential bullish opportunity may arise if momentum increases.
Supports 0.16203 – 0.14952 – 014237
Resistances 0.16686 – 0.17766 – 0.18954
LEGAL NOTICE
The investment information, comments and recommendations contained herein do not constitute investment advice. Investment advisory services are provided individually by authorized institutions taking into account the risk and return preferences of individuals. The comments and recommendations contained herein are of a general nature. These recommendations may not be suitable for your financial situation and risk and return preferences. Therefore, making an investment decision based solely on the information contained herein may not produce results in line with your expectations.
