
TECHNICAL ANALYSIS
BTC/USDT
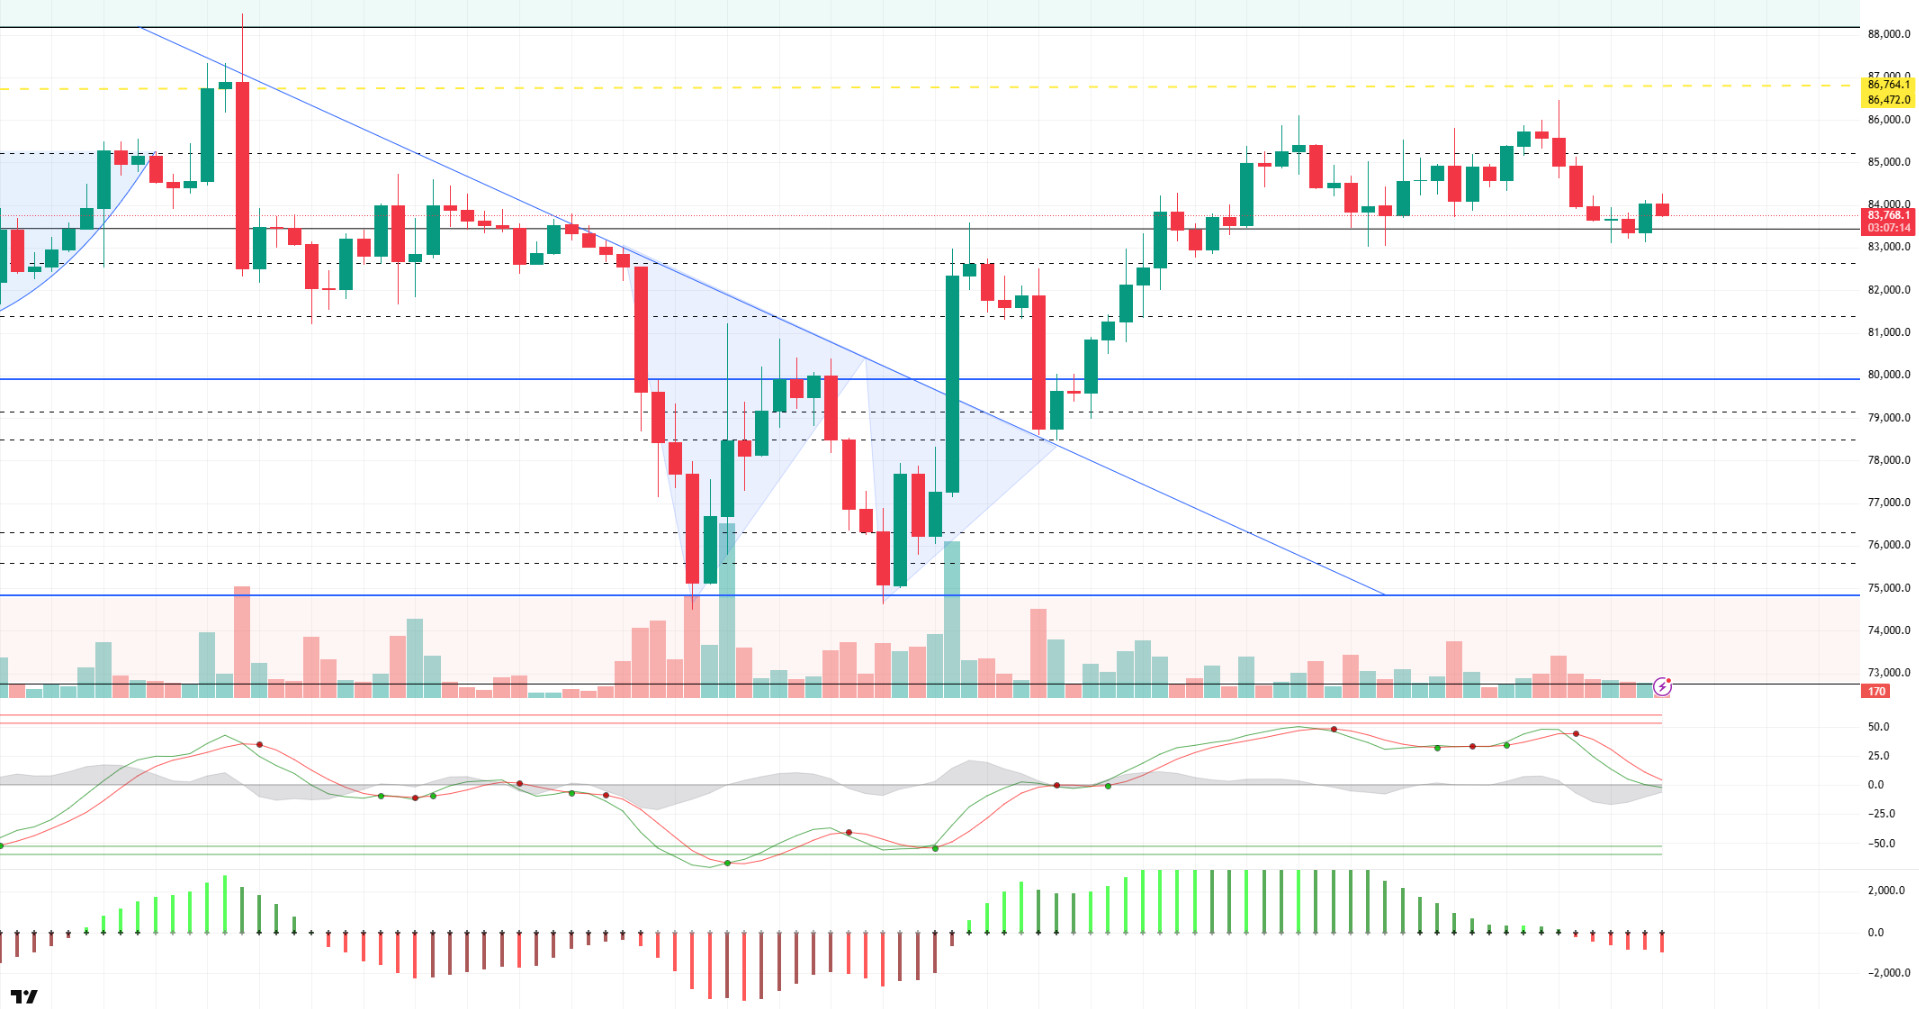
On a relatively quiet day, Bitcoin continued to price sideways, while on-chain indicators started to produce positive signals in the medium term. In particular, the “Bitcoin Accumulation Trend Index” reached a new peak in 2025, suggesting that wallets of all sizes are back in accumulation mode. This shows that despite the recent weakness in prices, large groups of investors are moderately re-engaging in the market for the long term. On the other hand, with the better-than-expected retail data, the market’s attention for the rest of the day is focused on Fed Chair Jerome Powell’s remarks.
Looking at the technical outlook, BTC was slightly bullish compared to the previous analysis and tested the 85,500 support level three times during the day. The fact that this level was not broken to the downside allowed the price to react upwards again in the short term. At the time of writing, BTC is trading at 84,000. The Wave Trend Oscillator continues to produce a weakening sell signal, while low trading volume is keeping momentum weak. This suggests that the price is limited in its upside moves and that the market is still indecisive. Overall, uncertainty in the market continues to weigh on the BTC price, while a strong fundamental catalyst is still needed for the uptrend to continue. At this point, as we have emphasized before, flexibility in tariff policies or the removal of uncertainty will play an important role in the direction of price movements. Technically, the 83,500-85,000 band continues to function as BTC’s decision-making zone. Technically, closes below the 83,500 support could increase selling pressure and bring deeper corrections. On the other hand, closes above 85,000 could strengthen the technical backdrop for a new uptrend and re-target the liquidation zones in the 86,400-86,700 range.
Supports 83,500 – 81,500 – 80,000
Resistances 85,200 – 86,600 – 89.000
ETH/USDT
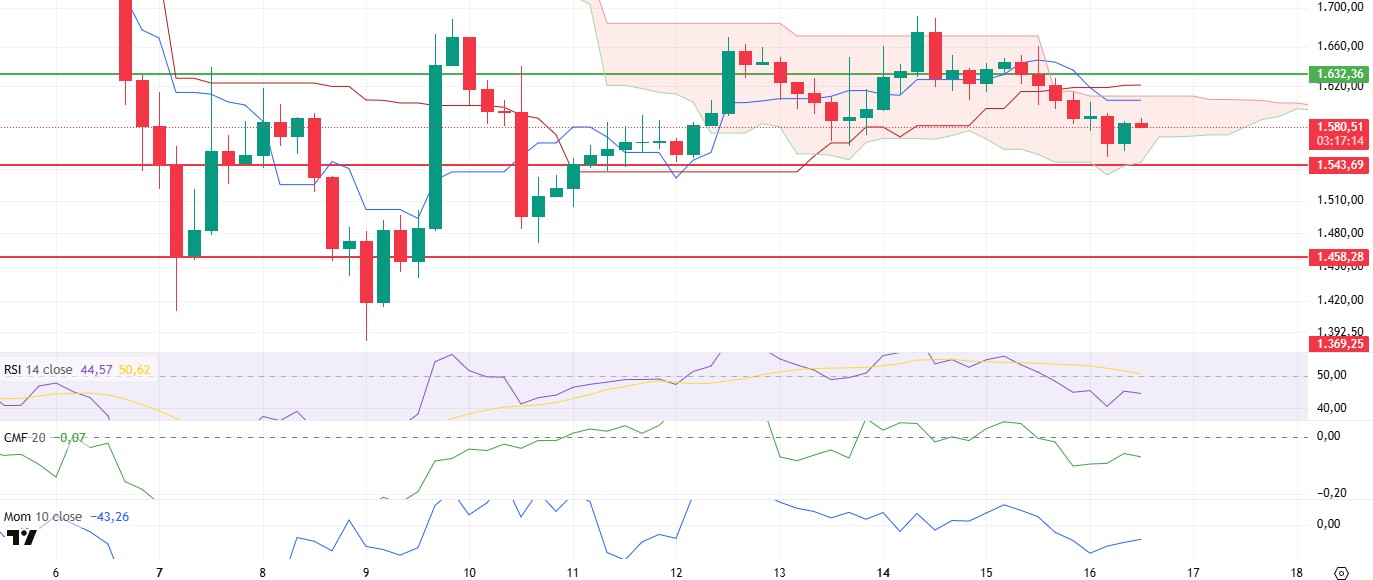
Despite the weakness in technical indicators during the day, ETH managed to recover and rise above the $1,580 level again. However, the fact that the price is still the sand cloud indicates that the market is moving in the uncertainty zone and the search for direction continues. This creates a technical outlook that needs to be carefully monitored for both short-term and medium-term investors.
Looking at the technical indicators, the Chaikin Money Flow (CMF) indicator fell into negative territory with yesterday’s decline and remains in this zone. This confirms that there is not enough capital inflows on the spot buying side and investors are cautious. This weakness on the spot side suggests that the price’s rise during the day is not sustainable. Similarly, Cumulative Volume Delta (CVD) data reveals that spot buying remained quite limited and the recovery during the day was mainly driven by positioning in the futures market. This stands out as another important signal that raises question marks about the permanence of the rise. When the Ichimoku indicator is analyzed, the fact that the tenkan line has cut the kijun line downwards indicates that a technical sell signal has occurred. However, the fact that the price is still in the kumo cloud indicates that this sell signal has not yet been fully confirmed. This suggests that the market is indecisive in determining the direction of the market and technical patterns are not yet clear. On the momentum indicators side, a slight recovery is seen; some indicators show an upward trend. However, these movements are not supported by sufficient volume support, indicating that the uptrend remains weak.
As a result, it is critical whether the price action will remain within the kumo cloud for the rest of the day. In case of a close below $1,570, the lower band of the cloud, a pullback to $1,543 may be possible in the first stage. A downside break below this level could trigger deeper and more aggressive selling. On the other hand, the continuation of upward movements and especially exceeding the resistance of $1,632 may break the negative structure in the technical outlook and pave the way for the start of a new bullish wave. Persistence above this level may cause a positive change in market perception and increase the appetite for buying.
Supports 1,543 – 1,458 – 1,369
Resistances 1,632 – 1,756 – 1,925
XRP/USDT
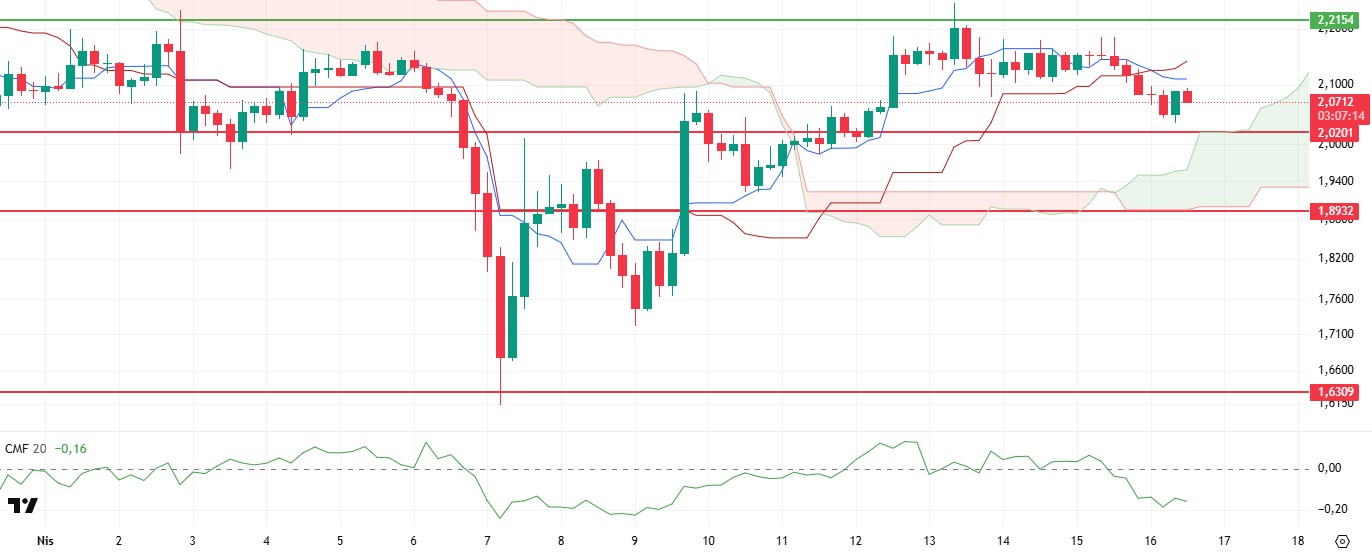
XRP tested an important support point during the day, retreating to the $2.02 level. With the reaction purchases from this level, the price made a limited recovery and rose to the level of $2.09. However, despite this short-term recovery, the weak outlook in technical indicators continues and shows that the market has not yet gained a clear direction.
The Chaikin Money Flow (CMF) indicator continued its downward trend in the negative territory, indicating that liquidity outflows from the market continued. This confirms weak investor confidence and the lack of meaningful capital inflows on the spot side. This trend of CMF suggests that buying has largely subsided and prices are mostly trying to find direction with short-term reaction movements. Looking at the Ichimoku indicator, the sell signal formed by the intersection of the tenkan and kijun lines remains valid. However, the fact that the price is still above the kumo cloud shows that this signal has not yet been fully confirmed technically. If the price enters the cloud, it seems possible that this sell signal will be confirmed and the selling pressure may increase further. In this context, the Ichimoku analysis reveals the fragile nature of the market and the uncertainty in the direction-setting process.
Given the current technical structure, the possibility of a pullback towards the $2.02 level in the evening remains on the table. This level is technically critical as it is not only a short-term price support but also the upper line of the Ichimoku cloud. Although there is a high probability that buyers will re-engage in a pullback towards this level, if the $2.02 level is broken, selling pressure will likely intensify and the price is likely to head towards lower levels. On the other hand, in an upside scenario, a break above the $2.21 level could eliminate the weakness in the technical outlook and create a positive change in market perception. A break above this level could pave the way for the end of the current negative pressure and the start of a new bullish wave in the XRP price.
Supports 2.0201- 1.8932 – 1.6309
Resistances 2.2154 – 2.3938 – 2.4721
SOL/USDT
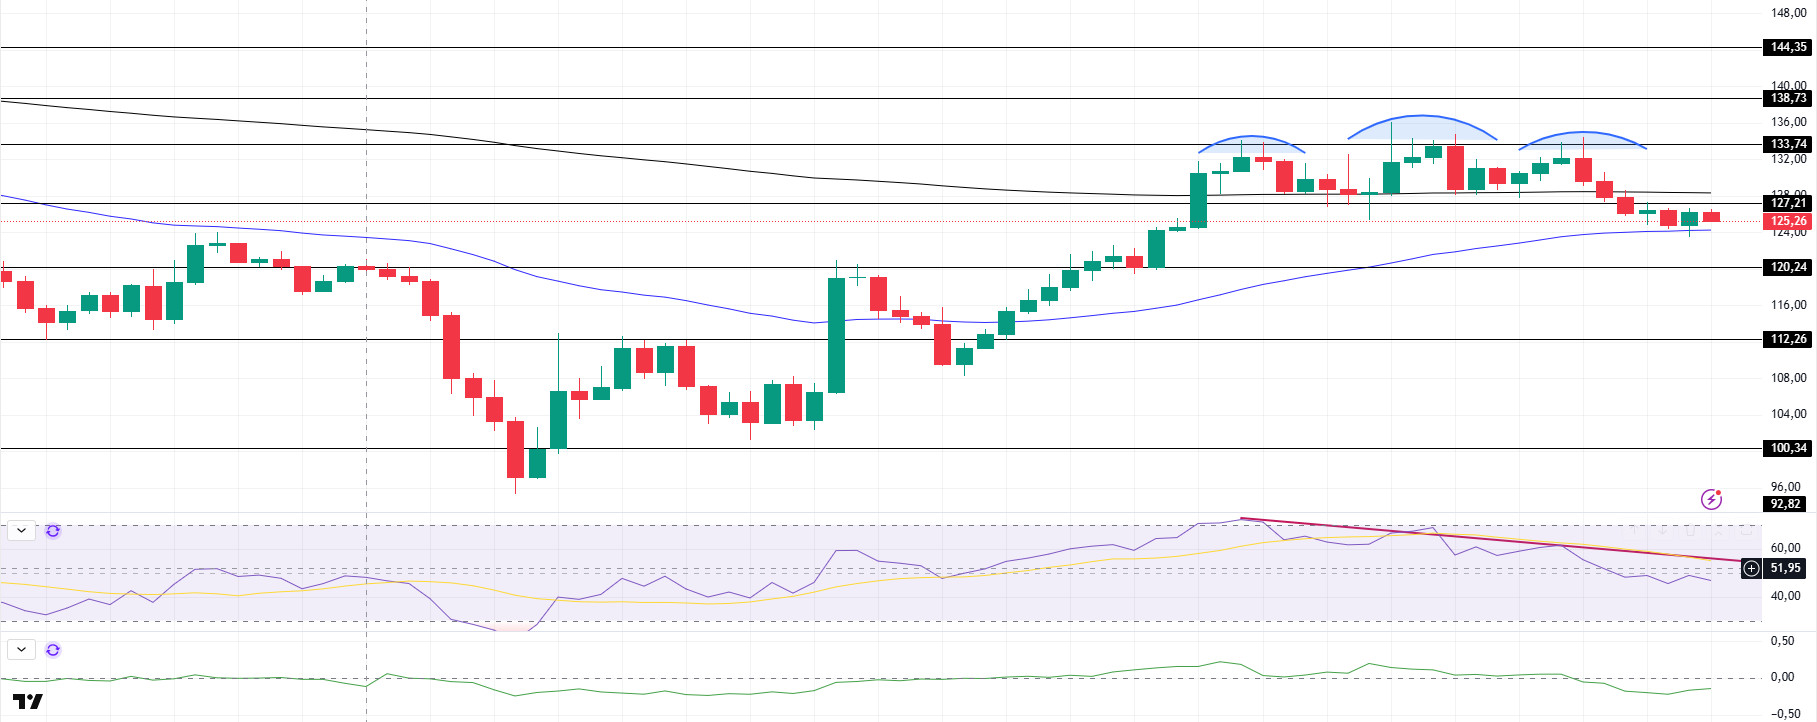
SOL moved sideways during the day. The asset tested the strong resistance level of $133.74 but failed to break it. However, the asset also broke the 200 EMA (Black Line) to the downside and a 3-peak pattern was formed. This should be taken into account. The price, which is currently supported by the 50 EMA (Blue Line), which is the moving average, was bullish and continued to be above the moving average. On the 4-hour timeframe, the 50 EMA (Blue Line) is below the 200 EMA (Black Line). This could continue bearish in the medium term. At the same time, the price started moving between two moving averages. This shows us that the market is in the decision phase. The Chaikin Money Flow (CMF)20 indicator is in negative territory. However, the negative daily volume may cause CMF to retreat further. However, money outflows have decreased compared to the morning. Relative Strength Index (RSI)14 continued its downtrend that started on April 12 and moved into negative territory. This may increase selling pressure. The $ 133.74 level appears as a resistance point in the rises driven by the upcoming macroeconomic data and the news in the Solana ecosystem. If it breaks here, the rise may continue. In the event of pullbacks for the opposite reasons or due to profit sales, the support level of $120.24 can be triggered. If the price comes to these support levels, a potential bullish opportunity may arise if momentum increases.
Supports 120.24 – 112.26 – 100.34
Resistances 127.21 – 133.74 – 138.73
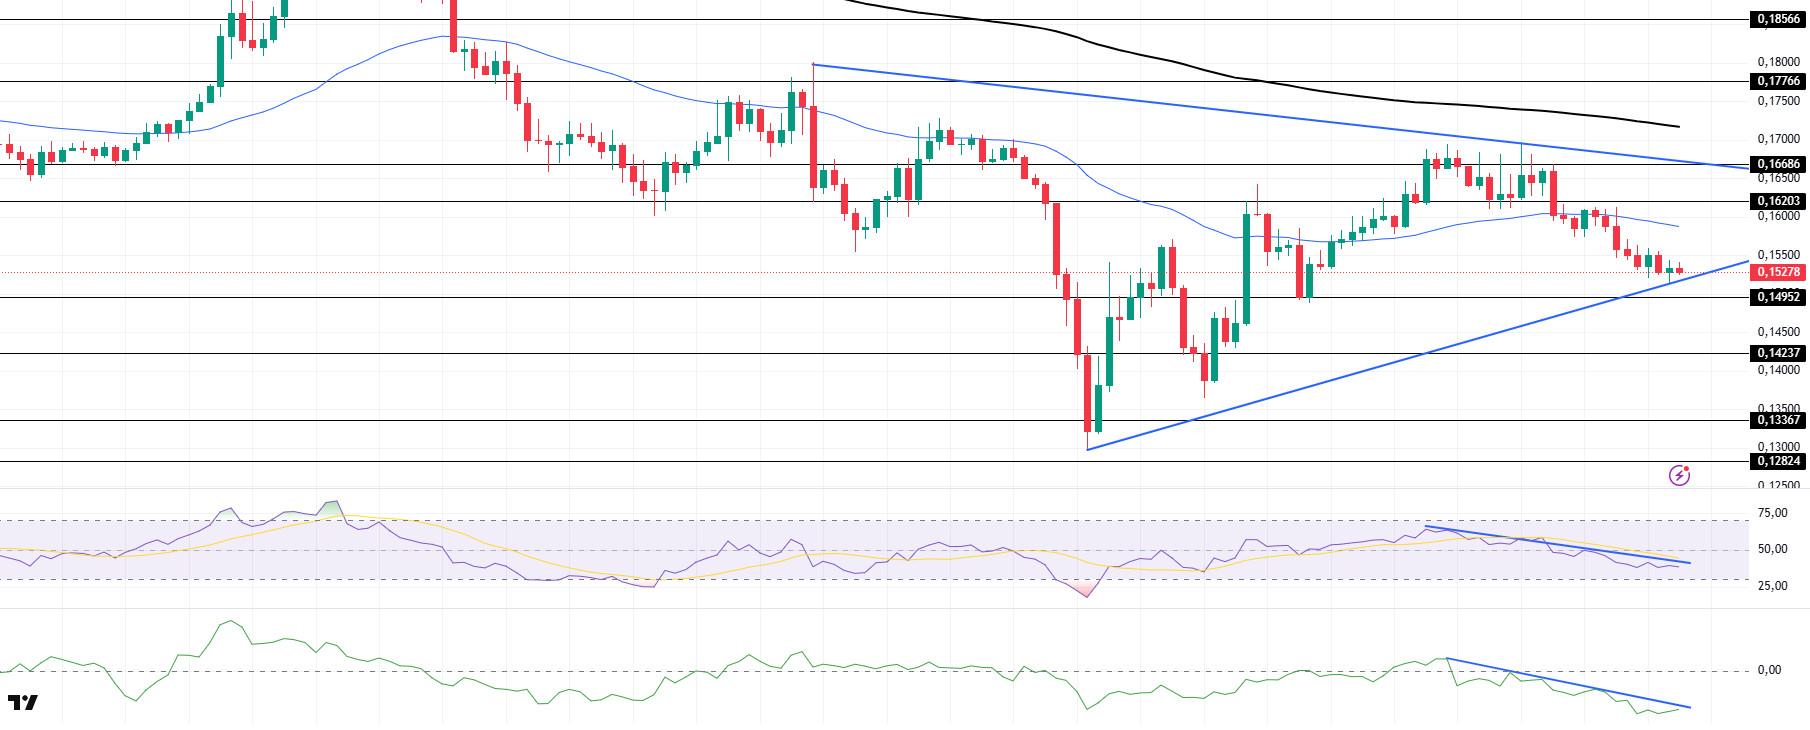
DOGE/USDT
DOGE moved sideways during the day. The asset broke the 50 EMA (Blue Line), the moving average, to the downside and fell to the support of the symmetrical triangle pattern, where it found support and moved slightly higher. On the 4-hour timeframe, the 50 EMA (Blue Line) remains below the 200 EMA (Black Line). This could mean that the decline could continue in the medium term. However, the price continued to price below the two moving averages. This suggests that selling pressure is increasing. When we examine the Chaikin Money Flow (CMF)20 indicator, it continued to be in negative territory. In addition, the negative 24-hour volume may increase the retracement of CMF. But we see that money outflows are decreasing. However, CMF may test the downtrend that started on April 12 as resistance. If it breaks, the 0.016203 level can be triggered. On the other hand, Relative Strength Index (RSI)14 is in the negative zone and maintains the downtrend that started on April 12. This may cause pullbacks. The $0.16686 level stands out as a very strong resistance point in the rises due to political reasons, macroeconomic data and innovations in the DOGE coin. In case of possible pullbacks due to political, macroeconomic reasons or negativities in the ecosystem, the $0.14952 level, which is a strong support place, is an important support place. If the price reaches these support levels, a potential bullish opportunity may arise if momentum increases.
Supports 0.14952 – 014237 – 0.13367
Resistances 0.16203 – 0.16686 – 0.17766
Legal Notice
The investment information, comments and recommendations contained herein do not constitute investment advice. Investment advisory services are provided individually by authorized institutions taking into account the risk and return preferences of individuals. The comments and recommendations contained herein are of a general nature. These recommendations may not be suitable for your financial situation and risk and return preferences. Therefore, making an investment decision based solely on the information contained herein may not produce results in line with your expectations.
