
TECHNICAL ANALYSIS
BTC/USDT
US President Donald Trump signaled that mutual tariffs between the US and China will not be increased further, stating that lower tax rates may be possible. On the other hand, the softening rhetoric on trade wars had a positive repercussion on global markets. IMF chief Kristalina Georgieva emphasized that they do not expect a global recession in the near term, although increasing protectionism may put pressure on global growth. Today, US stock markets will be closed due to Good Friday.
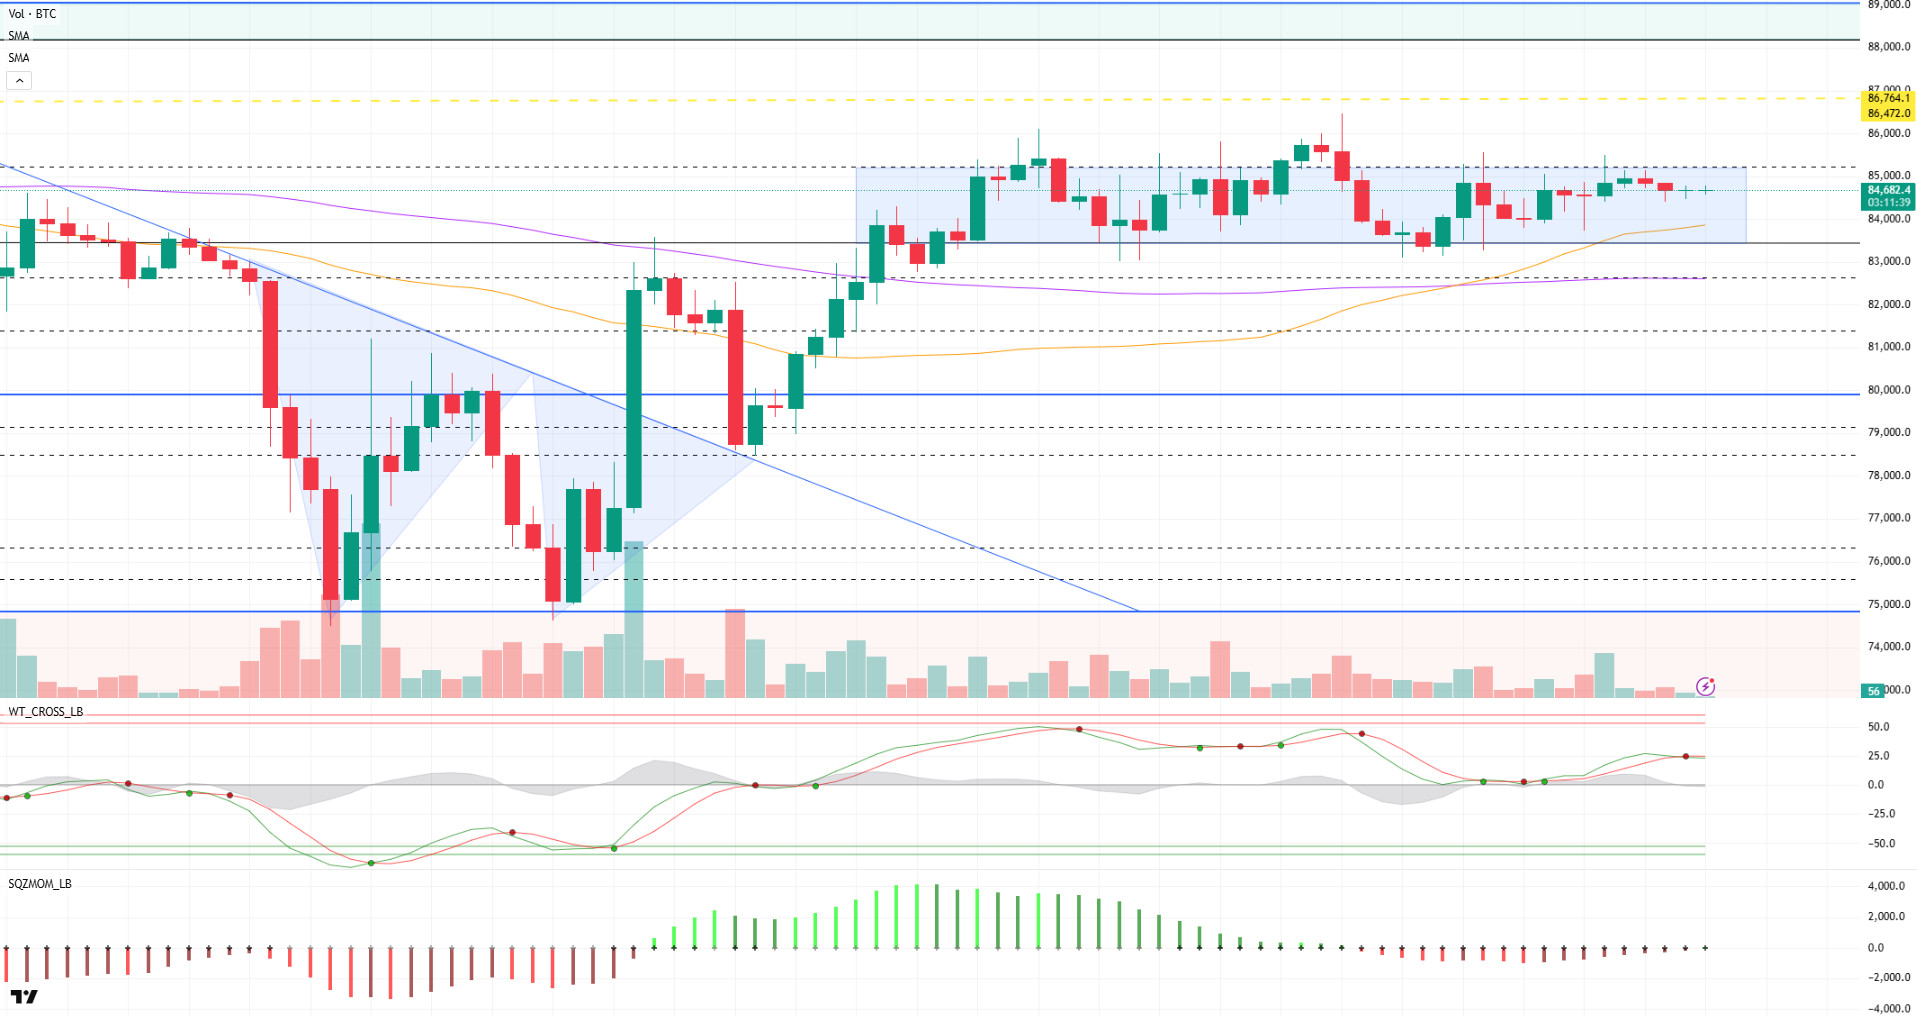
Looking at the technical outlook, BTC continued to move in a horizontal band with low volatility and weak volume during the day. It can be said that the price is still consolidating within the high tight flag pattern, while there is no development that changes expectations compared to previous analysis. Looking at the technical indicators, the Wave Trend Oscillator has replaced the buy signal with a sell signal. This shows that the upward momentum is weakening in the short term. In addition, momentum indicators continue to maintain their weak outlook, supporting the uncertainty of price movements, while the doji on the last 4-hour candle supports this situation. In liquidation data, while an increase in the frequency of positions is observed, it is still seen that the weight is still in short positions. It is noteworthy that short accumulation increased especially in the 86,472-86,764 band. These levels may stand out as liquidity targets after a possible upside breakout. On the fundamental side, while uncertainty continues, statements that may come from the Trump front may be decisive in terms of market direction. If an upward movement starts with the effect of such news flows, the 85,200 level appears as a breakout point. Once this level is surpassed, there may be a rapid movement towards the liquidation zones mentioned above. In the opposite scenario, that is, in case of increased selling pressure, the 83,500 level continues to maintain its importance as a strong support and reference point.
Supports 83,500 – 81,500 – 80,000
Resistances 85,200 – 86,600 – 89.000
ETH/USDT
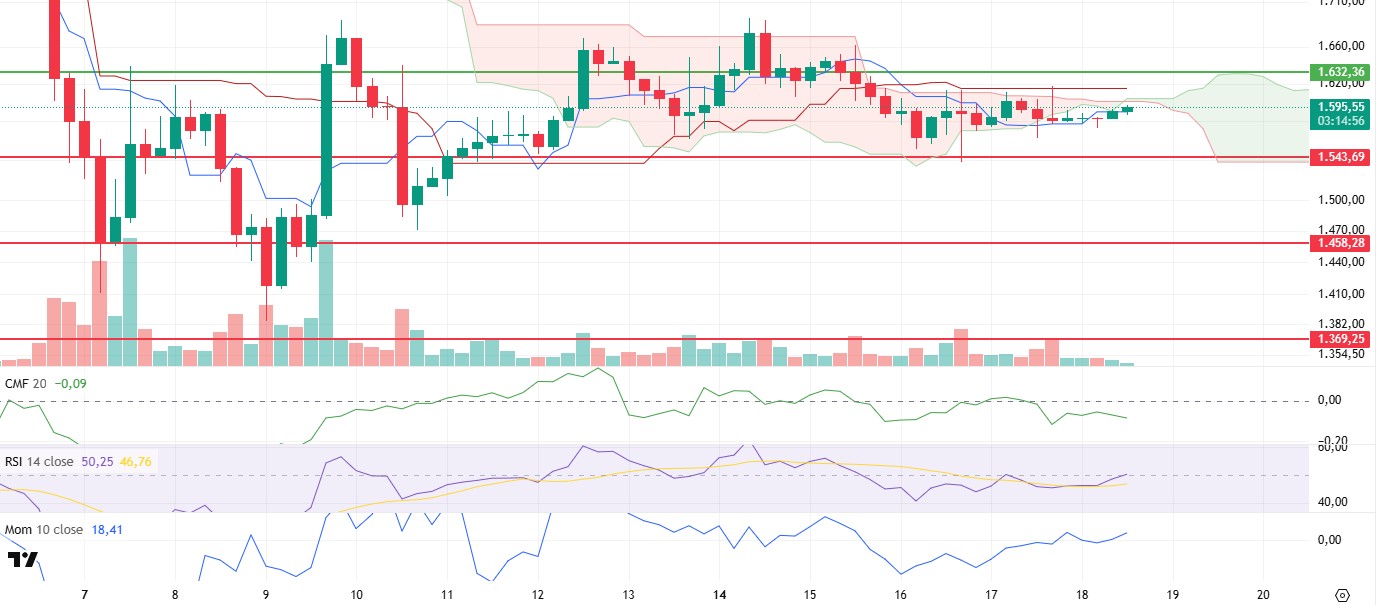
ETH is following a calm and low-volume course due to the closed US markets during the day. While the lack of volume indicates that the market is cautious in general, it is noteworthy that the price has risen to the limits of the kumo cloud. Although this movement seems positive at first glance, it can be said that a strong buying interest to support the rise is missing for now.
There are some mixed signals on the technical side. Especially the Chaikin Money Flow (CMF) indicator seems to be indifferent to the recent rebound of the price. The indicator is still in negative territory and continues to trend downwards. This suggests that buying interest from the spot markets remains weak, so the rally is mostly fueled by positioning in the futures markets. Such a structure is usually not enough for a sustained rally; therefore, a negative CMF is a negative signal in the short term. On the Ichimoku indicator side, there is a slightly more promising picture. The price has crossed the tenkan level and has risen to the limits of the kumo cloud. However, what should be noted here is that this rise is not yet supported by sufficient volume. As long as the volume remains low, a rejection from the cloud boundary is likely to pull the price down again. So, while the current bullish attempt is technically meaningful, it does not inspire confidence. On the other hand, there is an upward trend in the Relative Strength Index (RSI) and momentum indicators. These indicators show that the market has not yet given up and is trying to gather some strength. In particular, the acceleration in momentum suggests that buyers are not completely lost and are looking for an opportunity. However, in order for these positive signals to gain continuity, other indicators should also provide support.
To summarize, there is an indecisive mood in the market at the moment. The fact that the CMF remains in negative territory and the price is rising without volume suggests caution. But at the same time, RSI and momentum are starting to generate positive signals, reminding us that an upside move should not be completely ruled out. If the price manages to break through the kumo cloud resistance in the coming hours and the CMF rebounds in the meantime, ETH could make a move towards the 1,632 level. In a contrary scenario, the price is more likely to retrace back towards the support at 1,543.
Supports 1,543 – 1,458 – 1,369
Resistances 1,632 – 1,756 – 1,925
XRP/USDT
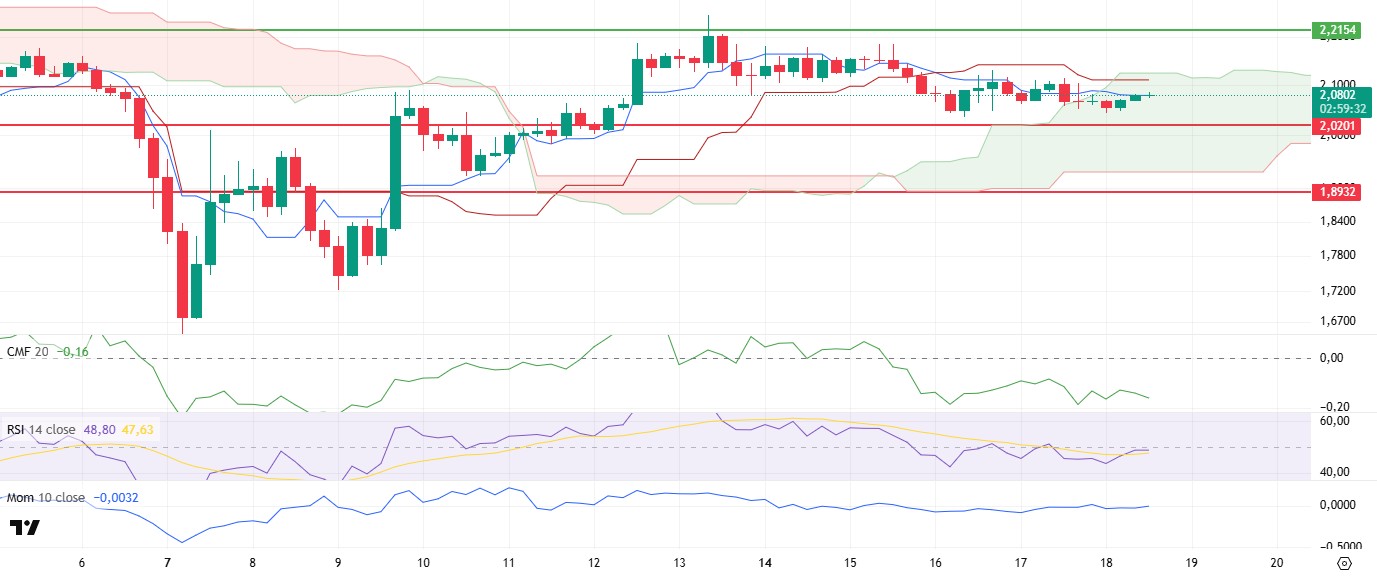
XRP rose slightly during the day on low volumes, breaking above the 2.08 level and settling above the tenkan line. This technical move can be considered a positive signal in the short term, as the break above the tenkan level, especially in the ichimoku indicator, reflects the price’s effort to stay above the short-term averages. However, despite the rise, the ongoing weakness in some key indicators raises questions about the permanence of this move.
The outlook for the Chaikin Money Flow (CMF) indicator is remarkable in this regard. The indicator remains in negative territory and has turned downwards. This suggests that despite the rally, there is no new spot liquidity flowing into the market and the price is being pushed higher mostly through positions in futures markets. The lack of support from the spot side suggests that the uptrend is not on a healthy footing. Therefore, if CMF continues to behave in this way, it could provide resistance to XRP’s short-term upward movement. On the Ichimoku indicator, the price still remains in the kumo cloud. This indicates that the direction is not clear and the market is still in the decision phase. Prices moving in the cloud usually signal uncertainty, while the regain of the tenkan line suggests that the price intends to rebound in the short term. However, it should be noted that this positive move is not backed by strong momentum. On the other hand, the recovery in Relative Strength Index (RSI) and momentum indicators stand out as positive signals on the technical side. Both indicators have started to show an upward trend again after the recent declines. This means that the selling pressure in the market has eased somewhat and buyers have started to re-engage. The increase in momentum, especially on the momentum side, suggests that the price’s desire to continue its upward movement is technically starting to form a force behind it.
In line with this outlook, it is possible that the price may continue its upward movement in the short term. The regain of the Tenkan line and the recovery in RSI and momentum indicators support this move. However, weakness on the CMF side and still low volume suggest that this upside may be fragile. If the price retests the support at 2.02 and breaks this area, the risk of a deeper downside move may be on the agenda. This could pave the way for a steeper correction.
Supports 2.0201- 1.8932 – 1.6309
Resistances 2.2154 – 2.3938 – 2.4721
SOL/USDT
According to Foresight News, DefiLlama’s data shows that Solana’s market capitalization of stable tokens has reached an all-time high of $12.73 billion.
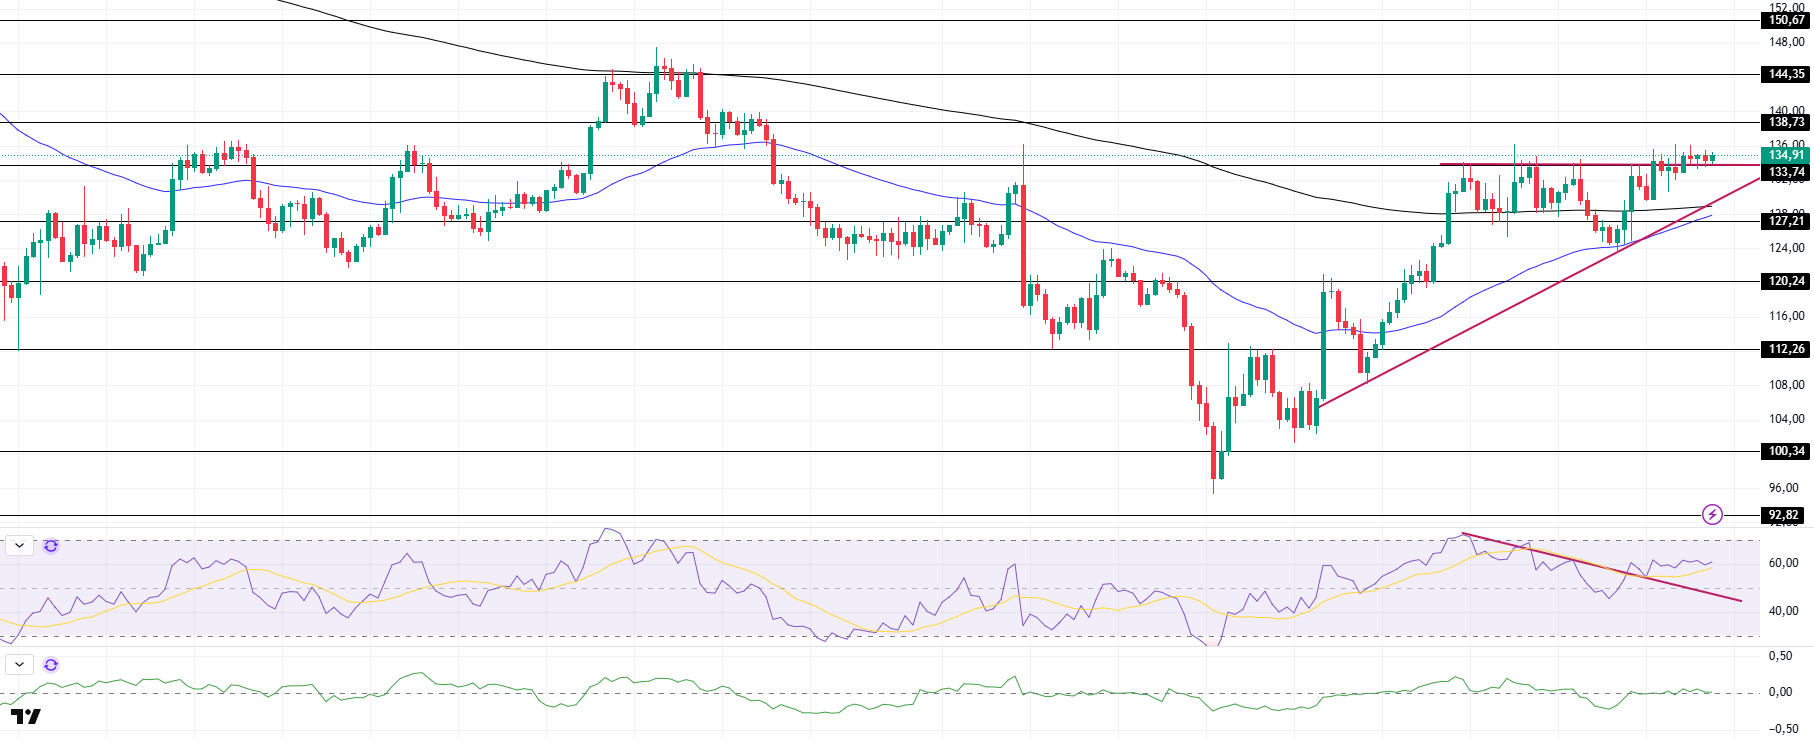
SOL moved sideways during the day. The asset is currently testing the $133.74 level, the resistance of the ascending triangle pattern, as support. If it accelerates from here, the $144.35 level appears as a strong resistance. On the 4-hour timeframe, the 50 EMA (Blue Line) continued to be below the 200 EMA (Black Line). This could continue the decline in the medium term. At the same time, the price continues to move above the two moving averages. This shows that there is buying pressure in the market. When we analyze the Chaikin Money Flow (CMF)20 indicator, it is at a neutral level. However, the negative daily volume may move CMF to the negative area. Relative Strength Index (RSI)14 broke the downtrend that started on April 12 to the upside and continues to be above the downtrend. This may increase buying pressure. The $144.35 level appears as a resistance point in the rises driven by the upcoming macroeconomic data and the news in the Solana ecosystem. If it breaks here, the rise may continue. In case of retracements for the opposite reasons or due to profit sales, the support level of $127.21 can be triggered. If the price comes to these support levels, a potential bullish opportunity may arise if momentum increases.
Supports 133.74 – 127.21 – 120.24
Resistances 138.73 – 144.35 – 150.67
DOGE/USDT
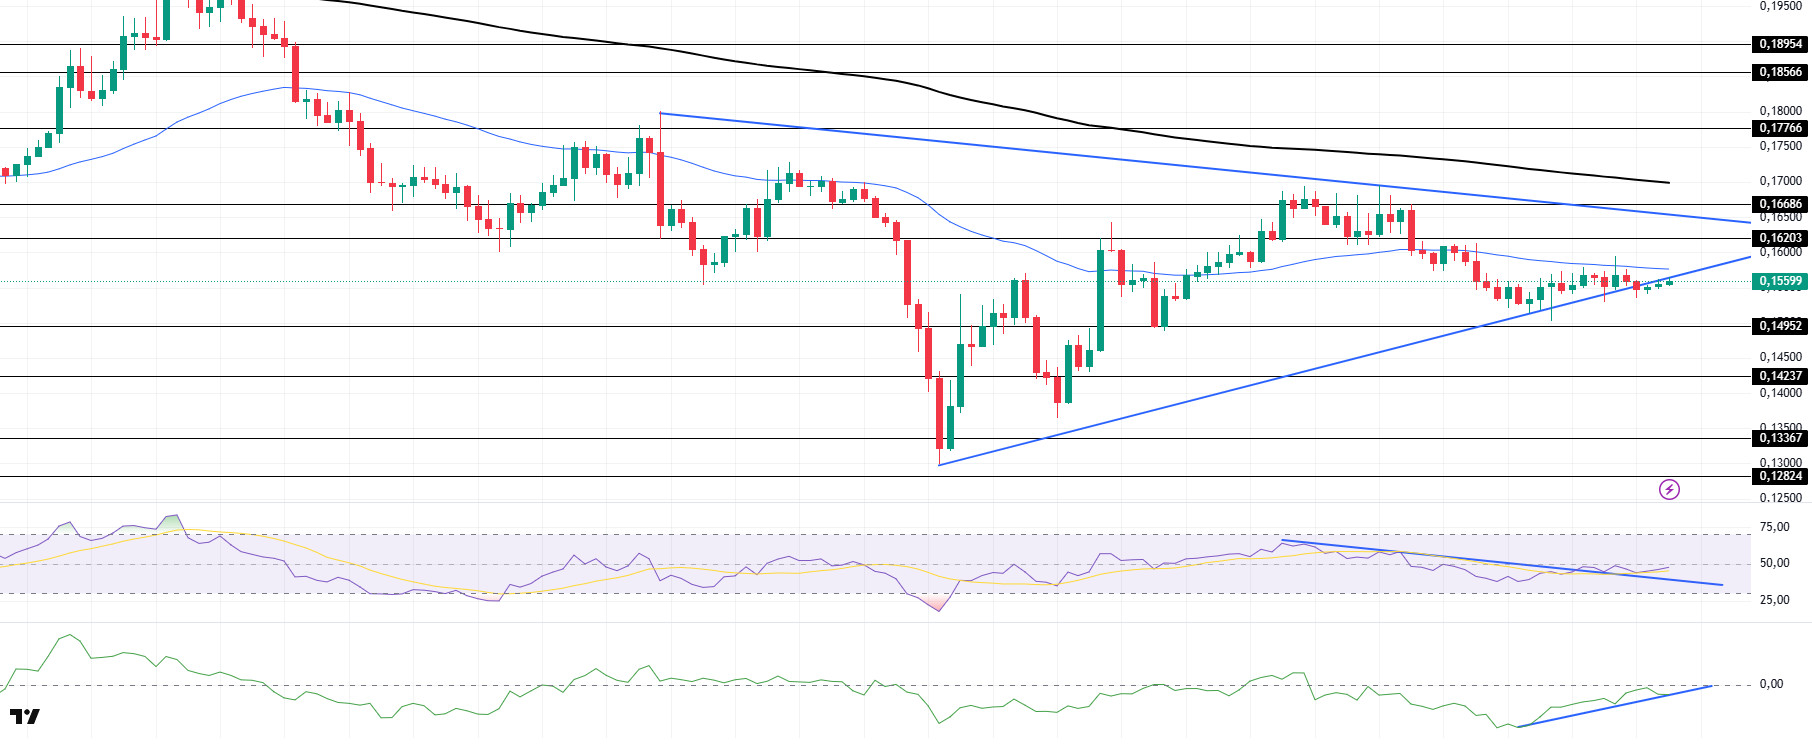
DOGE continues to move sideways during the day. The asset is testing the support of the symmetrical triangle pattern as resistance. If it fails to break here, the $0.14952 level may test as support. On the 4-hour timeframe, the 50 EMA (Blue Line) continues to be below the 200 EMA (Black Line). This could mean that the decline could continue in the medium term. However, the price continued to price below the two moving averages. This shows us that selling pressure continues. When we examine the Chaikin Money Flow (CMF)20 indicator, it continued to be in the negative zone. In addition, the negative 24-hour volume may bring CMF to the mid-levels of the negative zone. However, it is currently testing the uptrend that started on April 16 as support. On the other hand, Relative Strength Index (RSI)14 was in the negative zone, but it also broke the downtrend that started on April 12 and managed to be above the downtrend. This could be a bullish harbinger. The $0.16686 level stands out as a very strong resistance point in the rises due to political reasons, macroeconomic data and innovations in the DOGE coin. In case of possible retracements due to political, macroeconomic reasons or negativities in the ecosystem, the $0.14952 level, which is a strong support place, is an important support place. If the price reaches these support levels, a potential bullish opportunity may arise if momentum increases.
Supports 0.14952 – 014237 – 0.13367
Resistances 0.16203 – 0.16686 – 0.17766
Legal Notice
The investment information, comments and recommendations contained herein do not constitute investment advice. Investment advisory services are provided individually by authorized institutions taking into account the risk and return preferences of individuals. The comments and recommendations contained herein are of a general nature. These recommendations may not be suitable for your financial situation and risk and return preferences. Therefore, making an investment decision based solely on the information contained herein may not produce results in line with your expectations.
