TECHNICAL ANALYSIS
BTC/USDT
In the US, ADP non-farm payrolls data was announced as 155K, well above the expected 118K. CME reached a notional value of $11.3 billion in the first quarter of 2025 with a daily average of 198,000 crypto derivatives contracts. On the other hand, Indian company Jetking’s plan to raise $780,000 for the purchase of Bitcoin caused controversy on social media, while Trump Media & Technology Group’s 8.4 million share sale and 134 million additional issuance application attracted the attention of investors.
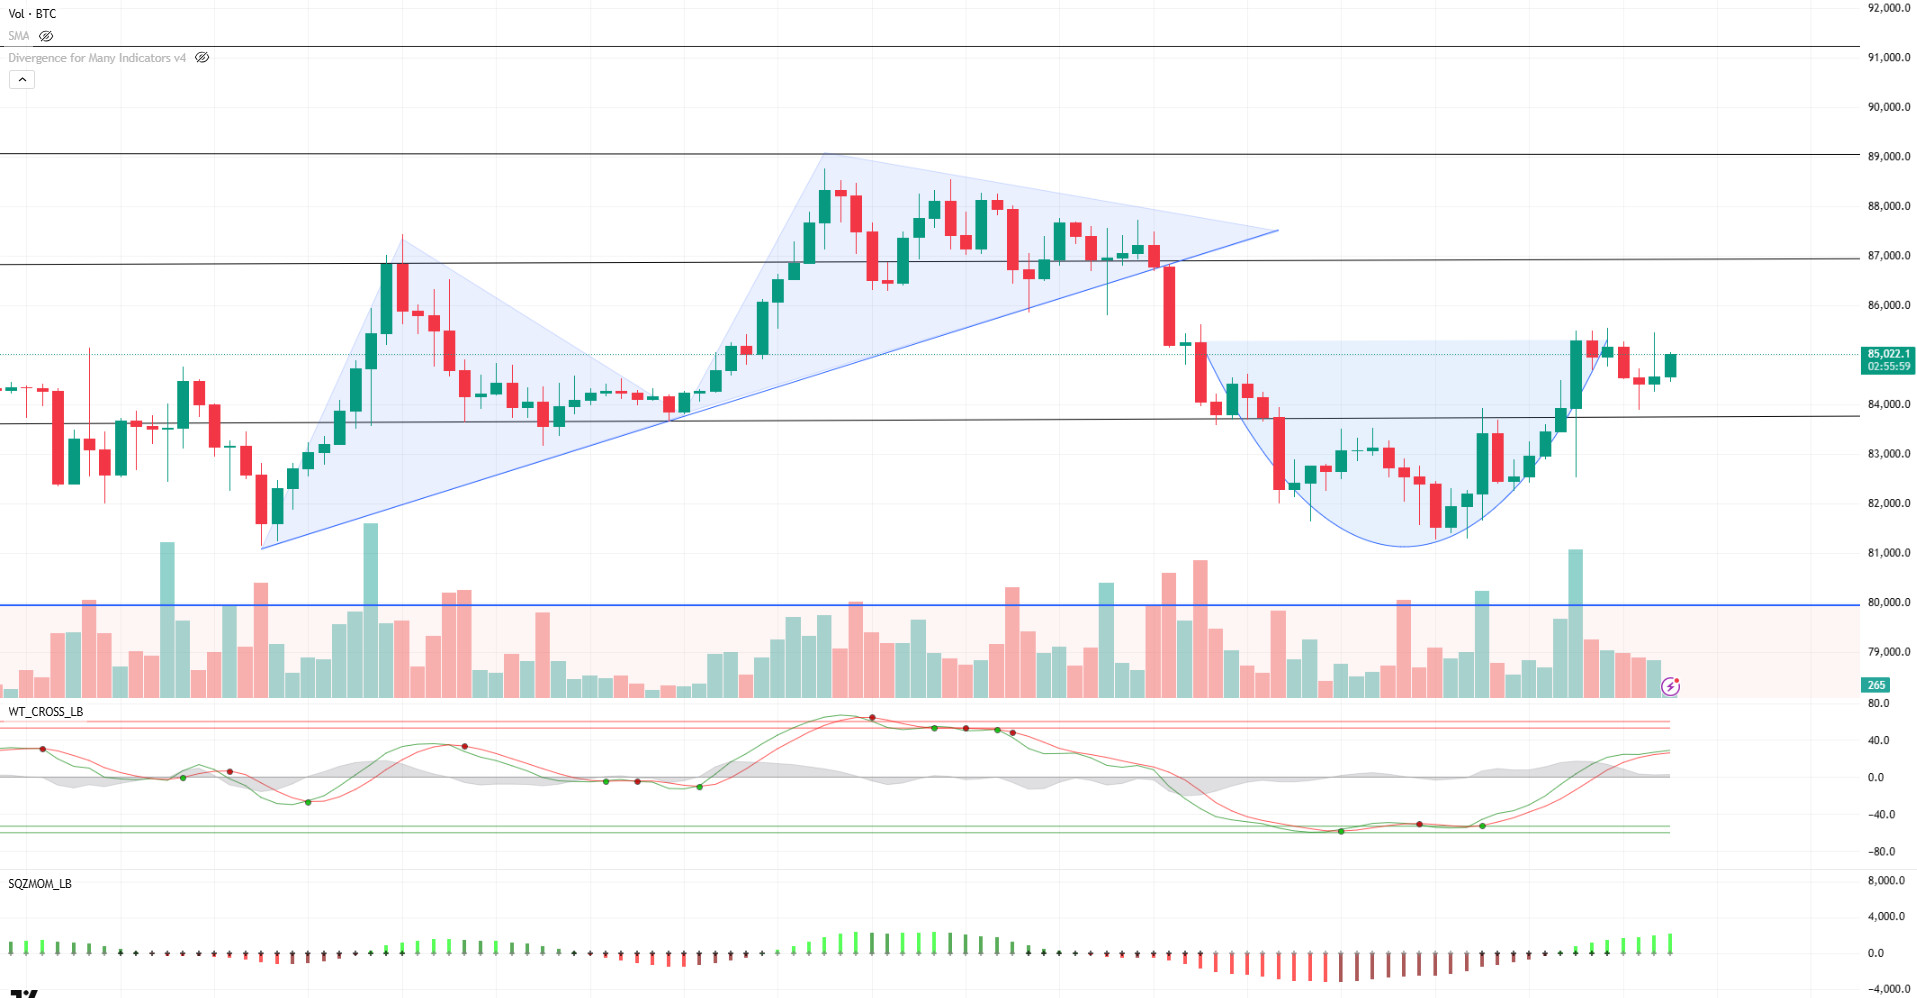
When we look at the technical outlook of BTC, it is seen that there was a pullback to 84,000 during the day, but the price stabilized at 85,000 with low volatility. Technically, BTC, which is in the process of forming a bowl formation, is now trying to complete the handle. On the Wave Trend Oscillator, the buy signal continues to weaken, while the momentum indicator shows a slight strengthening. This shows that although the price is trying to establish an upward balance, the signals do not yet point to a strong trend. Today, on the US side, Donald Trump’s statements on the tariff plan can be expected to create volatility in the market. This development, combined with the technical outlook, makes the 83,500 level a key support point. If this level is broken, the possibility of deepening selling pressure becomes stronger. Looking at the liquidation data, the fact that long trades have not yet accumulated significantly indicates that market uncertainty continues. On the other hand, the intensification of short trades above the 86,000 level indicates that liquidations may move the price up quickly in a possible upward breakout. As a result, the 83,500 – 86,000 band is critical in the short term in technical and psychological terms. Trump’s statements may be the catalyst that will clarify the price direction in this range.
Supports 83,500 – 82,400 – 80,000
Resistances 86,600 – 89,000 – 91,400
ETH/USDT
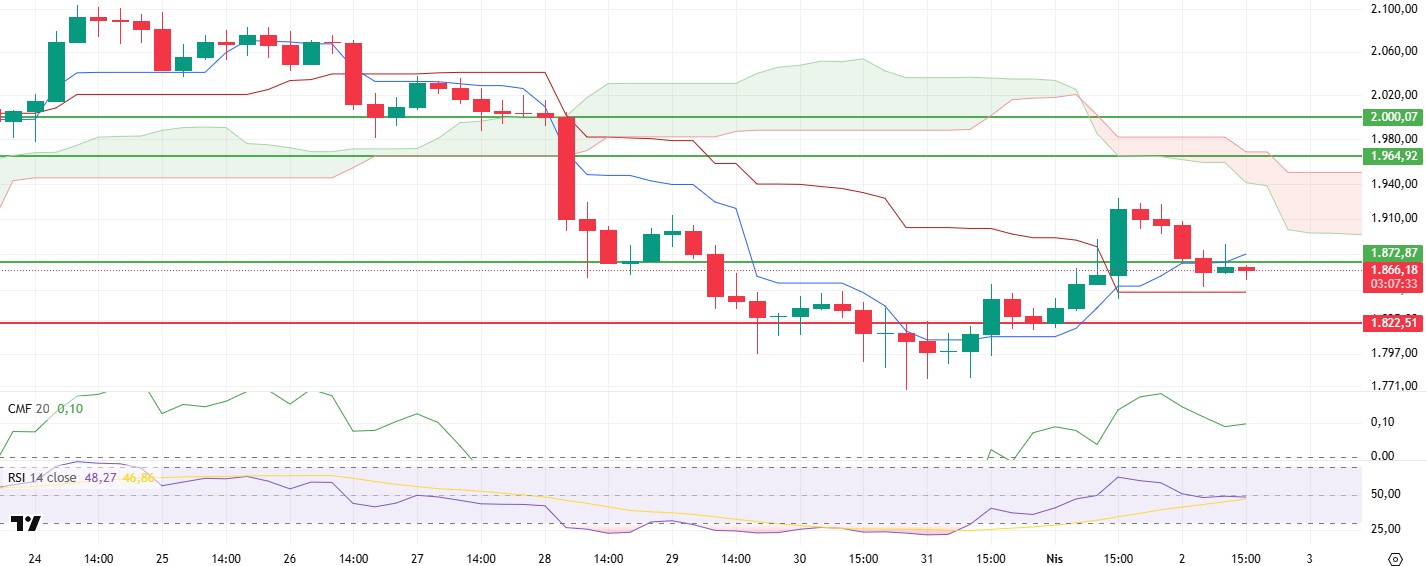
After falling to the tenkan level during the day, ETH reacted as expected and tried to gain the $1,872 level. However, the price remained below this resistance level again as the selling pressure continued. However, some technical indicators are improving in tandem with the price action.
The Chaikin Money Flow (CMF) indicator has regained upward momentum with the recent price movements and liquidity flows seem to be strengthening. This indicates an increased buying interest from market participants and positive capital inflows. At the same time, the Relative Strength Index (RSI) indicator retreated to the base line of the based MA and is likely to react from this level. An upward reversal of the RSI from this level could be an important signal that momentum could regain strength. When the Ichimoku indicator is analyzed, it is seen that the tenkan level is in an uptrend and the convergence of the price to this level supports the positive outlook. While the upward trend of the tenkan level confirms that the short-term trend is upward, the positioning of the price close to this level can be considered as a positive factor in terms of the continuation of upward movements.
These improvements in technical indicators indicate that upward price movements may gain momentum if the $1,872 level is exceeded. However, it should not be overlooked that if the price cannot permanently exceed this level and makes a downward turn from resistance again, selling pressure may increase and cause a retracement towards the $ 1,822 support zone.
Supports 1,822 – 1,755 – 1,540
Resistances 1,872 – 1,964 – 2,000
XRP/USDT
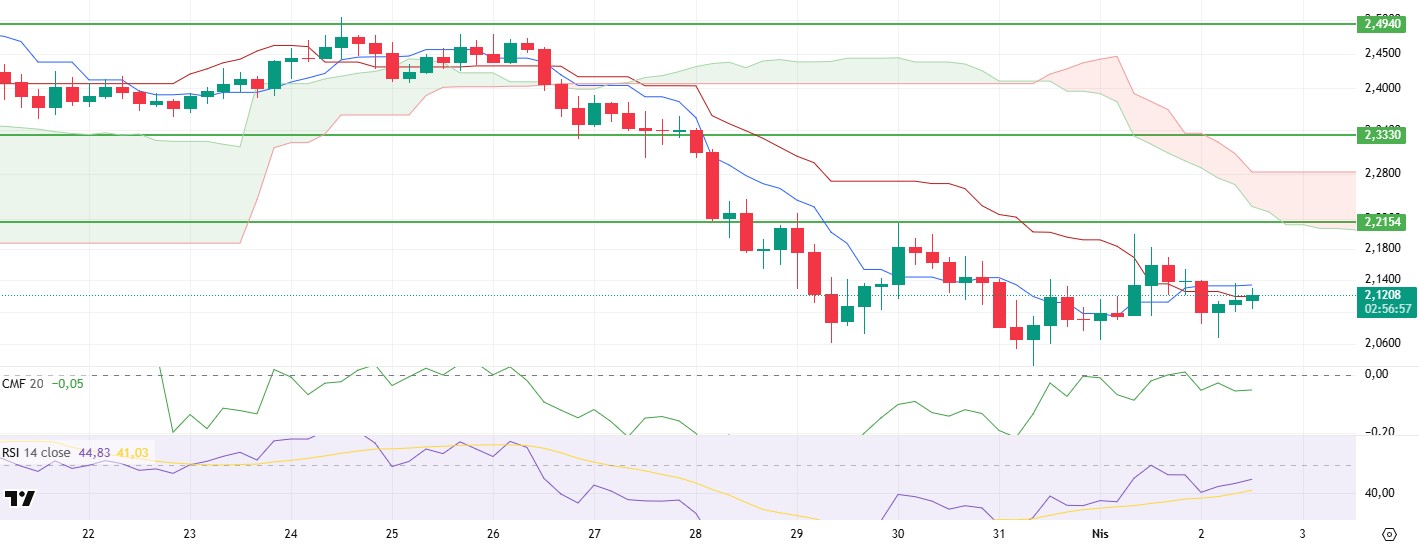
Despite the weaknesses in technical indicators during the day, XRP managed to rise as high as $ 2.13, finding support from $ 2.07 levels with the effect of the general recovery in the crypto market. However, when the dynamics behind the price movement are analyzed, some critical data stand out about the sustainability of the rise.
Technical indicators and on-chain data suggest that the price rally is mainly driven by the Cumulative Volume Delta (CVD) futures market, while spot market support remains relatively weak. While the dominant buying on the futures side indicates that speculative movements are effective, the lack of spot market support may indicate that the rally is not based on solid fundamentals. At the same time, the Chaikin Money Flow (CMF) indicator remains in the negative territory, another important indicator confirming that liquidity entering the market is weak and capital inflows are slowing down. When the Ichimoku indicator is analyzed, the price gaining the kijun level and the tenkan level cutting the kijun level upwards can be considered as a positive technical signal. The Tenkan-Kijun crossover suggests that the short-term bullish momentum is gaining strength and the price may continue to move upwards. In addition, the Relative Strength Index (RSI) reverted to the upside after the recent price decline, indicating that momentum is strengthening and buyers are re-engaging.
In light of this data, with the strengthening of the price and momentum, the regain of the tenkan level may lead to a rise to the $2.21 level in the short term. However, weaknesses in the CMF and CVD indicators suggest that there is not enough buying power to sustain the price’s upward movement. Therefore, if the price fails to hold at the $2.13 level and bounces back from the resistance, selling pressure may increase, causing the price to retreat to the $2.02 support level.
Supports 2.0201 – 1.8932 – 1.6309
Resistances 2.2154 – 2.3330 – 2.4940
SOL/USDT
North Korean cyber operators’ threats against Solana-based crypto projects are increasing. On the other hand, Pump Fun launched PumpFi to fund memecoin and NFTs.
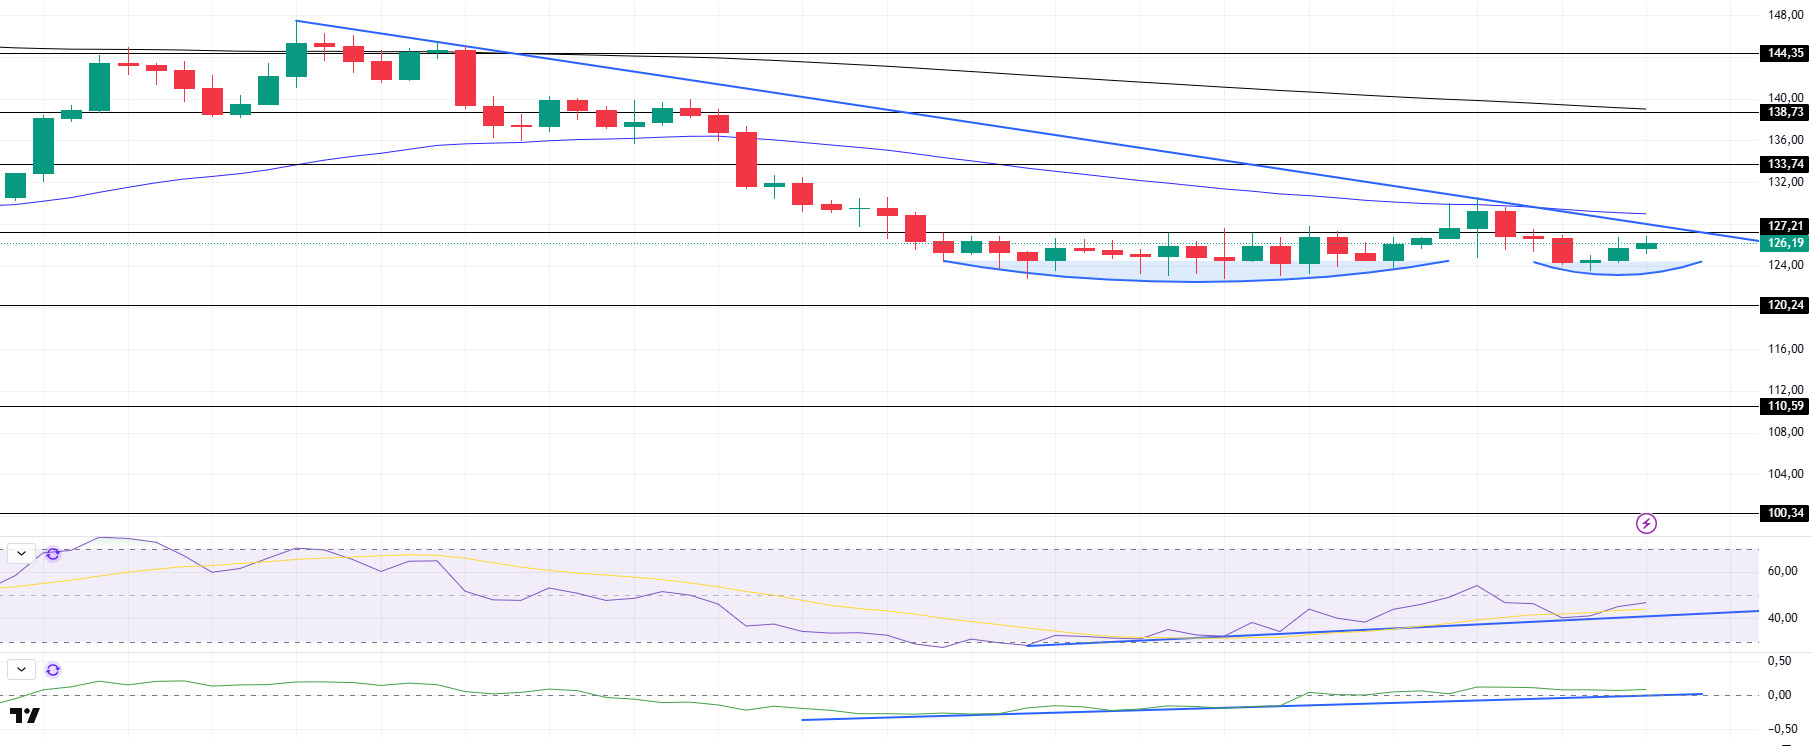
SOL has been slightly bullish since our morning analysis. The asset continued to maintain the downtrend that started on March 25. It is currently accelerating towards testing the downtrend. At the same time, the double bottom pattern should be taken into consideration. On the 4-hour timeframe, the 50 EMA (Blue Line) remained below the 200 EMA (Black Line). This could deepen the decline further in the medium term. At the same time, the price is moving below the two moving averages again. When we analyze the Chaikin Money Flow (CMF)20 indicator, it is in the positive zone, but the negative daily volume indicates that CMF has a high potential to move into the negative zone. On the other hand, the uptrend that started on March 29 continues in our CMF indicator. However, the Relative Strength Index (RSI)14 indicator retreated to the mid-level of the negative zone. However, it remained above the uptrend that has formed since March 29. This could be a bullish harbinger. The $ 138.73 level appears as a resistance point in the rises driven by the upcoming macroeconomic data and the news in the Solana ecosystem. If it breaks here, the rise may continue. In case of retracements due to the opposite reasons or profit sales, the support level of $ 120.24 can be triggered. If the price comes to these support levels, a potential bullish opportunity may arise if momentum increases.
Supports 120.24 – 110.59 – 100.34
Resistances 127.21 – 133.74 – 138.73
DOGE/USDT
Despite a 25% monthly price drop, whales bought over $37 million worth of DOGE.
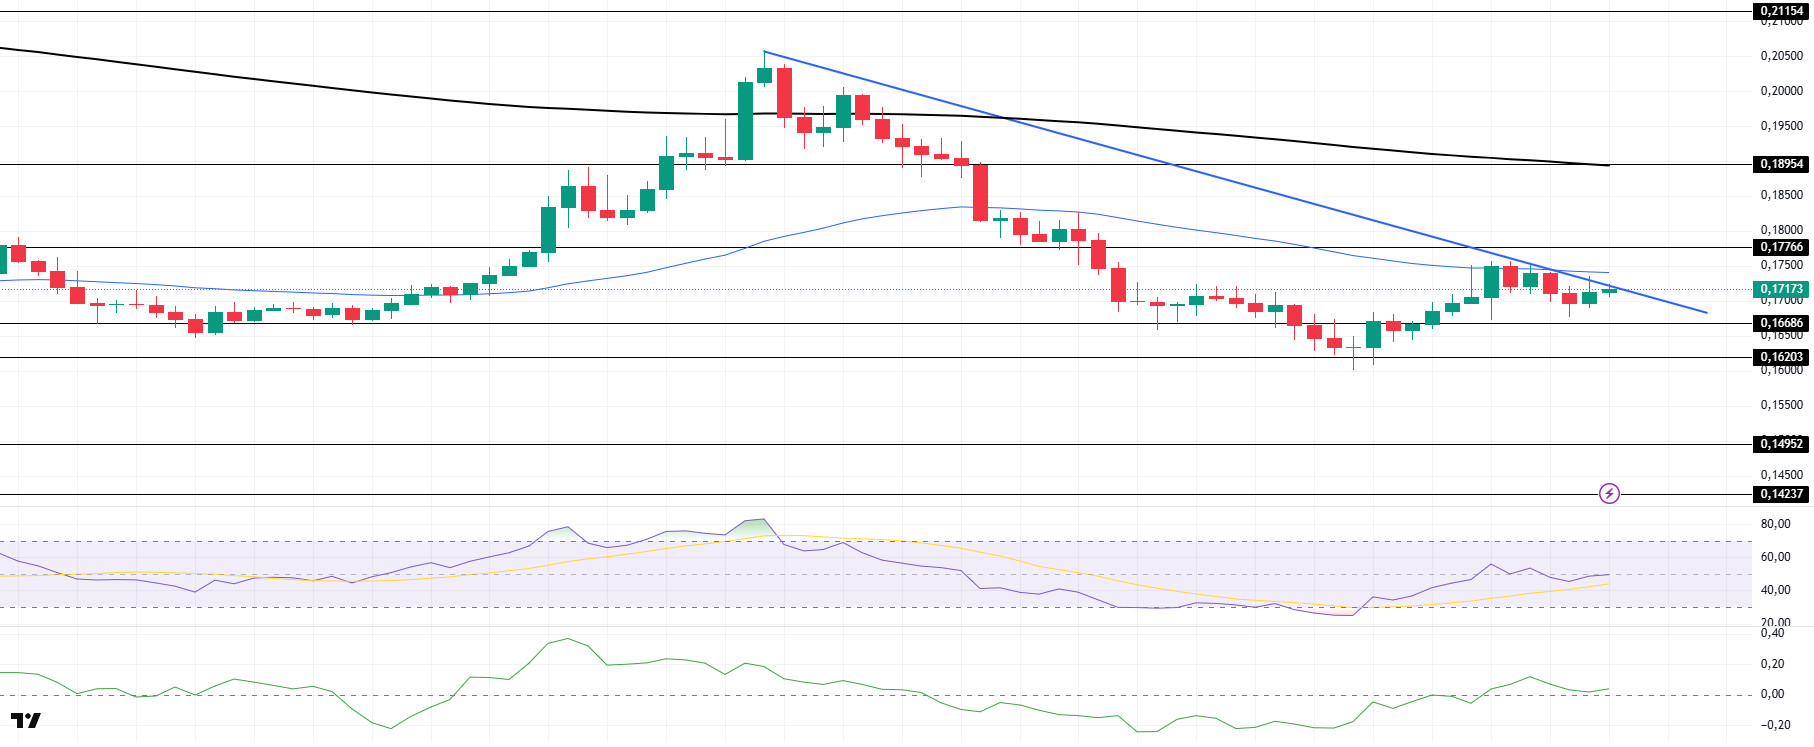
DOGE has been slightly bullish since our morning analysis. The asset is currently testing the downtrend that started on March 26. If it breaks here, it could test the 50 EMA (Blue Line). If it fails to break the resistance, it may test the strong support at $0.16203. On the 4-hour timeframe, the 50 EMA (Blue Line) continues to be below the 200 EMA (Black Line). This could mean that the decline could deepen in the medium term. However, the price continues to price below the two moving averages. The Chaikin Money Flow (CMF)20 indicator is in positive territory. In addition, the negative 24-hour volume may reduce inflows and cause CMF to move into negative territory. On the other hand, Relative Strength Index (RSI)14 accelerated from negative to neutral territory and the selling pressure has disappeared. The $0.18954 level stands out as a very strong resistance point in the rises due to political reasons, macroeconomic data and innovations in the DOGE coin. In case of possible retracements due to political, macroeconomic reasons or due to negativities in the ecosystem, the $ 0.16203 level, which is a strong support place, is an important support place. If the price reaches these support levels, a potential bullish opportunity may arise if momentum increases.
Supports 0.16686 – 0.16203 – 014952
Resistances 0.17766 – 0.18954 – 0.21154
Legal Notice
The investment information, comments and recommendations contained herein do not constitute investment advice. Investment advisory services are provided individually by authorized institutions taking into account the risk and return preferences of individuals. The comments and recommendations contained herein are of a general nature. These recommendations may not be suitable for your financial situation and risk and return preferences. Therefore, making an investment decision based solely on the information contained herein may not produce results in line with your expectations.


