
TECHNICAL ANALYSIS
BTC/USDT
With rising concerns over interest rates in the US and the Fed’s independence, investors are turning to safe havens. In this environment, gold tested new record highs, while Bitcoin reached its highest level since early April. Strong inflows into spot BTC ETFs suggest that institutional investors are returning to the market. At the same time, the increase in bullish positions in the options market reveals that market sentiment has turned positive. All these developments indicate that Bitcoin has strengthened its safe-haven role both during periods of macroeconomic uncertainty and by differentiating from other risky assets.
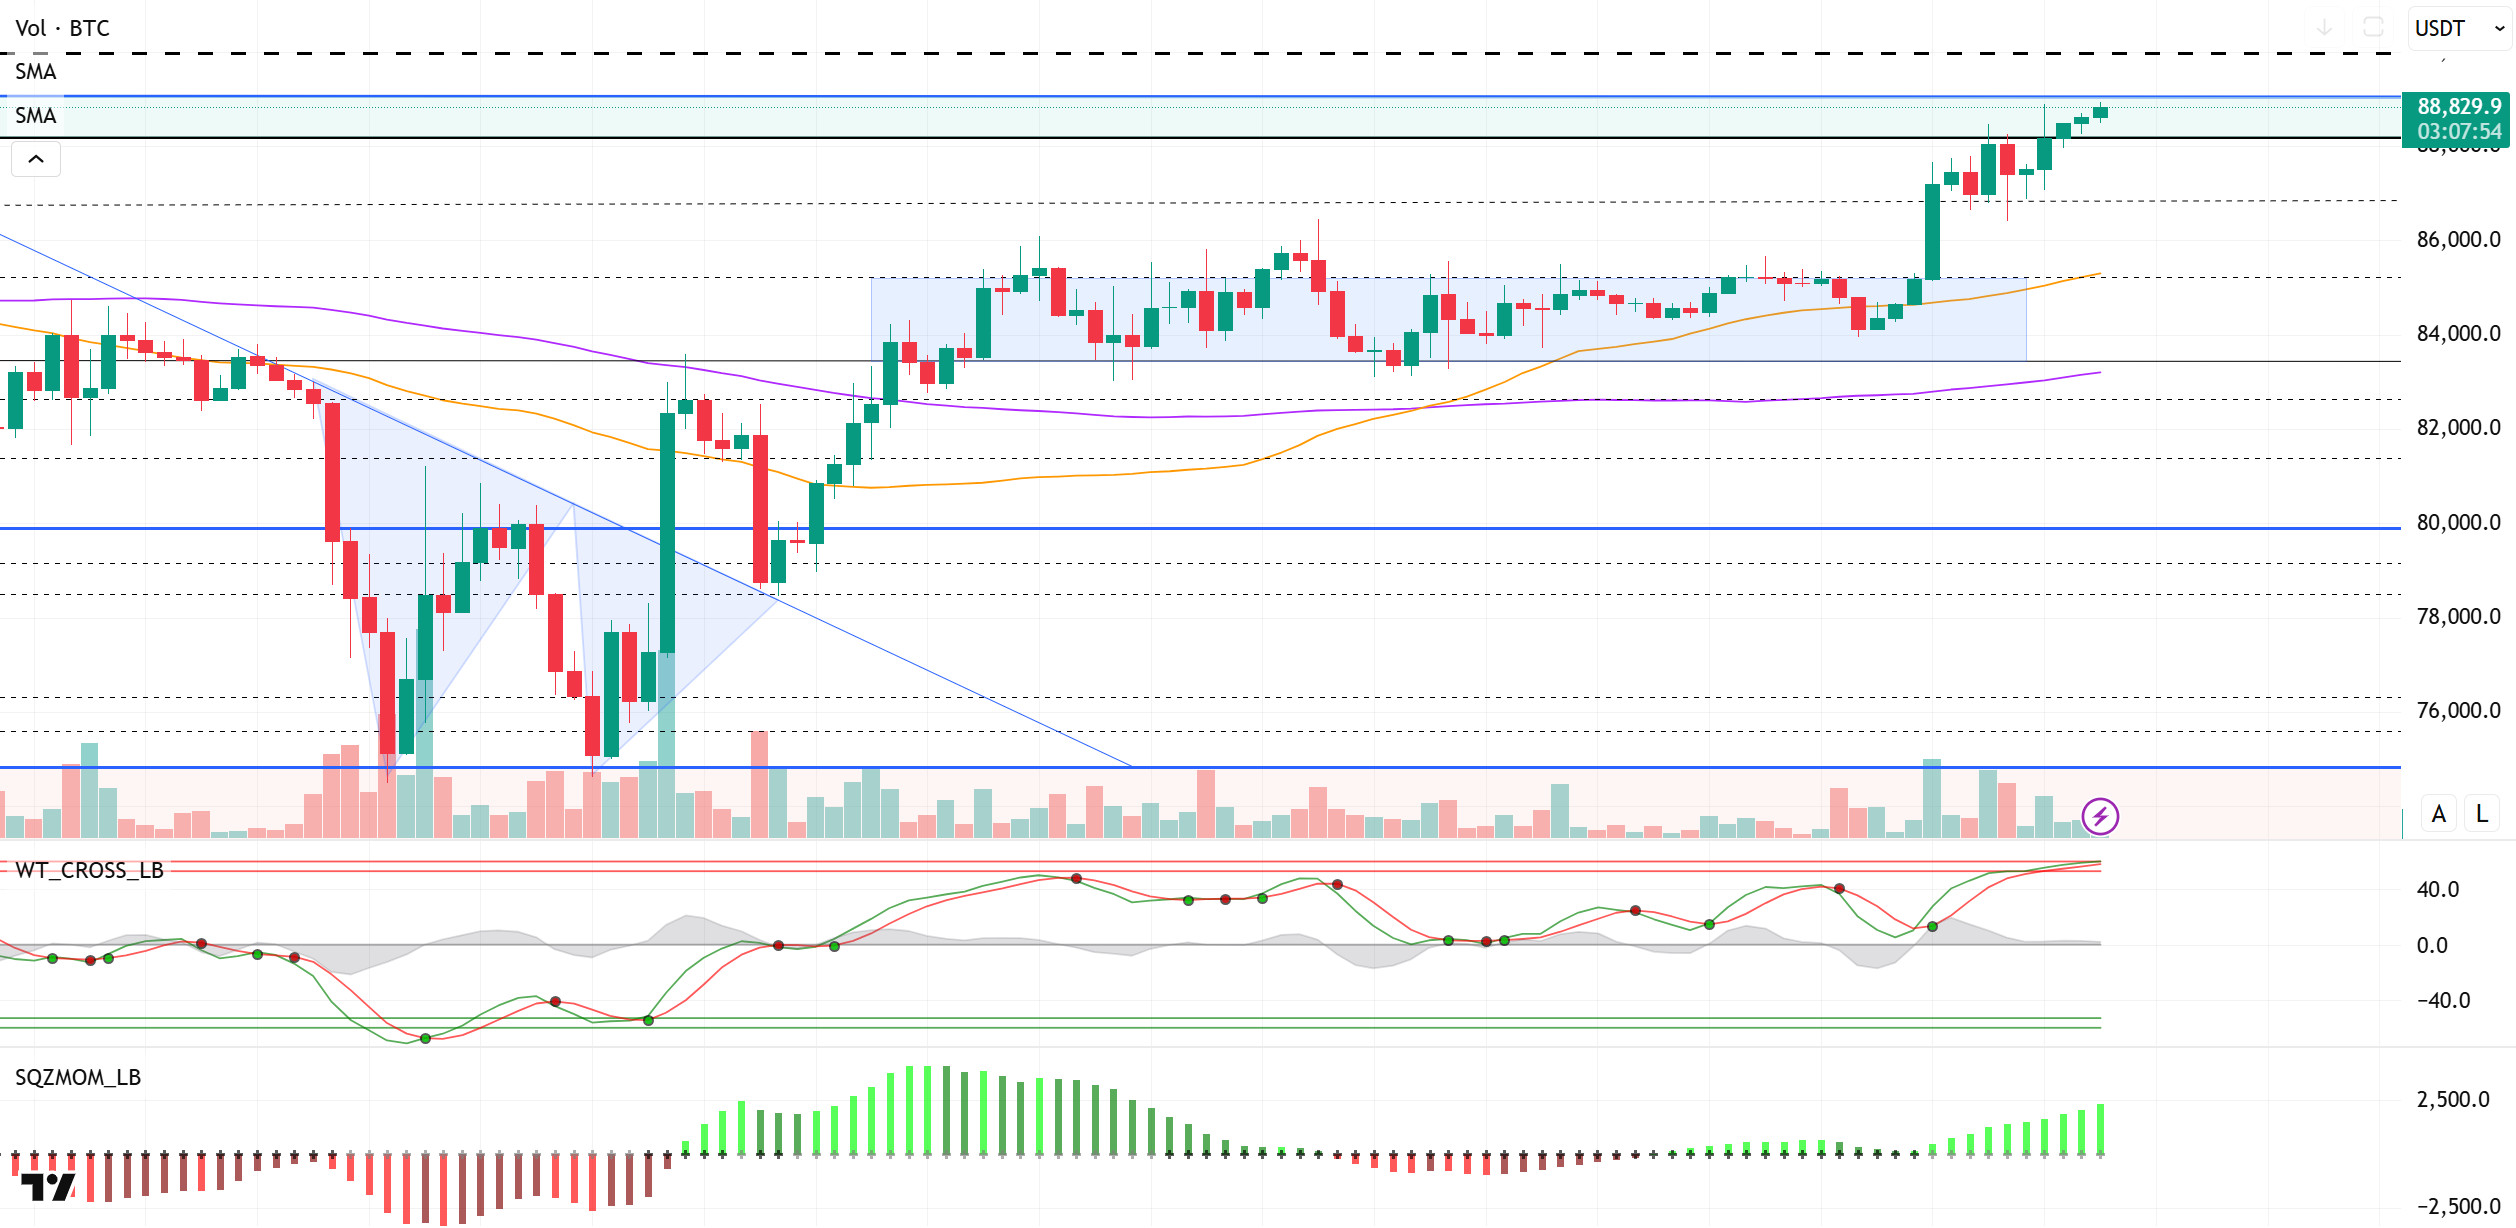
Looking at the technical outlook, compared to the previous analysis, BTC has made two 4-hour closes within the 88,000-89,000-resistance band and has maintained steady price action. At the time of writing, BTC continues to trade within the green band range at 88,700. Although strong closes in this area raise the possibility that a technically important resistance zone may now turn into support, technical oscillators have reached the overbought zone and are signaling weakening buying at this point. However, momentum indicators are still maintaining their upward momentum, suggesting that the upside is not technically exhausted, but caution is warranted. The price’s strong hold in this area can be directly attributed to the acceleration in momentum, the increase in risk appetite and the re-entry of institutional investors through ETFs. All these developments make BTC stand out as a safe-haven asset, just like gold. The continuation of the positive trend in futures trading with the opening of the US markets could be the catalyst that could move the BTC price to 91,800 levels, regardless of technical signals. This threshold stands out as the next target in both psychological and technical terms. However, as usual, statements from the Trump front, especially possible rhetoric against Powell, have the potential to change market perception. Such developments may create reverse trading opportunities for technical indicators to start working again and trigger a possible correction.
Supports 86,600 – 85,200 – 83,500
Resistances: 88,100 – 89,000 – 91,800
ETH/USDT
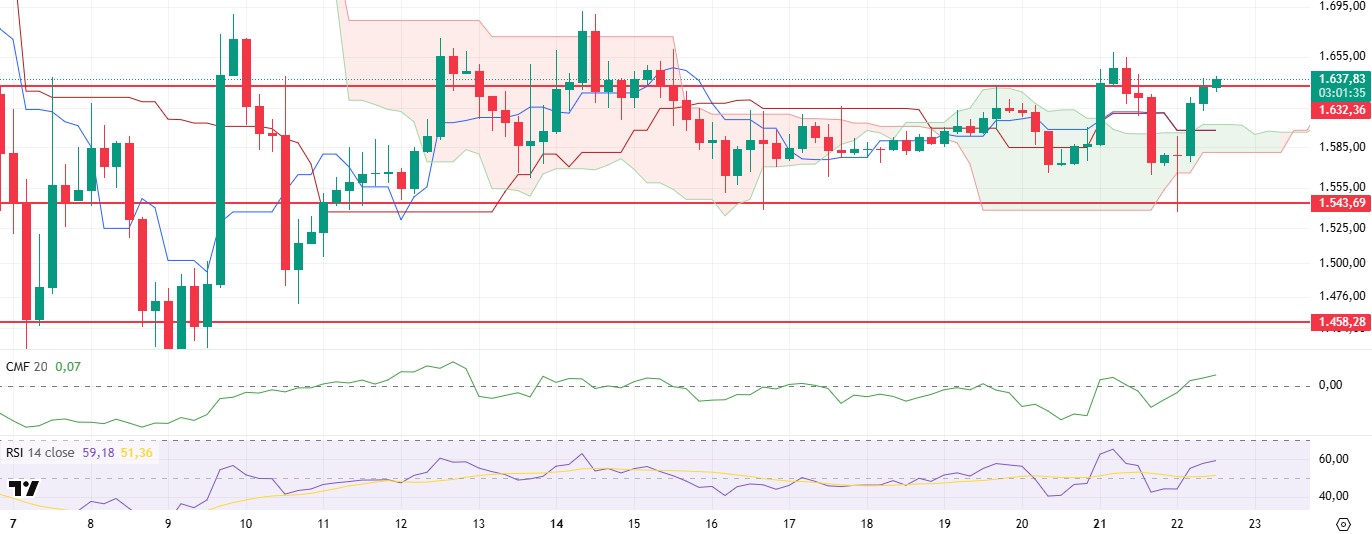
ETH managed to rise to the level of $ 1,632, following an upward trend during the day with the support of positive signals in the technical indicators highlighted in the morning analysis. In particular, the price exceeding the upper limit of the kumo cloud can be considered as a positive technical breakthrough. While this move stood out as a reassuring factor for investors, the harmonious structure of various indicators behind the upward trend that continued throughout the day attracted attention.
The Chaikin Money Flow (CMF) indicator briefly slipped into negative territory amid the previous day’s selling pressure, but quickly recovered and switched to positive territory. This indicates the impact of buyers re-entering the market and increasing capital inflows. CMF remains in positive territory, confirming the liquidity support underlying the uptrend. On the other hand, the Relative Strength Index (RSI) is also maintaining its upward momentum with support from the morning lows. The RSI’s rise near the neutral level suggests that the price has not yet entered the overbought zone in technical terms, but is on a strong recovery trend. On the Ichimoku indicator, the fact that the price moved back above the kumo cloud and at the same time persisted above the tenkan and kijun levels presents a very positive structure in terms of the overall technical outlook. In particular, this movement above the cloud indicates that the price has overcome short and medium-term resistance levels and the confidence of market participants has been restored. Such structural transitions of the Ichimoku increase the potential for the price to continue the uptrend.
In general assessment, the fact that the price both rose above the kumo cloud and broke through an important resistance level of $ 1,632 indicates that the upward movement may continue in the evening hours. However, in the event of a failure to persist above this level and a possible close below $1,632, a weakening in the technical outlook may occur, which may cause the price to retreat back to the limits of the kumo cloud. In this scenario, it is important to monitor short-term support levels.
Supports 1,632 – 1,543 – 1,458
Resistances 1,756 – 1,925 – 2,131
XRP/USDT
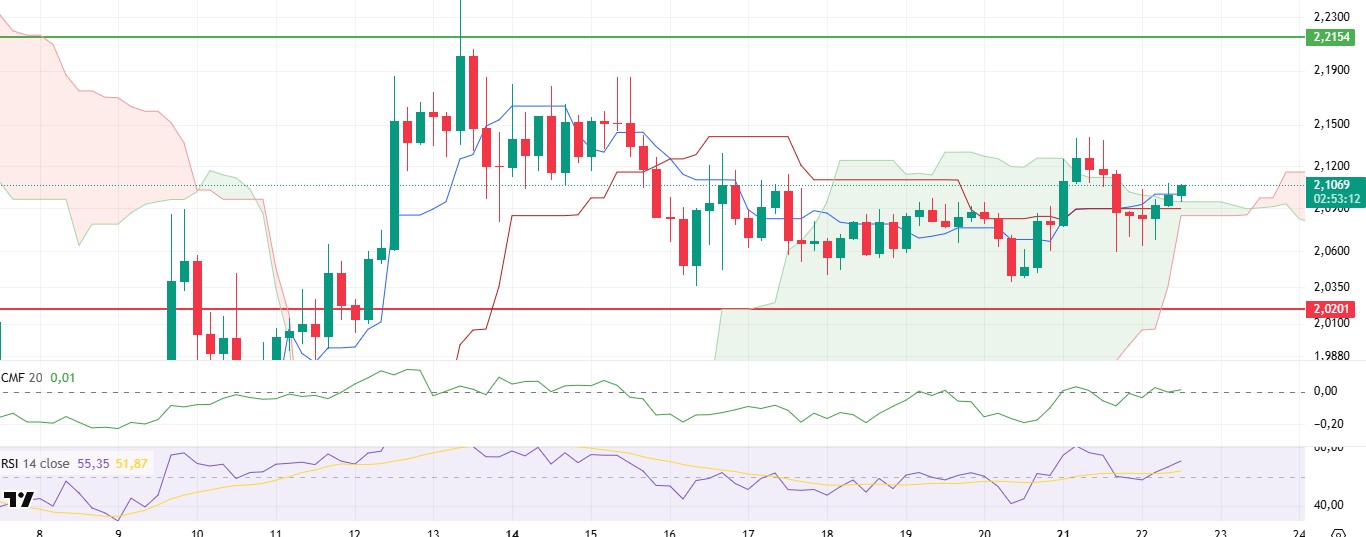
As mentioned in the morning analysis, XRP failed to perform in line with the general bullish trend observed in the cryptocurrency market during the day due to the weak outlook in technical indicators and was limited to a more horizontal price movement. Although the price managed to break out of the kumo cloud during the day, it could not gain upward momentum with the resistance it encountered at the tenkan level and could not clearly break out of the narrow band range in which it is still consolidated. This suggests that buying decisions in the market are not clear and participants remain cautious.
The Chaikin Money Flow (CMF) indicator hovering close to the zero zone indicates that liquidity flows in the market are quite weak and a strong buying appetite has not yet emerged. This kind of stagnation points to a lack of capital inflows, which are critical to support upward movements, and reveals that the lack of volume-based confidence continues in the current conditions. On the other hand, the Relative Strength Index (RSI) indicator, after a short-lived decline in the morning hours, continues its recovery trend by breaking the based MA line upwards again. This breakout of the RSI suggests that the price has started to move away from the oversold territory and is trying to regain its upside momentum. Looking at the Ichimoku indicator, the price crossed the tenkan line and started to settle above the kumo cloud, indicating that a positive structure may be forming in the technical outlook. Such structures could set the stage for the start of a potential uptrend, especially if short-term resistance levels are breached. However, for this scenario to be strongly supported, the CMF indicator should also move into positive territory, confirming the buying pressure. In the event that CMF starts to show an upward trend, the harmony between technical indicators will put the upward movement of the price on more solid foundations.
In this context, in an environment where indicators are generally evolving towards a positive structure, but CMF still does not accompany this picture, the $2.21 level stands out as a potential target if the price realizes an upward breakout. On the other hand, the $2.09 level remains important as an intermediate support point. If this level is breached downwards, there may be a risk that the price may retreat to the $2.02 level. In such a scenario, the market is likely to seek a rebalance.
Supports 2.0201- 1.8932 – 1.6309
Resistances 2.2154 – 2.3938 – 2.4721
SOL/USDT
Whale wallets increased, rising from 4,943 to 5,019.
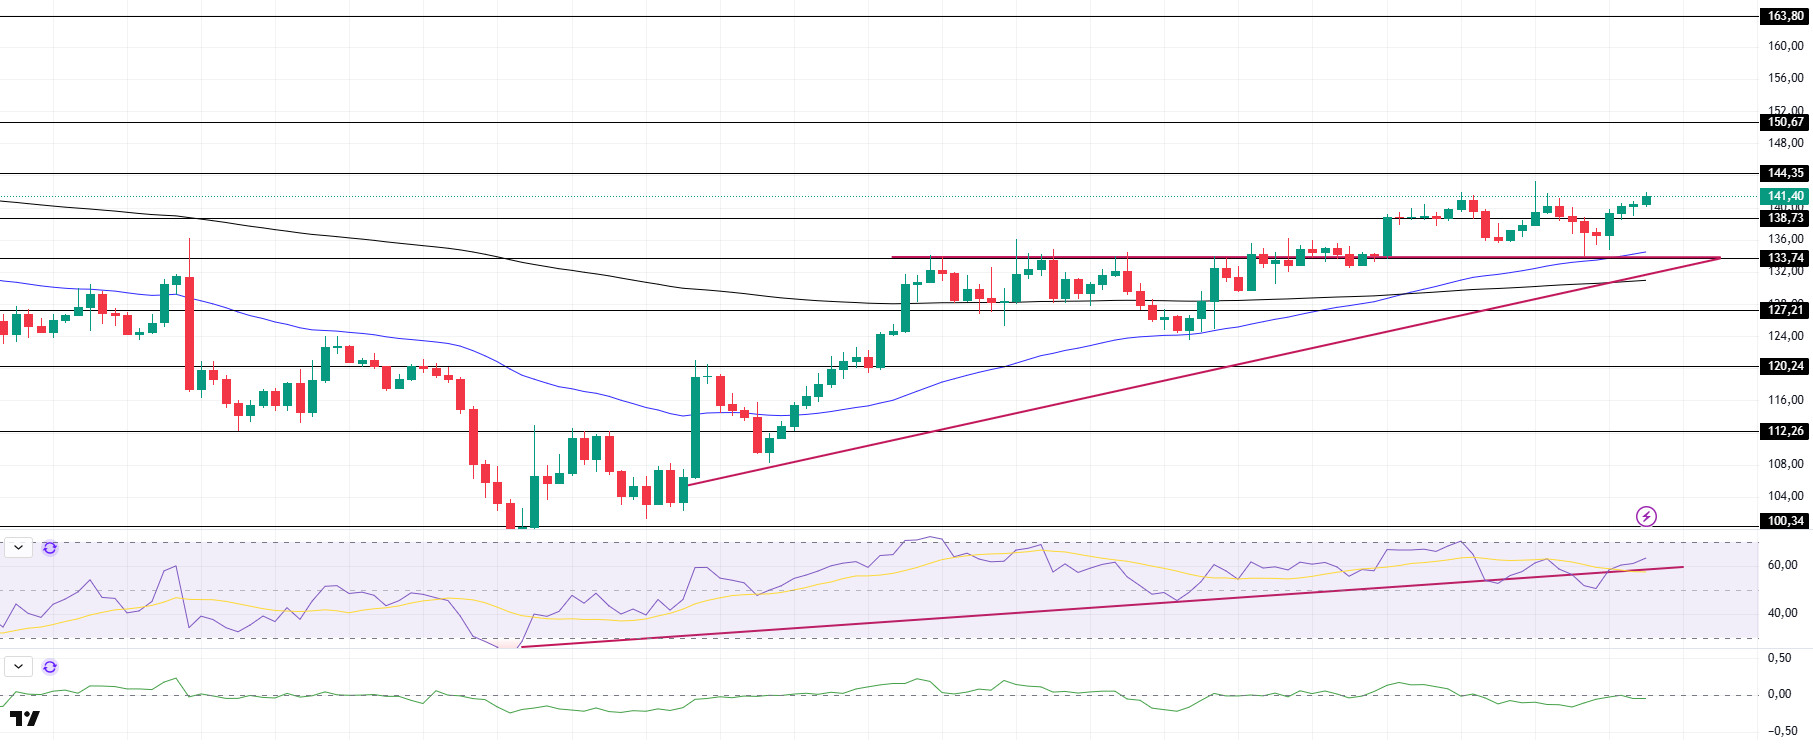
SOL continued to move during the day. The asset regained momentum as it broke the resistance level of $133.74, which was the resistance of the ascending triangle pattern, and broke the resistance level of $138.73, making it a support. On the 4-hour timeframe, the 50 EMA (Blue Line) continues to hover above the 200 EMA (Black Line). This could be a bullish start in the medium term. At the same time, the price remained above the two moving averages. This suggests that there is buying pressure in the market. When we examine the Chaikin Money Flow (CMF)20 indicator, it is at a negative level. However, the positive daily volume may move CMF to the positive area. Although Relative Strength Index (RSI)14 managed to rise back above the uptrend that started on April 7, the selling pressure has not yet passed. The $150.67 level appears as a resistance point in the rises driven by the upcoming macroeconomic data and the news in the Solana ecosystem. If it breaks here, the rise may continue. In case of pullbacks for the opposite reasons or due to profit sales, the support level of $ 133.74 may be triggered. If the price hits these support levels, a potential bullish opportunity may arise if momentum increases.
Supports 138.73 – 133.74 – 127.21
Resistances 144.35 – 150.67 – 163.80
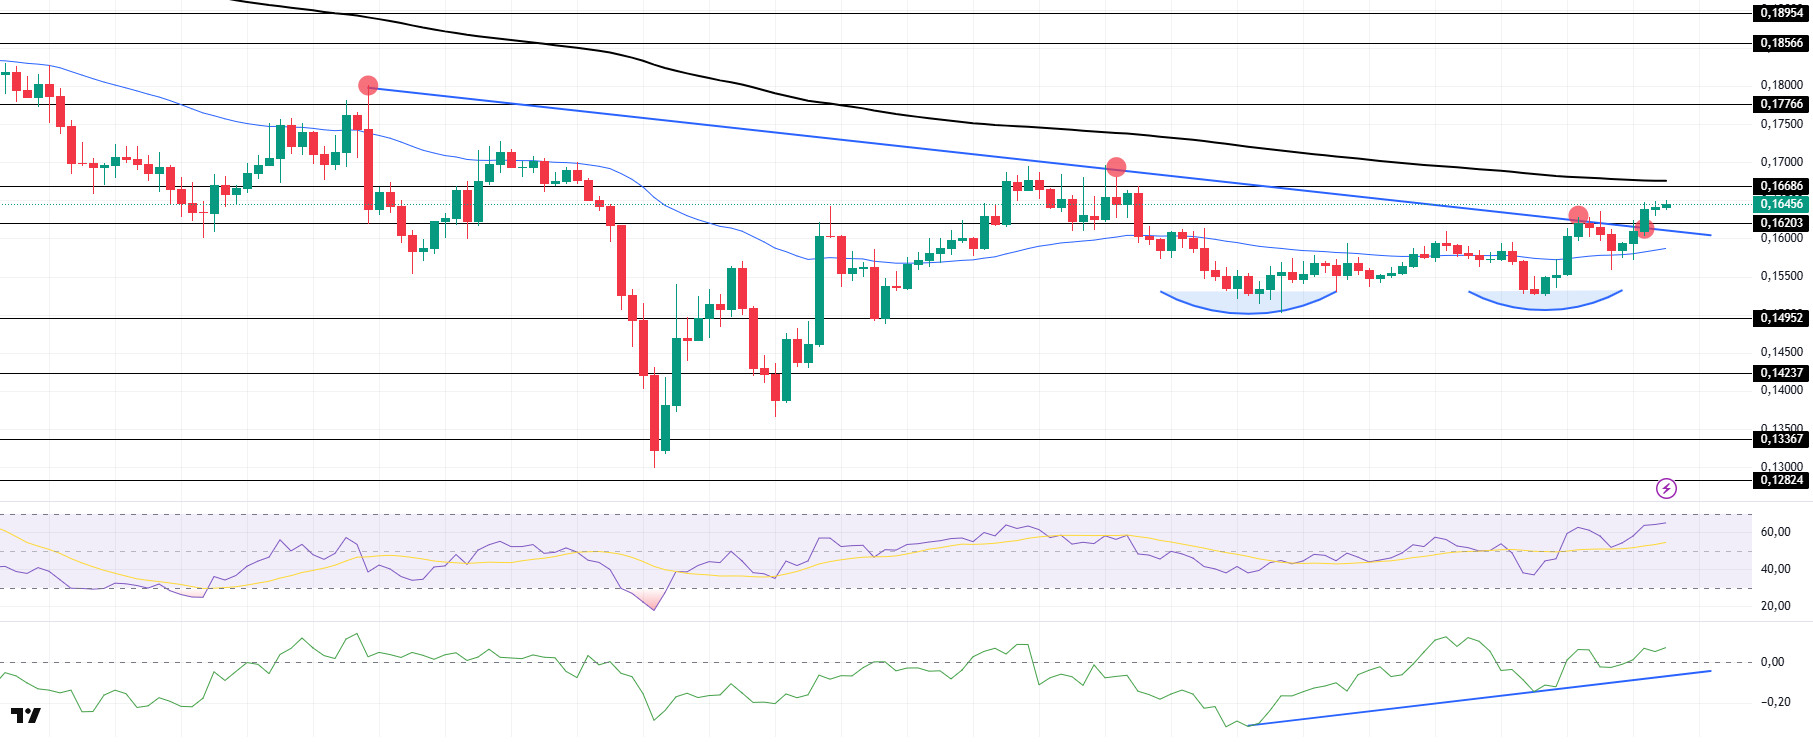
DOGE/USDT
DOGE was bullish during the day. The asset is set to test the 200 EMA (Black Line) and the strong resistance at $0.16686, breaking the downtrend that started on April 2. If it fails to break here, the $0.16203 level may test as support. In addition, a double bottom formation has formed. This should be taken into consideration. On the 4-hour timeframe, the 50 EMA (Blue Line) continues to be below the 200 EMA (Black Line). This could mean that the decline could continue in the medium term. However, the price started to price between two moving averages. This shows us that the price is in the decision phase. When we examine the Chaikin Money Flow (CMF)20 indicator, it moved into positive territory and continued the uptrend that started on April 16. In addition, the positive 24-hour volume may move CMF to higher levels. On the other hand, Relative Strength Index (RSI)14 continued to be in the positive zone. The $0.16686 level stands out as a very strong resistance point in the rises due to political reasons, macroeconomic data and innovations in the DOGE coin. In case of possible retracements due to political, macroeconomic reasons or due to negativities in the ecosystem, the $ 0.14952 level, which is a strong support place, is an important support place. If the price hits these support levels, a potential bullish opportunity may arise if momentum increases.
Supports 0.16203 – 0.14952 – 014237
Resistances 0.16686 – 0.17766 – 0.18566
Legal Notice
The investment information, comments and recommendations contained herein do not constitute investment advice. Investment advisory services are provided individually by authorized institutions taking into account the risk and return preferences of individuals. The comments and recommendations contained herein are of a general nature. These recommendations may not be suitable for your financial situation and risk and return preferences. Therefore, making an investment decision based solely on the information contained herein may not produce results in line with your expectations.
