
TECHNICAL ANALYSIS
BTC/USDT
US President D.Trump stated that he does not plan to dismiss Fed Chairman J.Powell and reiterated that interest rates should be lowered. Trump signaled that tariffs imposed on China could be reduced and emphasized that he is open to lowering the tone of trade wars. New SEC Chairman Paul Atkins said in his first statement that a clear regulatory framework for digital assets is among his priorities. These statements were interpreted as a positive signal for Bitcoin by names such as MicroStrategy founder Michael Saylor. On the other hand, according to Bloomberg, details of Trump’s strategic Bitcoin reserve plan are expected to be announced in the next two weeks. On the market front, there was a total net inflow of $936 million into Bitcoin spot ETFs on April 22. This led to a significant rise in the fear and greed index and helped the market reach the greed level.
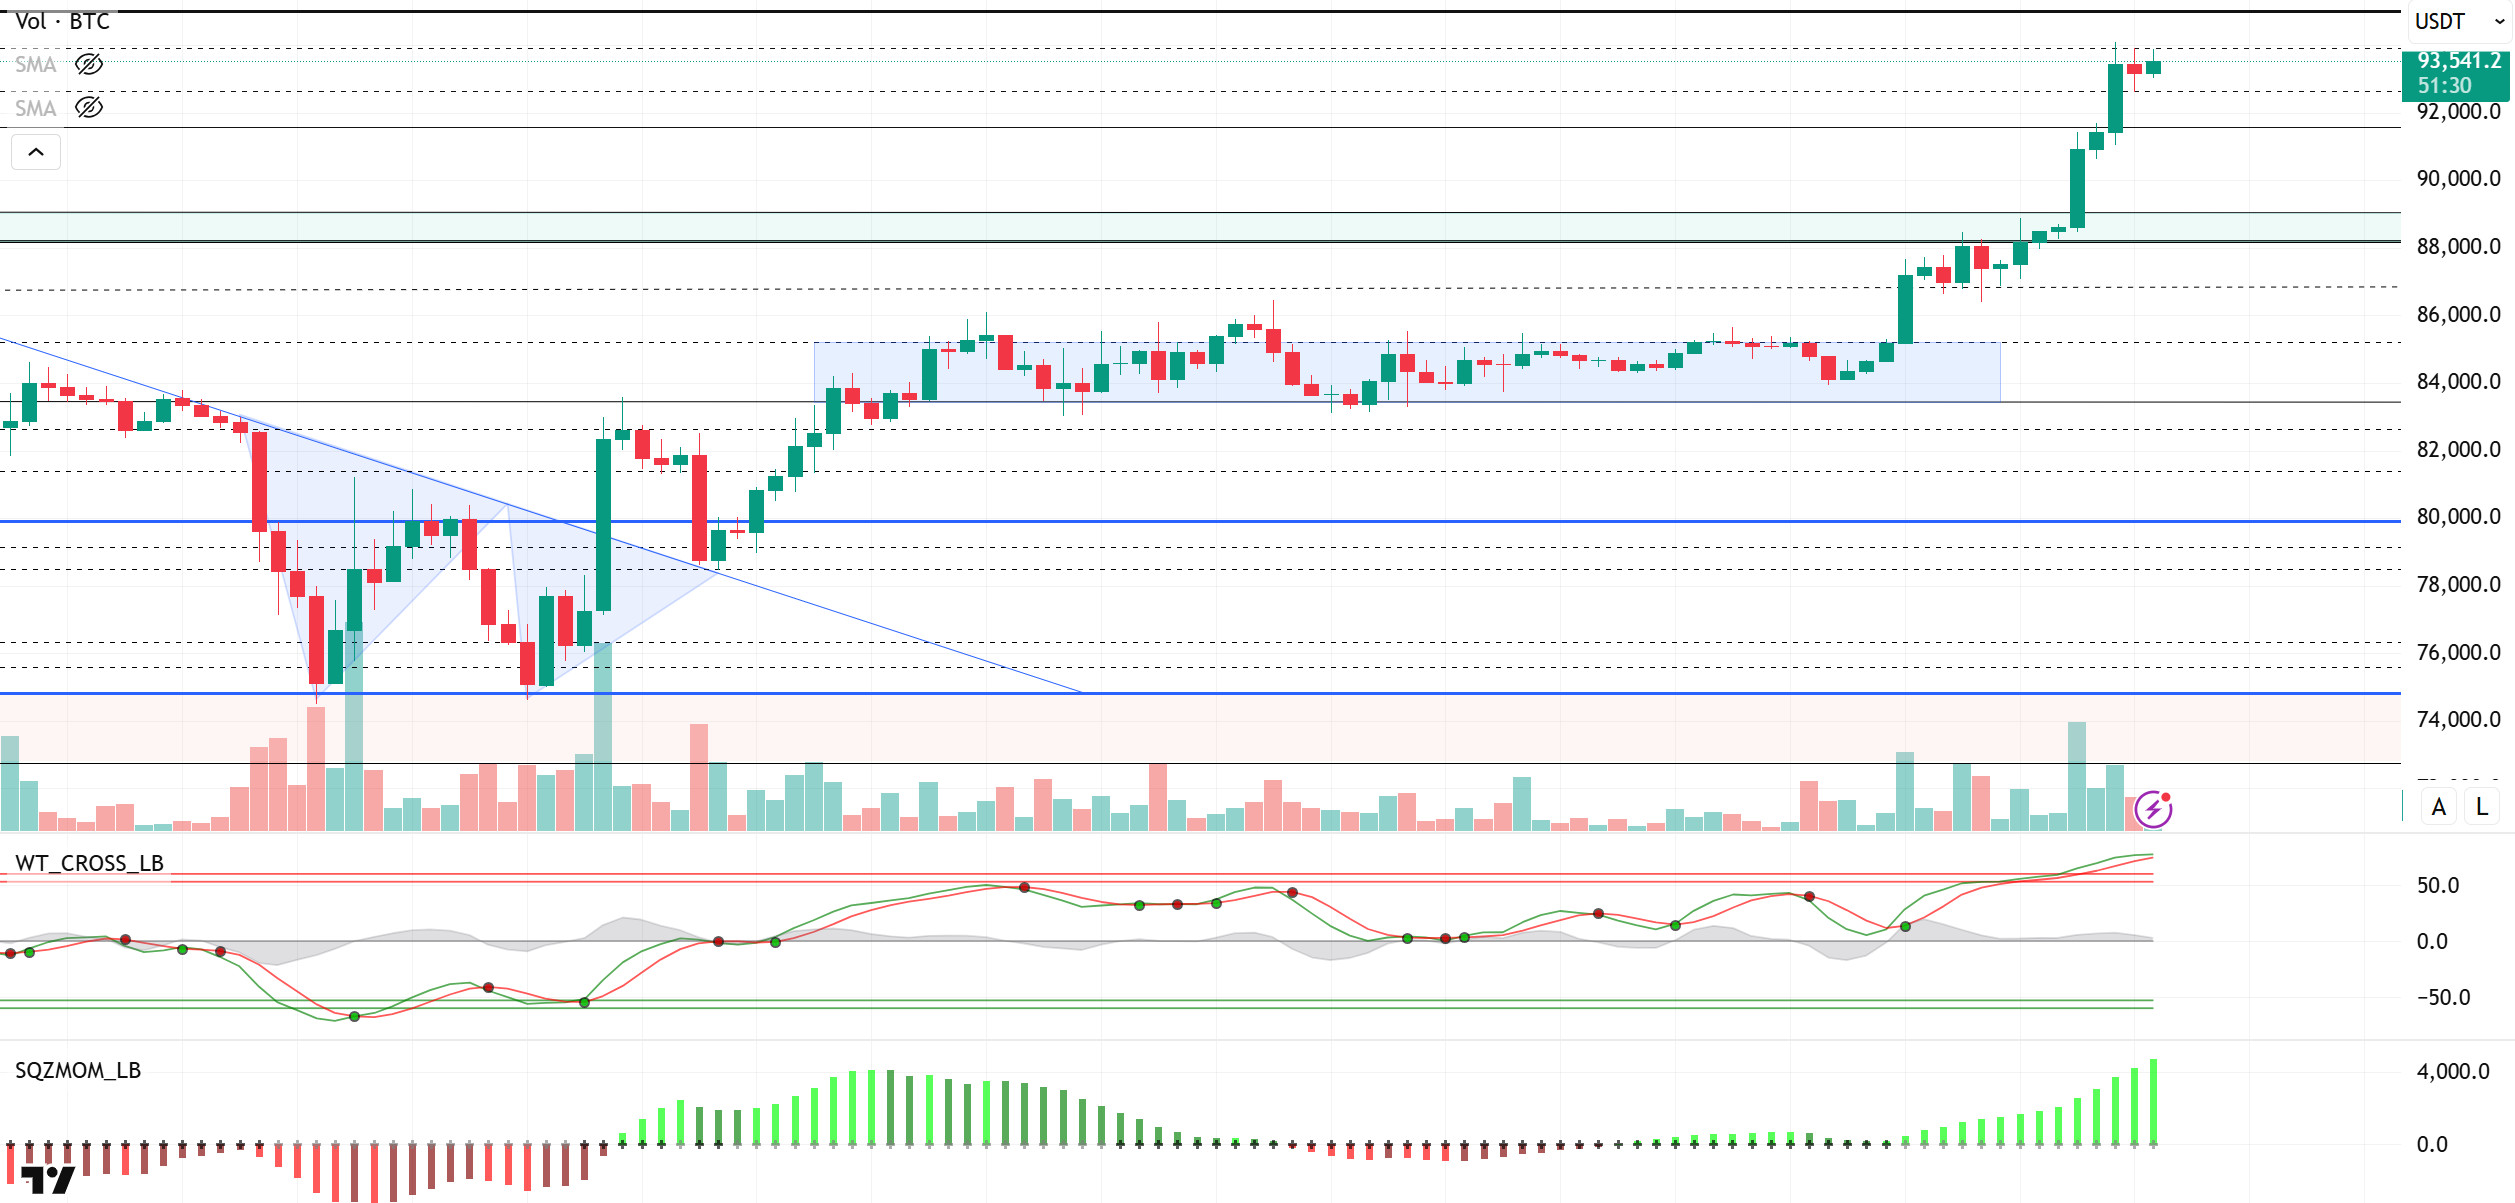
Looking at the technical outlook, as we highlighted in the previous analysis, BTC technically had room to test the 91,800 level. Indeed, BTC, which accumulated around this level, rose sharply after Trump’s optimistic statements and tested the seven-week high of $ 94,000. At the time of writing, BTC is trading at $93,700, holding on to all of its gains. Looking at the technical indicators, the Wave Trend Oscillator has moved above the overbought zone, suggesting a short-term saturation and possible correction. However, the momentum indicator has maintained its positive momentum, indicating that the market still has a high risk appetite. Although technical indicators point to the need for a correction, strong fundamentals outweigh these technical signals and continue to be the driving force behind the price. The improvement in market sentiment, especially with Trump’s statements, continues to support BTC’s rise. With this rise, it can be said that BTC has opened the door to new highs in the market. In this process, the 95,000 level remains the reference point, which has been tested many times before and is a critical threshold for the price. If this level is exceeded, psychological expectations for the 100,000 level may be revived. On the other hand, in case of a possible technical correction, the 92,800 level will be followed as the first strong support. If it sags below this level, rebalancing can be seen in the 91,800-90,400 band.
Supports 92,700 – 91,800 – 90,400
Resistances: 94,000 – 95,000 – 97,000
ETH/USDT
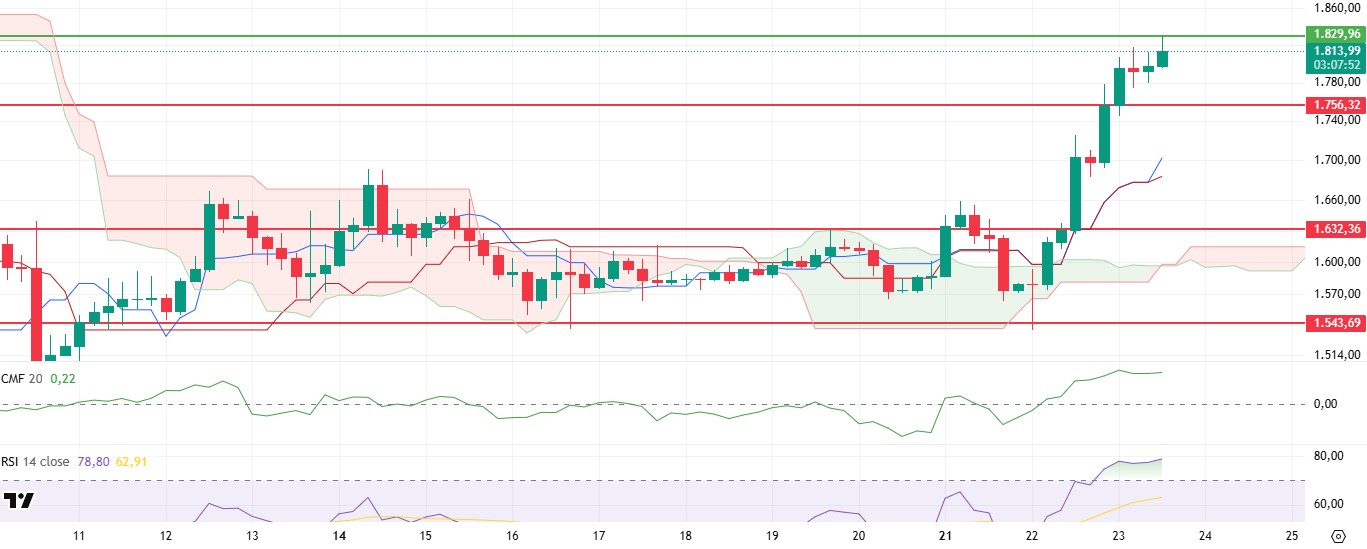
ETH tested an important resistance point during the day, rising as high as $1,830. However, as a result of the selling pressure from this level, the price experienced a slight retracement. When the technical outlook is analyzed, it is seen that positive signals are generally maintained.
The Chaikin Money Flow (CMF) indicator continues to move sideways in the positive zone. This indicates that buyers and sellers among the market participants have formed a certain balance, and the market continues to search for direction. CMF remains in positive territory, indicating that capital flows are still in the buying direction and selling pressure remains limited. On the Ichimoku cloud indicator, the technical structure continues to trend upwards. The widening of the cloud structure is a strong signal that the overall trend is moving in a positive direction. In particular, the tenkan line crossing the kijun line upwards indicates that the momentum in market perception has turned upwards again and the short-term upward trend is supported. This intersection is considered an important buy signal in Ichimoku analysis. The Relative Strength Index (RSI) indicator is trending horizontally in the overbought zone. This indicates that the bullish momentum may remain limited in the short term and a possible correction may be on the agenda. The consolidation of the RSI indicator at these levels suggests that the market may want to take a breather for a while and if it continues to remain in the overbought zone, investors may turn to profit realization.
Overall, technical indicators remain positive and suggest that the uptrend may be maintained in the medium term. However, the RSI indicator remains in the overbought zone and the rejection of the price from the $1,830 level raises the possibility of a short-term correctional move. In this context, a pullback in the price to the $1,756 levels could be considered as a technically healthy correction. Such a retracement could set the stage for new buying opportunities and contribute to the continuation of the uptrend on a healthier footing.
Supports 1,756 – 1,632 – 1,543
Resistances 1,829 – 1,925 – 2,131
XRP/USDT
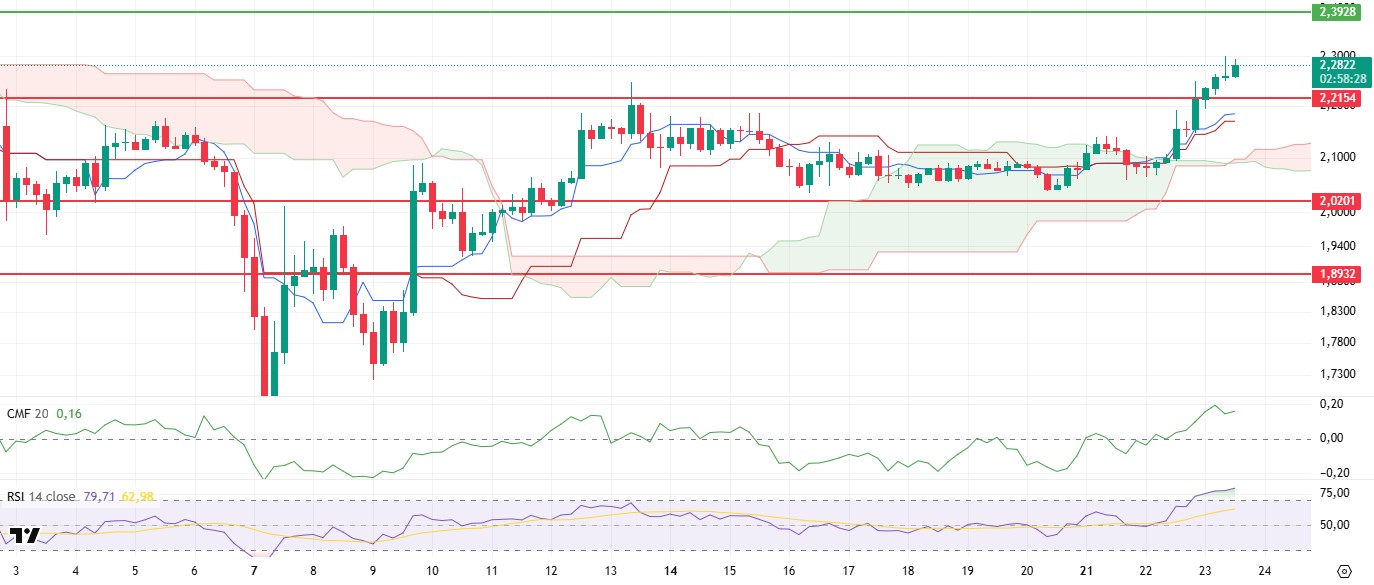
XRP continued its upward trend during the day after breaking through the critical resistance zone at the $2.21 level yesterday evening. With this momentum, the price climbed as high as $2.30, maintaining its positive technical outlook. The fact that the price holds at these levels and continues to rise reveals the buying tendency of market participants.
Analysing the technical indicators, the Chaikin Money Flow (CMF) indicator continues its upward movement in the positive zone. This positive structure of CMF indicates that the overall momentum of the market remains strong. Similarly, the Relative Strength Index (RSI) indicator has reached the overbought zone while continuing its uptrend. The fact that the RSI has reached these levels indicates that the price may retreat somewhat in the short term and profit realizations may come into play. Accordingly, XRP’s pullback to the $2.21 level can be considered as a possible corrective move. This level is also expected to work as support as it was at the previous resistance position. On the Ichimoku indicator, the cloud structure is thinning and moving upwards, indicating that the trend is gaining strength and the price is supported. This technical structure stands out as an important factor supporting the bullish scenario in XRP.
Overall, XRP’s technical outlook remains strong. Although there is a possibility of a short-term correction, it seems technically possible that the price will regain momentum after this correction and move towards the $2.39 level. In particular, if the $2.21 level works as support, it could set the stage for a new bullish wave and provide a strategic opportunity for buying positions.
Supports 2.2154- 2.0201 – 1.8932
Resistances 2.3938 – 2.4721 – 2.8347
SOL/USDT
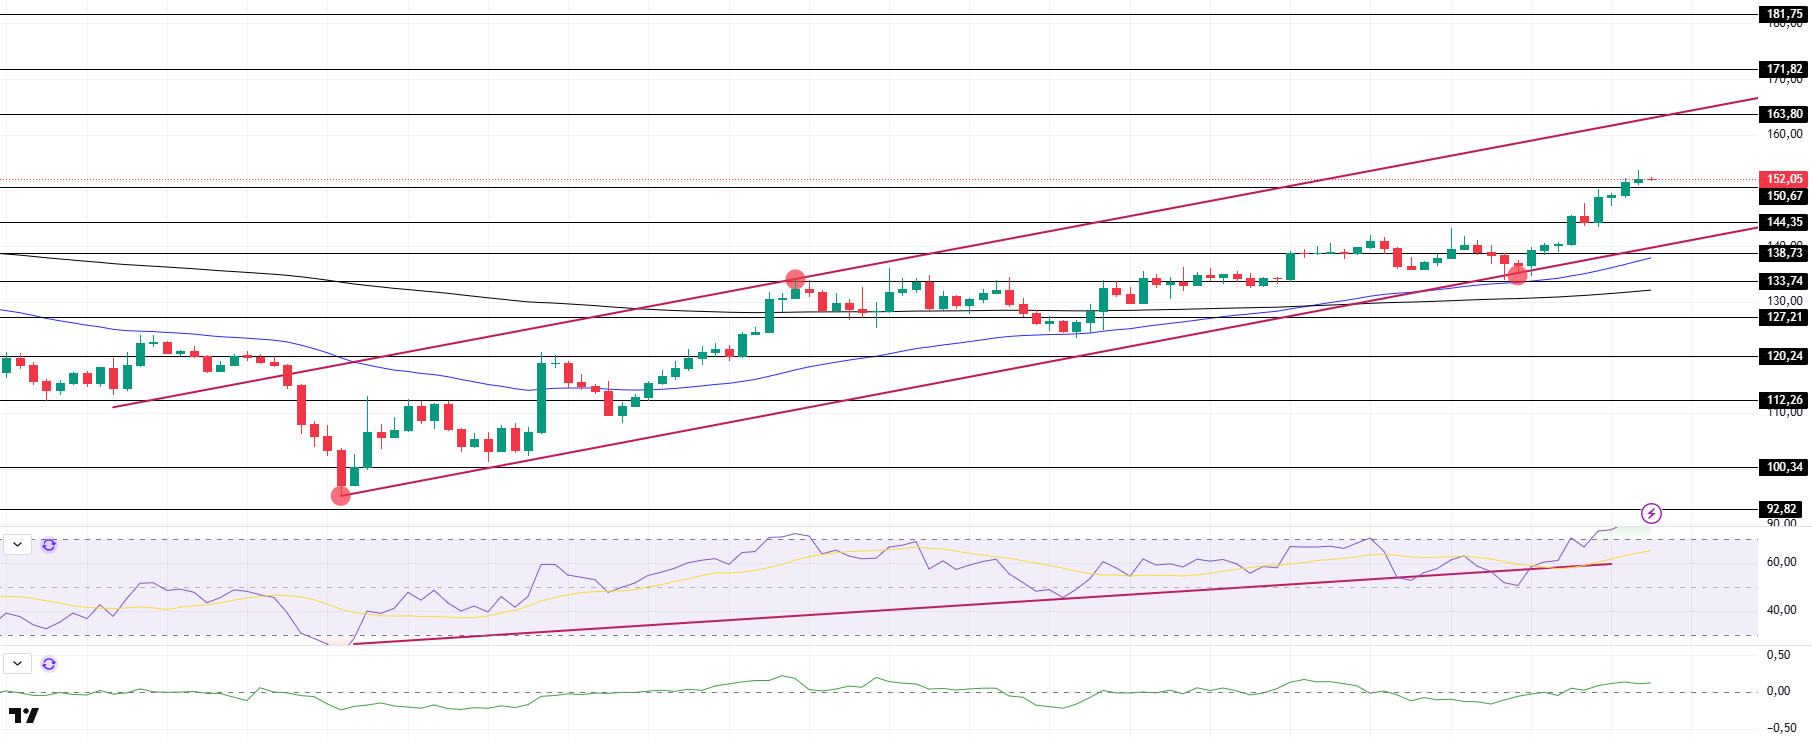
SOL continued its ascent during the day. The asset gained momentum from the base level and the 50 EMA (Blue Line) of the uptrend that started on April 7 and broke the resistance at $150.67. On the 4-hour timeframe, the 50 EMA (Blue Line) continues to hover above the 200 EMA (Black Line). This could be a bullish start in the medium term. At the same time, the price remained above the two moving averages. This indicates that there is buying pressure in the market. When we examine the Chaikin Money Flow (CMF)20 indicator, it moved into the positive zone. The positive daily volume may move CMF to the upper levels of the positive area. Relative Strength Index (RSI)14 continues to be above the uptrend that started on April 7. At the same time, being in the overbought zone may bring profit sales. The level of 163.80 dollars appears as a place of resistance in the rises driven by the coming macroeconomic data and the news in the Solana ecosystem. If it breaks here, the rise may continue. If there are pullbacks for the opposite reasons or due to profit sales, the support level of 138.73 dollars may be triggered. If the price hits these support levels, a potential bullish opportunity may arise if momentum increases.
Supports 150.67 – 144.35 – 138.73
Resistances 163.80 – 171.82 – 181.75
DOGE/USDT
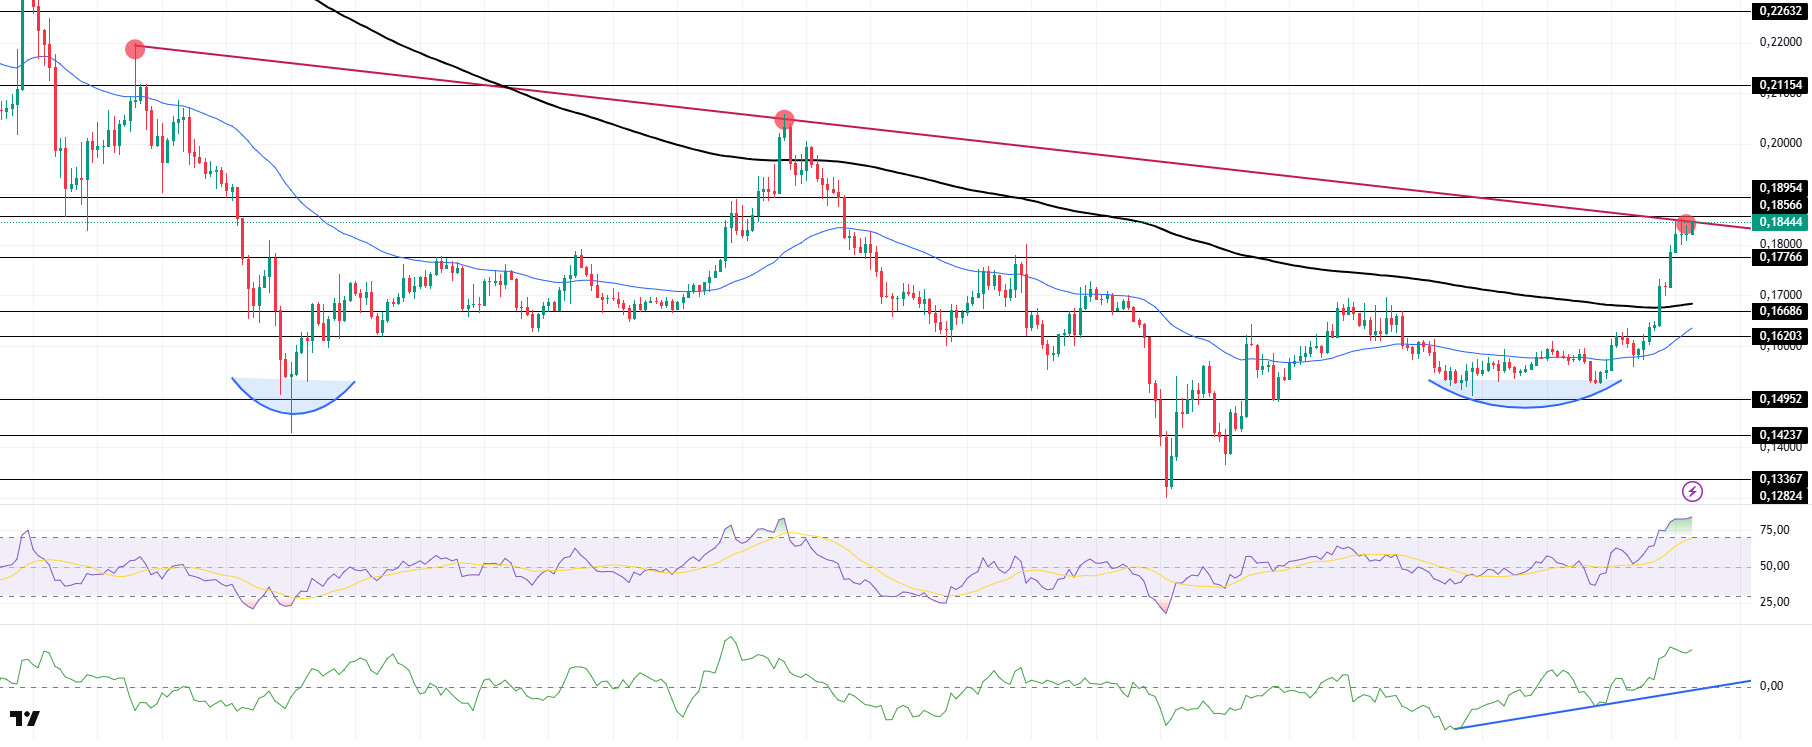
DOGE moved sideways during the day. The asset is testing the downtrend that started on March 6 and the strong resistance at $0.18566. If it breaks here, the $0.18954 level may be triggered. The double bottom formation worked. On the 4-hour timeframe, the 50 EMA (Blue Line) continues to be below the 200 EMA (Black Line). This could mean that the decline could continue in the medium term. However, the price started to price above two moving averages. This indicates that buying pressure is building. When we examine the Chaikin Money Flow (CMF)20 indicator, it continued to rise in the positive zone and continued the uptrend that started on April 16. In addition, the positive 24-hour volume may push CMF to higher levels. On the other hand, the Relative Strength Index (RSI)14 continued to be in the positive zone, but its presence in the overbought zone may bring profit sales. The $0.21154 level is a very strong resistance point in the uptrend due to political reasons, macroeconomic data and innovations in the DOGE coin. In case of possible retracements due to political, macroeconomic reasons or negativities in the ecosystem, the $ 0.17766 level, which is a strong support place, is an important support place. If the price hits these support levels, a potential bullish opportunity may arise if momentum increases.
Supports 0.17766 – 0.16686 – 0.16203
Resistances 0.18566 – 0.18954 – 0.21154
Legal Notice
The investment information, comments and recommendations contained herein do not constitute investment advice. Investment advisory services are provided individually by authorized institutions taking into account the risk and return preferences of individuals. The comments and recommendations contained herein are of a general nature. These recommendations may not be suitable for your financial situation and risk and return preferences. Therefore, making an investment decision based solely on the information contained herein may not produce results in line with your expectations.
