
TECHNICAL ANALYSIS
BTC/USDT
The correlation between bitcoin and US stocks is weakening. The correlation with the S&P 500 has fallen from 0.88 to 0.77 and with the Nasdaq from 0.91 to 0.83. The correlation between bitcoin and gold has increased, with the correlation coefficient rising from -0.62 at the beginning of the month to -0.31 currently. If the current trend of divergence from stock indices continues, gold could become a leading indicator for Bitcoin, other conditions being constant.
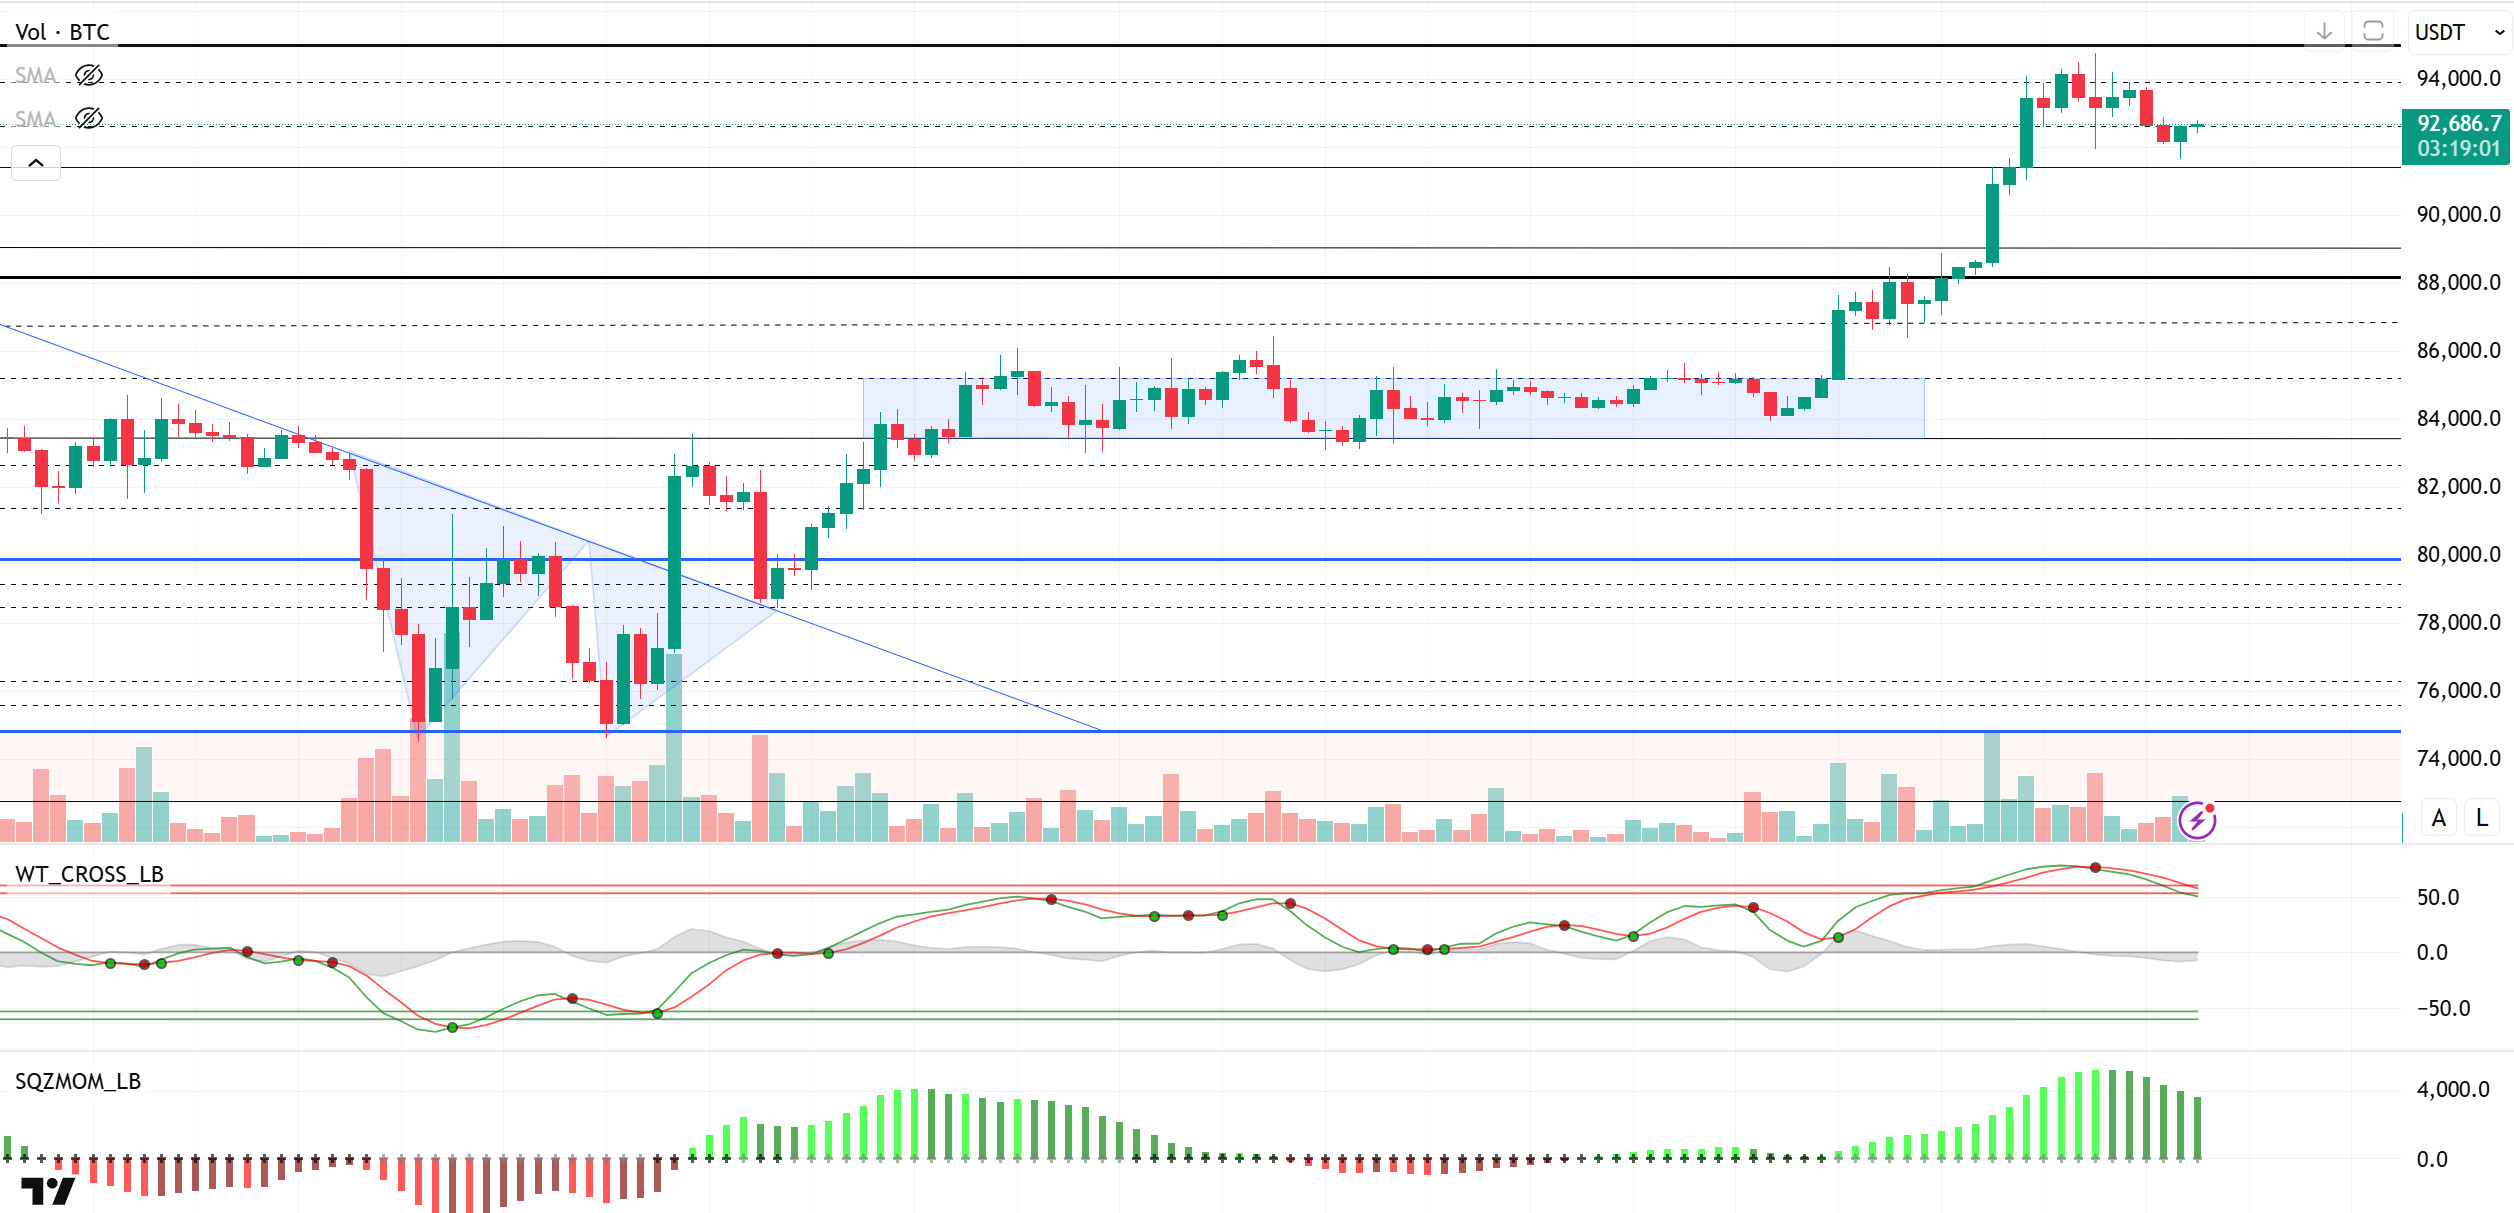
Looking at the technical outlook, the BTC price retreated to 91,600 during the day with the sell signal on the wave trend oscillator and the weakening in the momentum indicator. In BTC, which entered a short-term correction process within the major uptrend, the flag-pennant pattern continues to attract attention technically. This pattern is considered a trend continuation pattern and usually stands out as a structure that indicates that the uptrend continues with corrections. With this correction in the technical structure, the buying positions above the 89,000 level, which we drew attention to earlier, are regaining importance as a potential demand zone. A pullback to these levels could create an important opportunity for liquidity cleansing and the process of gathering demand for a new rise. In this process, a break of the 91,400 level, one of the intermediate support levels, could technically facilitate the price to take a pin towards the 89,000 levels. On the other hand, if fundamental developments take shape in a positive direction again, the upward movement in BTC price can be expected to gain momentum and the 95,000 level can be expected to continue to be a reference for new highs.
Supports 92,800 – 91,450 – 90,400
Resistances 94,000 – 95,000 – 97,000
ETH/USDT
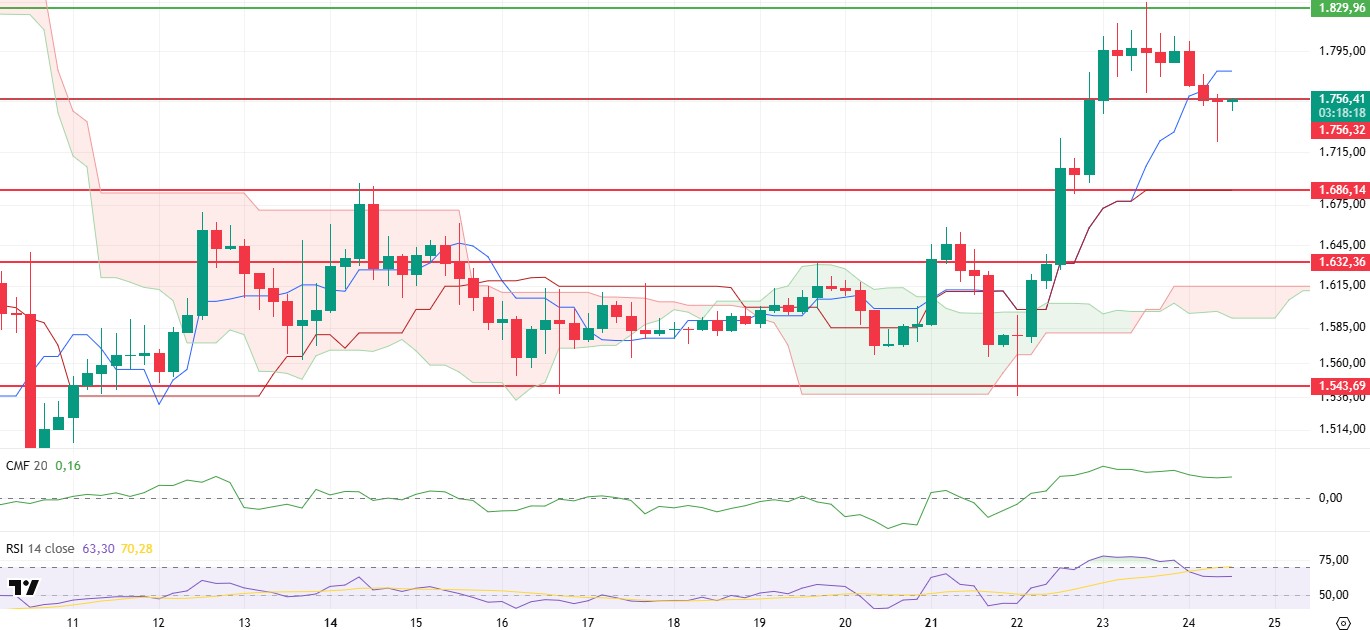
After breaching the $1,756 level during the day, ETH quickly retreated to the $1,723 level. However, with the purchases from this region, the price recovered and made an attack towards the $1,756 level and is trying to regain this critical threshold.
First of all, the Chaikin Money Flow (CMF) indicator continued to remain flat regardless of price fluctuations, indicating that there was no significant liquidity outflow in the spot market. This suggests that the selling pressure was predominantly driven by futures markets and that short trades, especially after the closing of long positions, put pressure on the price. In this context, it is understood that the decline was caused by short-term leveraged positions rather than the overall structure of the market. The price sagging below the tenkan level within the scope of the ichimoku indicator can be considered as a negative signal at first glance. However, despite this, the continued expansion in the kumo cloud shows that the overall trend is still upward and the uptrend continues. This structure reveals that the price tends to recover by feeding on basic supports despite temporary weaknesses. On the other hand, the Relative Strength Index (RSI) indicator moved out of the overbought zone to a horizontal outlook, indicating that the price is preparing the ground for a new bullish wave. This calm in the RSI suggests that a rebalancing process has begun in the market and a new power gathering phase has entered after the profit realizations from the overbought zone.
In the light of all these data, the price’s permanent exceeding of the $1,756 level, coupled with the positive signals offered by technical indicators, may pave the way for an increase in upside potential. In this case, the price can be expected to make a move towards the $1,829 level again. However, if it stays below this level, especially closes below $1,723, the downward pressure may deepen, and the price remains likely to retreat to $1,686 support.
Supports 1,756 – 1,632 – 1,543
Resistances 1,829 – 1,925 – 2,131
XRP/USDT
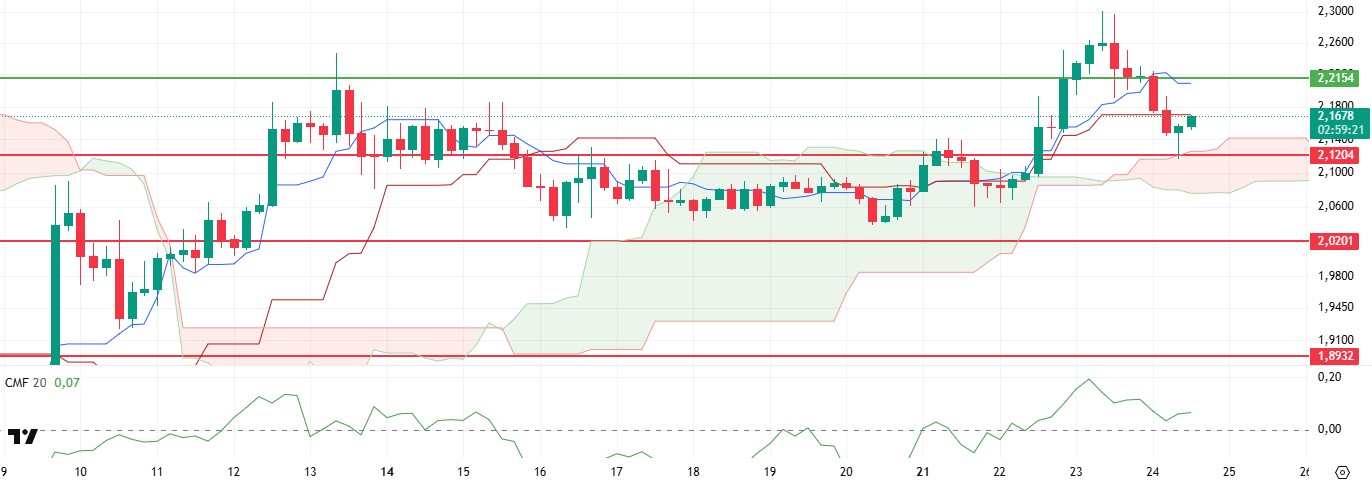
As mentioned in the analysis in the morning hours, XRP faced selling pressure during the day with weaknesses in technical indicators and retreated to the level of $2.12, which is the kumo cloud support on the ichimoku indicator. With the purchases coming from this critical support level, the price recovered and rose to the kijun level again and is currently making an effort to exceed this level. The unstable course of the price in this region reveals that investors are in search of direction and whether it can be sustained above this level will be decisive in terms of short-term price movements.
The Chaikin Money Flow (CMF) indicator has started to show signs of recovery after converging to the zero line and has moved back into positive territory. This outlook indicates that buyer interest has increased again with new liquidity entering the market and selling pressure has started to ease. This turn in CMF can be considered as an important confirmation signal in terms of the continuation of the upward price movement. In the context of the Ichimoku indicator, although the price is trading below both the tenkan and kijun levels, the tenkan level is still positioned above the kijun level, indicating that the short-term momentum continues to be maintained. Moreover, the kumo cloud is clearly forming a support zone, suggesting that the current pullback has not created a structural breakdown and the overall trend of the market remains positive. This finding suggests that if the price continues to find support at current levels, the upside potential may come into play again.
When evaluated in this technical framework, if the XRP price exceeds the kijun level in the evening, there is a potential for an increase up to the level of $2.21 with the strengthening of the upward momentum. Exceeding this level could technically mean a breakthrough and pave the way for harder rises. On the other hand, the $2.12 level is critical as the kumo cloud support on the ichimoku indicator. If this level is breached downwards, deterioration in the market outlook may occur and a deeper correction in the XRP price may be triggered.
Supports 2.1204 – 2.0201 – 1.8932
Resistances 2.2154 – 2.3938 – 2.4721
SOL/USDT
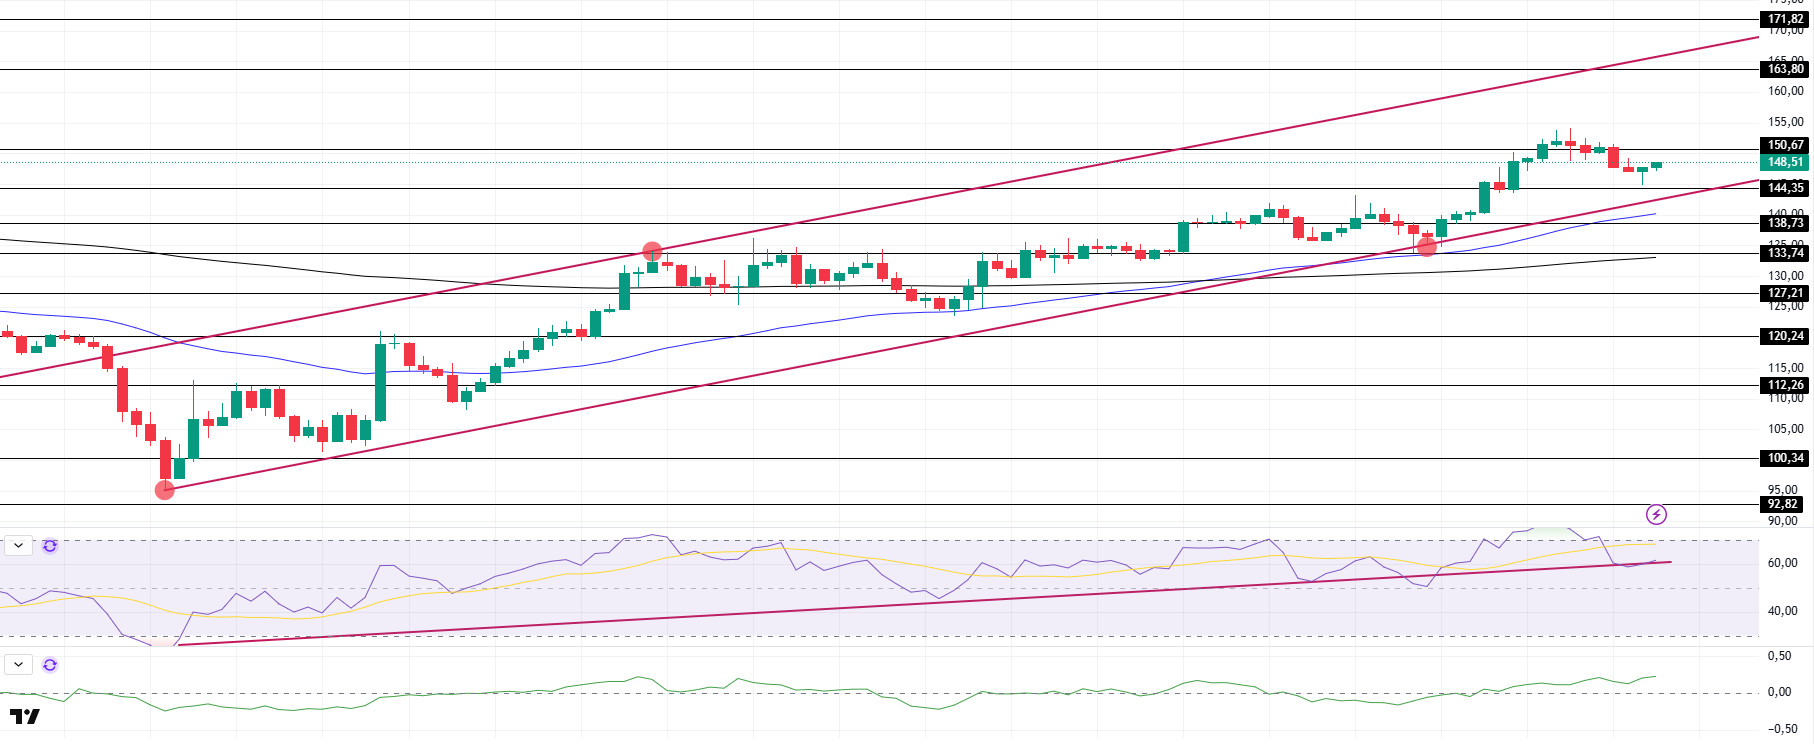
SOL moved sideways during the day and remained in the middle levels of the uptrend that started on April 7. The price failed to break the strong resistance at $150.67 and retreated. On the 4-hour timeframe, the 50 EMA (Blue Line) continues to hover above the 200 EMA (Black Line). This could be a bullish start in the medium term. At the same time, the price remained above the two moving averages. This suggests that there is buying pressure in the market. When we examine the Chaikin Money Flow (CMF)20 indicator, it moved into positive territory. However, the negative daily volume may move CMF into negative territory. Relative Strength Index (RSI)14 continues to be above the uptrend that started on April 7. It is currently testing the uptrend as support. If it breaks, it may experience pullbacks. The $ 163.80 level appears as a place of resistance in the rises driven by the coming macroeconomic data and the news in the Solana ecosystem. If it breaks here, the rise may continue. In case of retracements due to the opposite reasons or profit sales, the support level of $ 138.73 can be triggered. If the price comes to these support levels, a potential bullish opportunity may arise if momentum increases.
Supports 144.35 – 138.73 – 133.74
Resistances 150.67 – 163.80 – 171.82
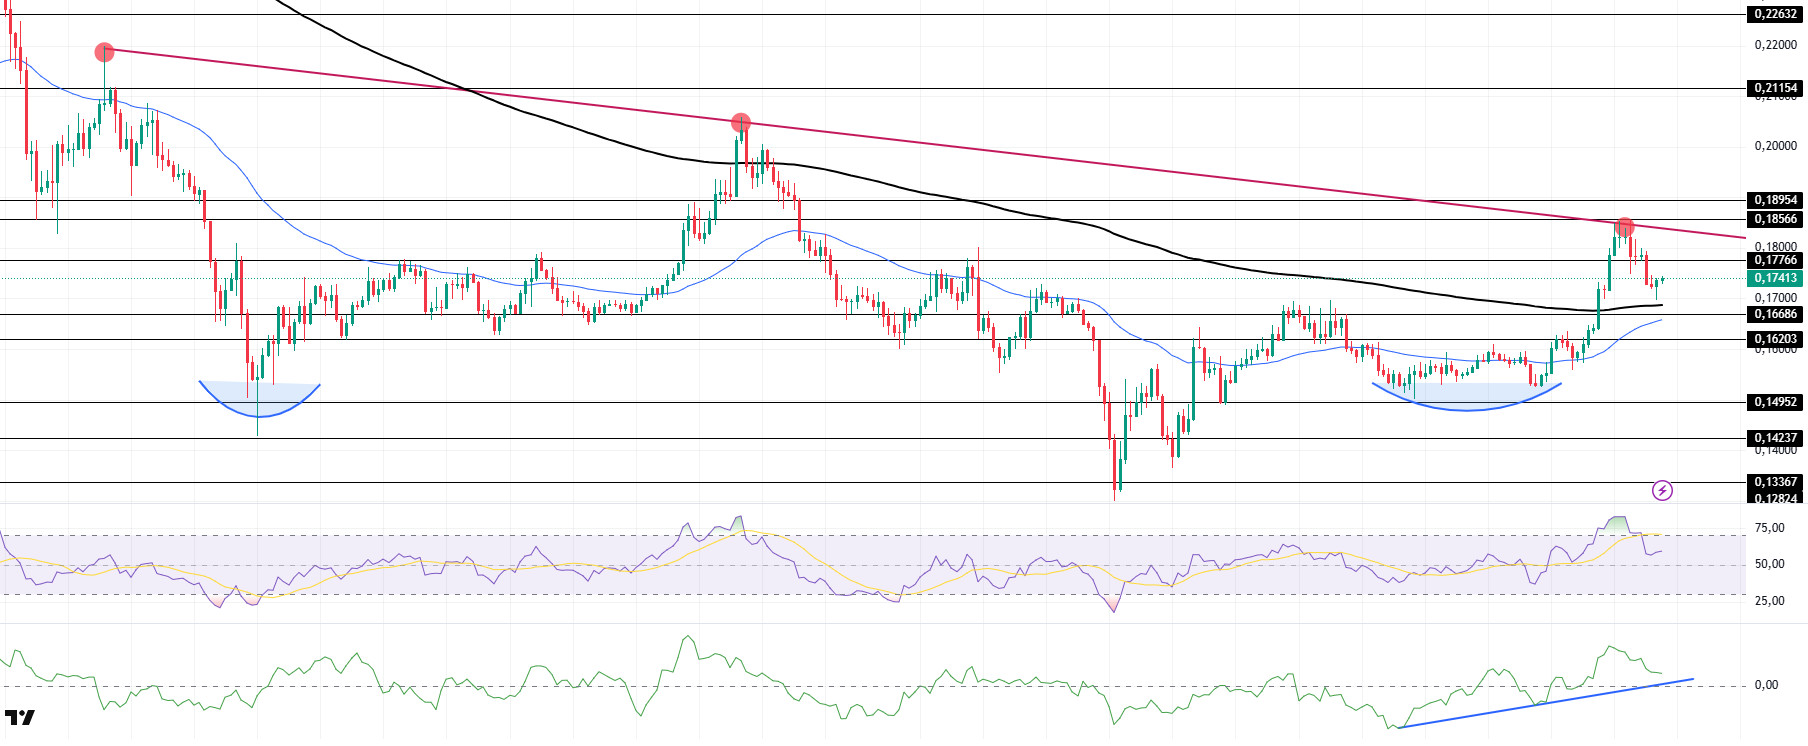
DOGE/USDT
DOGE fell slightly during the day but found support from the 200 EMA (Black Line) and rallied. The asset tested the downtrend that started on March 6 and the strong resistance at $0.18566 but failed to break it and retreated. The double bottom pattern worked. On the 4-hour timeframe, the 50 EMA (Blue Line) remains below the 200 EMA (Black Line). This could mean that the decline could continue in the medium term. However, the price is pricing above the two moving averages. This suggests that buying pressure is building. When we examine the Chaikin Money Flow (CMF)20 indicator, it is in positive territory, but money outflows have started. At the same time, it continued the uptrend that started on April 16. In addition, the negative 24-hour volume may cause CMF to test the uptrend as support. On the other hand, Relative Strength Index (RSI)14 continued to be in positive territory. The $0.18566 level stands out as a very strong resistance point in the rises driven by political reasons, macroeconomic data and innovations in the DOGE coin. In case of possible pullbacks due to political, macroeconomic reasons or negativities in the ecosystem, the $ 0.16686 level, which is a strong support place, appears as an important support place. If the price reaches these support levels, a potential bullish opportunity may arise if momentum increases.
Supports 0.16686 – 0.16203 – 0.14952
Resistances 0.17766 – 0.18566 – 0.18954
Legal Notice
The investment information, comments and recommendations contained herein do not constitute investment advice. Investment advisory services are provided individually by authorized institutions taking into account the risk and return preferences of individuals. The comments and recommendations contained herein are of a general nature. These recommendations may not be suitable for your financial situation and risk and return preferences. Therefore, making an investment decision based solely on the information contained herein may not produce results in line with your expectations.
