
TECHNICAL ANALYSIS
BTC/USDT
Institutional adoption and regulation in the Bitcoin and crypto markets continue unabated. MicroStrategy significantly increased its holdings by purchasing an additional 15,355 Bitcoin between April 21-27. The US Congress aims to finalize crypto legislation on stablecoins and market structure before August. On the other hand, Swiss supermarket chain Spar is preparing to expand Bitcoin payment acceptance across the country.
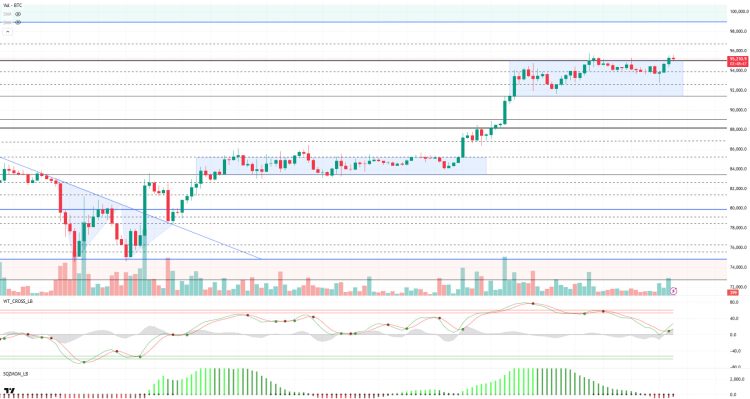
Looking at the technical outlook, BTC has entered a consolidation phase and continues to push the 95,000 resistance level. As we mentioned in the previous analysis, the wave trend oscillator was expected to generate a buy signal, and accordingly, BTC continues to maintain its bullish momentum. However, it is noteworthy that momentum indicators have not yet displayed a strong driving force. While a positive outlook prevails in the US futures market, increased volatility in the overall market structure may support the upward movement in BTC price. In such a scenario, BTC is likely to move towards six-digit levels. In the continuation of the rise, the 97,000 and 98,000 band range will be followed as the first reference resistance zones. On the other hand, in the event of BTC’s rejection from the 95,000-resistance level, the 94,000 intermediate support level and then the 92,800 level will be monitored as critical support points, respectively. How the price reacts at these levels will be decisive in terms of short-term direction.
Supports 92,800 – 91,450 – 90,400
Resistances 94,000 – 95,000 – 97,000
ETH/USDT
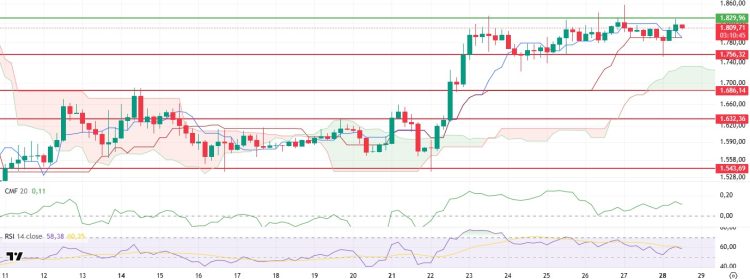
During the day, as highlighted in the morning analysis, ETH managed to rise to the $1,829 level with the support of positive signals in technical indicators. However, with the selling pressure coming from this critical resistance zone, the price experienced some retracement. In particular, the increase in volatility during the day indicates that short-term profit realizations have come into play and investors have started to act cautiously at this level.
Looking at the technical indicators in more detail, some negative developments in the ichimoku indicator stand out. First of all, Tenkan reversing direction and crossing the Kijun level to the downside is an important indicator pointing to trend weakness in the short term. Such crossovers usually signal that market momentum is slowing down and a potential correction may be in the offing. In addition, the Chaikin Money Flow (CMF) indicator is also showing a slight downward momentum due to the recent pullback. This indicates that there has been some liquidity outflow from the market and the buy side has started to lose strength. However, as CMF is still in positive territory in terms of the general trend, it is too early to talk about a completely negative picture in the liquidity structure. In the case of the Relative Strength Index (RSI) indicator, it is seen that the bullish movement experienced in the morning hours continued up to the based MA line, but from this level, it encountered selling pressure and started a downward movement again. This change of direction in the RSI indicates a loss of short-term momentum and confirms that the risk of correction is increasing.
In this context, it is possible that ETH price may retreat to the $1,790 area around the Kijun and Tenkan levels due to some negative signals in technical indicators towards the evening hours. This area is critical for maintaining the short-term trend, and a hold here would be an important fulcrum for a bullish scenario. However, if this support zone is violated downwards, it may become a strong possibility that the selling pressure will deepen and the price will experience a correction back towards the main support zone at $1,756. On the other hand, hourly and especially daily closes above the $1,829 level will invalidate the current short-term negative signals and pave the way for the uptrend to continue strengthening. In such a scenario, the upward momentum may reaccelerate, making it possible to target higher resistance levels.
Supports 1,756 – 1,632 – 1,543
Resistances 1,829 – 1,925 – 2,131
XRP/USDT
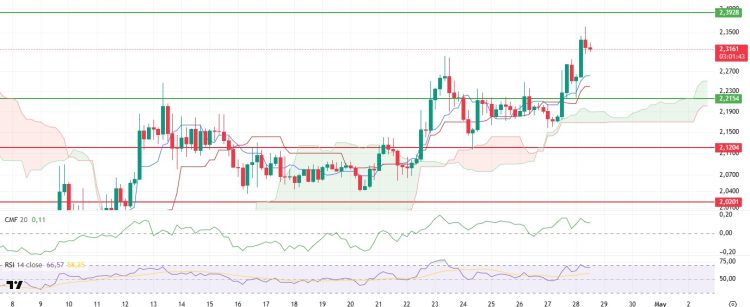
XRP continued its upward trend during the day, moving towards the $2.39 resistance level, but experienced a slight pullback with selling pressure from the $2.36 region. The return of the price without reaching this important resistance zone shows that market participants are cautious at this level and short-term profit realizations have come into play. In particular, the increase in volatility during the day and the price’s difficulty at the $ 2.36 level indicate that the balancing process has begun in the short term in XRP.
On the technical indicators side, the Tenkan and Kijun levels on the ichimoku indicator are simultaneously moving upwards. In addition, the kumo cloud is also in an ascending structure, supporting that there is no deterioration in the main trend and the price is still in a positive technical structure. However, the weakening of the Chaikin Money Flow (CMF) indicator over the past few hours suggests that the liquidity flow in the market has paused somewhat and there has been a slight loss of strength on the buy side. However, the Relative Strength Index (RSI) indicator turned down after approaching the overbought zone, which could be read as a signal of weakening bullish momentum. This pullback in the RSI can be considered as a technical reflection of the price’s difficulty in breaking through the $2.36 resistance.
In this context, XRP price can be expected to retreat a little more in the short term. At $2.25, the Tenkan and Kijun support points stand out as the first important line of defense for the price. If this region breaks down, selling pressure is likely to increase and the price is likely to retreat back towards the strong support line at $2.21. On the other hand, if the price manages to hold above the $2.25 support and regains strength, the main resistance zone of $2.39 could be retested after overcoming the intermediate resistance at $2.36.
Supports 2.1204 – 2.0201 – 1.8932
Resistances 2.2154 – 2.3938 – 2.4721
SOL/USDT
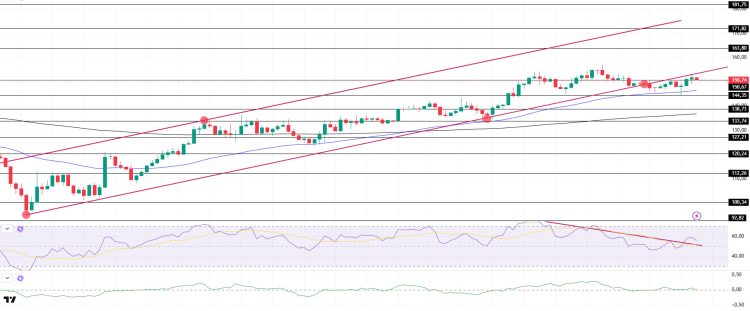
SOL moved sideways during the day. The asset broke the base of the uptrend that started on April 7, testing the 50 EMA (Blue Line) as support and accelerated from there. The price then tested the bottom of the downtrend as resistance but failed to break it and retreated slightly. On the 4-hour timeframe, the 50 EMA (Blue Line) continues to hover above the 200 EMA (Black Line). This could mean a bullish continuation in the medium term. At the same time, the price remained above the two moving averages. This suggests that there is buying pressure in the market. The Chaikin Money Flow (CMF)20 indicator is at a neutral level. However, positive daily volume may move CMF to the positive area. Relative Strength Index (RSI)14, on the other hand, broke the downtrend that started on April 23 upwards and rose. But selling pressure continues. This pressure may cause it to test the downtrend as support. The $163.80 level appears as a resistance point in the rises driven by the upcoming macroeconomic data and the news in the Solana ecosystem. If it breaks here, the rise may continue. In case of retracements for the opposite reasons or due to profit sales, the support level of $138.73 can be triggered. If the price comes to these support levels, a potential bullish opportunity may arise if momentum increases.
Supports 150.67 – 144.35 – 138.73
Resistances 163.80 – 171.82 – 181.75
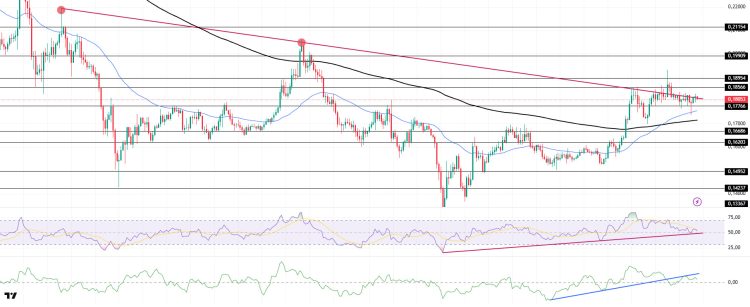
DOGE/USDT
DOGE continued its sideways movement during the day and is currently testing the downtrend as resistance. If it breaks it could trigger the strong resistance at $0.18954 again. The asset tested the 50 EMA (Blue Line) as support and accelerated from there. The asset is stuck between the resistance point of the downtrend and the 50 EMA. On the 4-hour timeframe, the 50 EMA (Blue Line) continues to be above the 200 EMA (Black Line). However, the price is pricing above two moving averages. These suggest that the asset may be in a bullish phase in the medium term. The Chaikin Money Flow (CMF)20 indicator is in positive territory, but inflows have started to decline. At the same time, it broke the downward uptrend that started on April 16 and tested this as resistance and failed to break it. On the other hand, Relative Strength Index (RSI)14 is in the positive zone close to the neutral zone. But the bullish momentum seems to have diminished. This may cause it to test the uptrend that started on April 7. The $0.18954 level is a very strong resistance point in the rises due to political reasons, macroeconomic data and innovations in the DOGE coin. In case of possible retracements due to political, macroeconomic reasons or due to negativities in the ecosystem, the $ 0.16686 level, which is a strong support place, is an important support place. If the price reaches these support levels, a potential bullish opportunity may arise if momentum increases.
Supports 0.17766 – 0.16686 – 0.16203
Resistances 0.18566 – 0.18954 – 0.19909
LEGAL NOTICE
The investment information, comments and recommendations contained herein do not constitute investment advice. Investment advisory services are provided individually by authorized institutions taking into account the risk and return preferences of individuals. The comments and recommendations contained herein are of a general nature. These recommendations may not be suitable for your financial situation and risk and return preferences. Therefore, making an investment decision based solely on the information contained herein may not produce results in line with your expectations.

