TECHNICAL ANALYSIS
BTC/USDT
Trump Media announced that it will develop a blockchain-based digital wallet and token for its video platform Truth+, while BlackRock announced that Bitcoin ETF investments are now shifting to institutional investors. While the US city of Roswell established a strategic Bitcoin reserve, CZ stated that they provide consultancy to multiple countries in this field. On the other hand, China announced that there has been no consultation with the US on tariffs. Tether announced that it holds over 7.7 tons of physical gold for XAUT reserves.
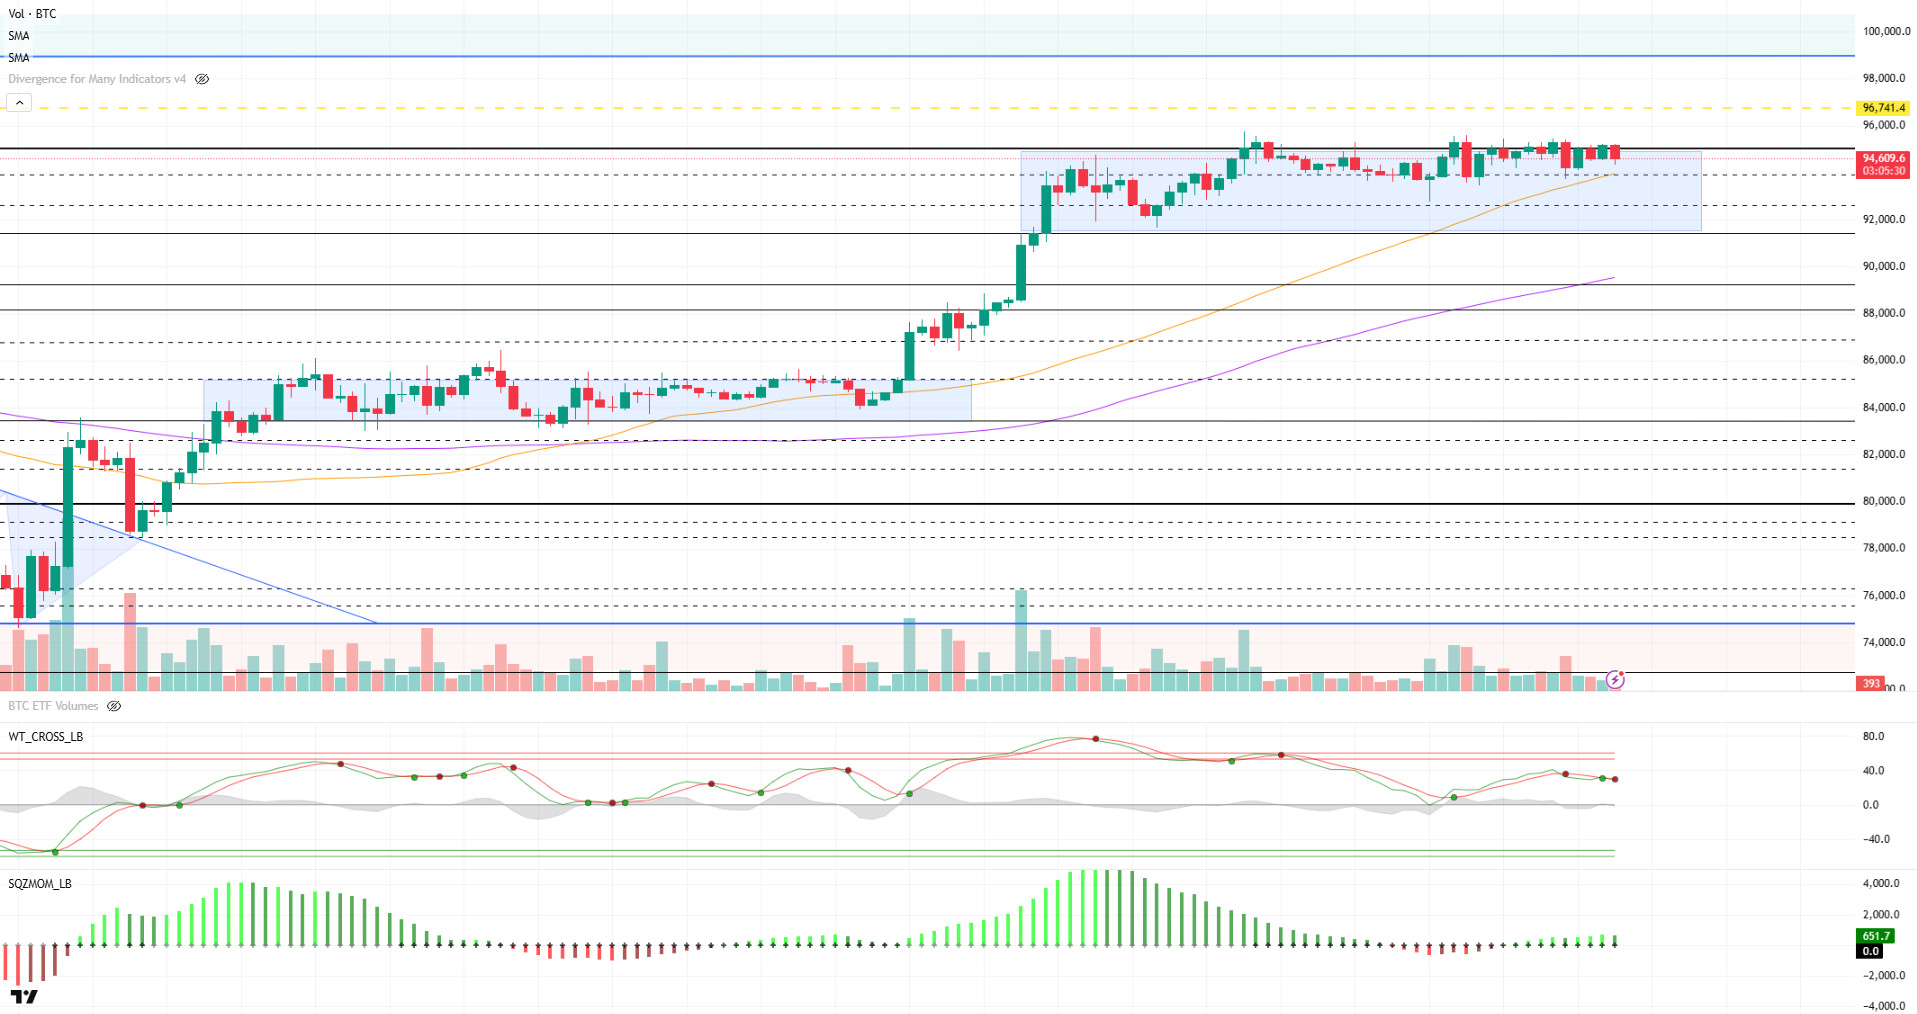
Looking at the technical outlook, compared to the previous analysis, BTC continues to consolidate with low volatility and volume. Price action is stuck in a very narrow band and although it tested the 95,000 level during the day, it failed to break above this resistance. This suggests that the technical upside breakout is not supported for the time being. The indecisive structure on the Wave Trend oscillator and the weak momentum indicator are among the signals that strengthen the possibility of a correction in the current outlook. In addition, the negative outlook in the futures market supports this technical weakness. On the spot ETF side, positive inflows so far have continued to be one of the main factors supporting the price. However, if the positive flow weakens, technically BTC is likely to test the 50-day moving average (SMA 50) of 94,000 and if this support is lost, the next technical level will be 92,800. If these levels hold, the technical structure can be expected to recover and push the 95,000 level once again. However, in the opposite scenario, that is, if technical weakness deepens and key supportive factors such as ETFs disappear, it may prevent BTC from making an upward leap. Accordingly, the market will continue to be shaped by macro data, Fed statements or news flows that will change market sentiment.
Supports 94,000 – 92,800 – 91,450
Resistances 95,000 – 97,000 – 98,000
ETH/USDT
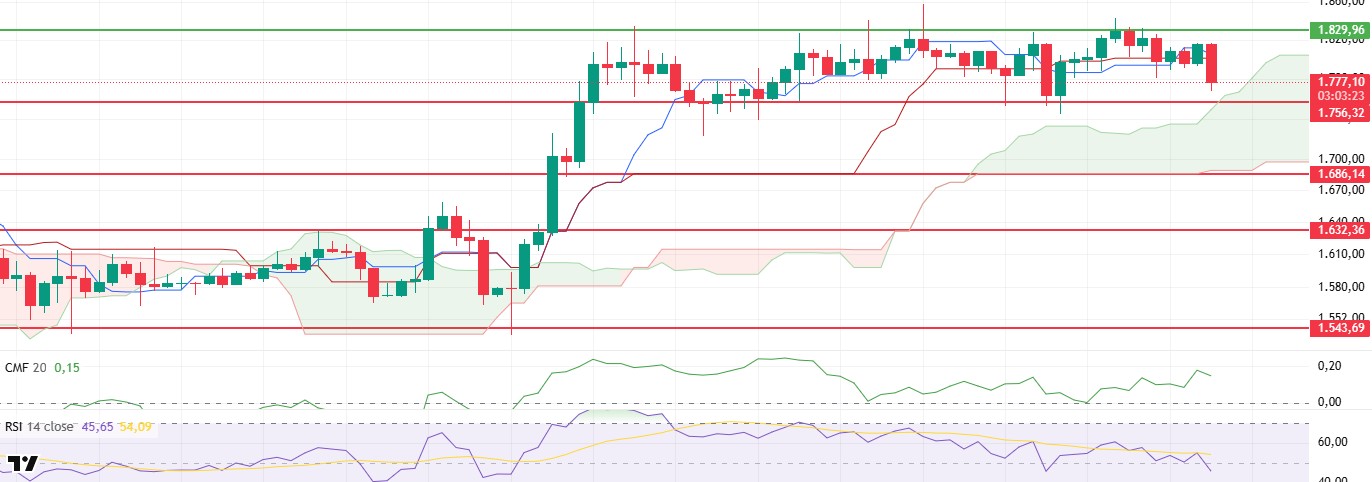
The cryptocurrency market was under selling pressure during the day and a general retracement was experienced due to the impact of macroeconomic data from the US today. This negative sentiment also affected ETH, which dipped below the critically important $1,800 level. With the loss of this threshold, signals of weakness in technical indicators became more pronounced and the deterioration in market structure became clear.
When technical indicators are analyzed in detail, it is seen that the Relative Strength Index (RSI) indicator continues its downward movement and moves towards the oversold zone. This indicates that the loss of momentum in the market is deepening, while buyers remain weak. This weakening in momentum is an important warning that the downtrend is not over yet. On the other hand, the Chaikin Money Flow (CMF) indicator signaled a short-term recovery during the day, but turned down again as the price came under selling pressure again. This indicates that money entering the market is decreasing and capital outflows are accelerating. In the evaluation made on the Ichimoku Cloud indicator, although there was a short-term recovery signal in the morning hours with the Tenkan level cutting the Kijun level upwards, it is observed that this movement could not be permanent and the Tenkan level fell below the Kijun level again. This development suggests that the uptrend remains weak and the market is starting to display a directionless outlook. In addition, the fact that the price has retreated to the lower boundary of the Ichimoku cloud indicates that a technically important support level has been tested.
In line with this technical outlook, if the price breaches the $1,756 level downwards later in the day, it is possible that selling pressure may increase further and the price may retreat towards deeper support levels. In this scenario, the $1,680 level stands out as the next critical support point. A decline below this level could lead to an acceleration of the downtrend. However, if the price manages to hold at $1,756, it may be possible to see a short-term recovery movement towards the Tenkan level again with the purchases coming from this level.
Supports 1,756 – 1,632 – 1,543
Resistances 1,829 – 1,925 – 2,131
XRP/USDT
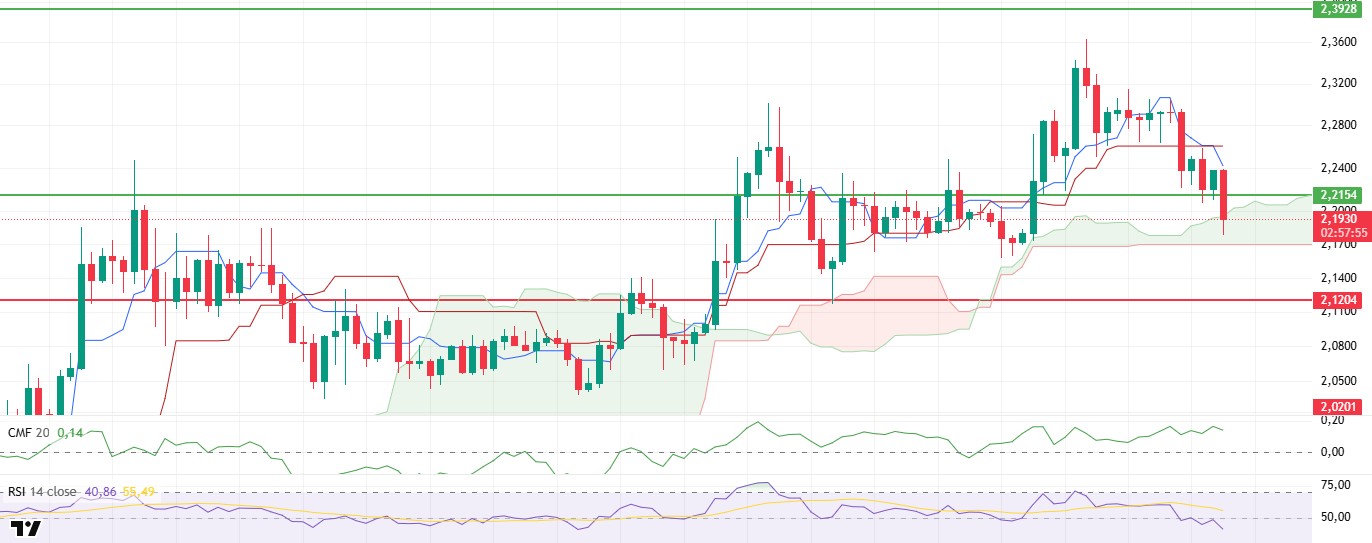
As predicted in the technical analysis in the morning hours, XRP continued its decline by breaking the support line at the $2.21 level downwards and the price fell to the kumo cloud area. This technical breakout further reinforced the market’s weak outlook and strengthened the negative signals in the indicators. This continuation of the price action indicates that the short-term negative outlook is deepening and buyers are losing ground in the market.
Analyzes on the Ichimoku indicator show that the sell signal formed by the Tenkan level cutting the Kijun level downwards is still valid and the price has retreated in a way that confirms this signal. The price, which approached the lower boundary of the Kumo cloud, especially withstood the cloud support at the $2.17 level. This level is technically a very critical threshold. If this support level is breached to the downside, the downtrend in XRP may accelerate and the price is likely to fall to the next support level of $2.12. On the other hand, other technical indicators continue to support the bearish trend. The Chaikin Money Flow (CMF) indicator continues to trend lower, indicating a continued outflow of money from the market, while the Relative Strength Index (RSI) remains bearish, heading towards oversold territory.
As a result, if the $2.17 level breaks down in the evening hours, XRP’s drop to the $2.12 level stands out as a technically possible scenario. However, if the price rises above the $2.21 level again, this move may weaken the negative outlook in the market and pave the way for the possibility of a short-term recovery.
Supports 2.1204 – 2.0201 – 1.8932
Resistances 2.2154 – 2.3938 – 2.4721
SOL/USDT
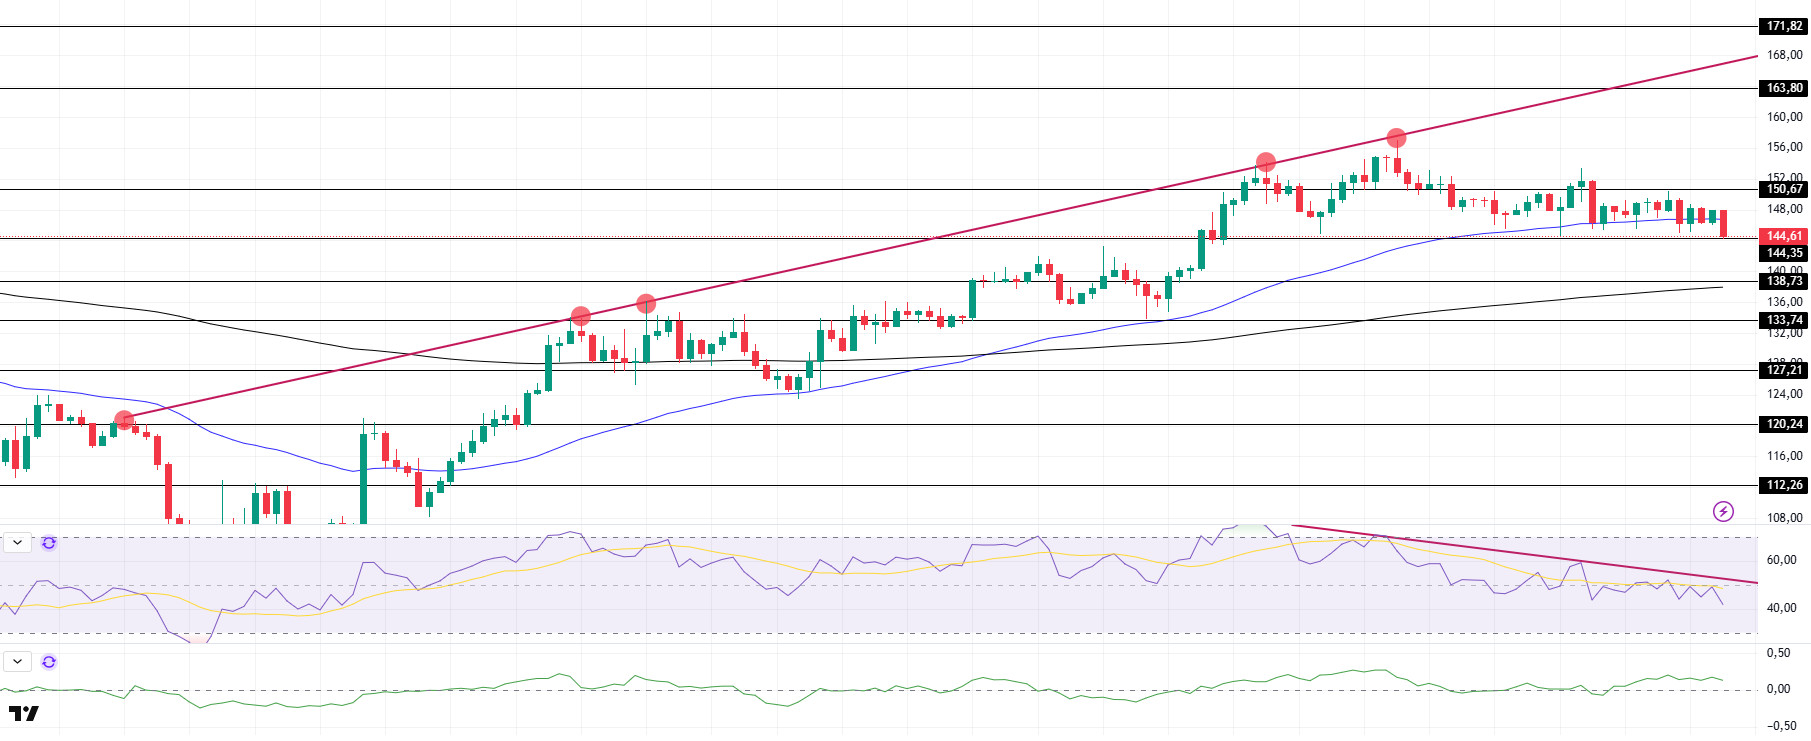
SOL price continued its sideways movements during the day. The asset continues to trade below the resistance level of the ascending line that started on April 6. As of now, it has managed to get support by staying above the 50 EMA (Blue Line). In case this level is broken downwards, the $138.73 level should be followed as an important support level. On the 4-hour chart, the 50 EMA (Blue Line) remains above the 200 EMA (Black Line). This indicates that the upward trend may continue in the medium term. In addition, the fact that the price remains above both moving averages suggests that buying pressure continues across the market. Chaikin Money Flow (CMF20) hovers in positive territory; however, a decline in daily volume may cause CMF to move into negative territory. Relative Strength Index (RSI14), on the other hand, remains below the downtrend that started on April 23 and has moved into negative territory amid selling pressure. The $163.80 level stands out as a strong resistance point in case of a bullish breakout on the back of macroeconomic data or positive news on the Solana ecosystem. If this level is broken upwards, the rise can be expected to continue. If there are pullbacks due to contrary developments or profit realizations, the $138.73 level may be retested. In case of a decline to these support levels, the increase in buying momentum may offer a potential bullish opportunity.
Supports 144.35 – 138.73 – 133.74
Resistances 150.67 – 163.80 – 171.82
DOGE/USDT
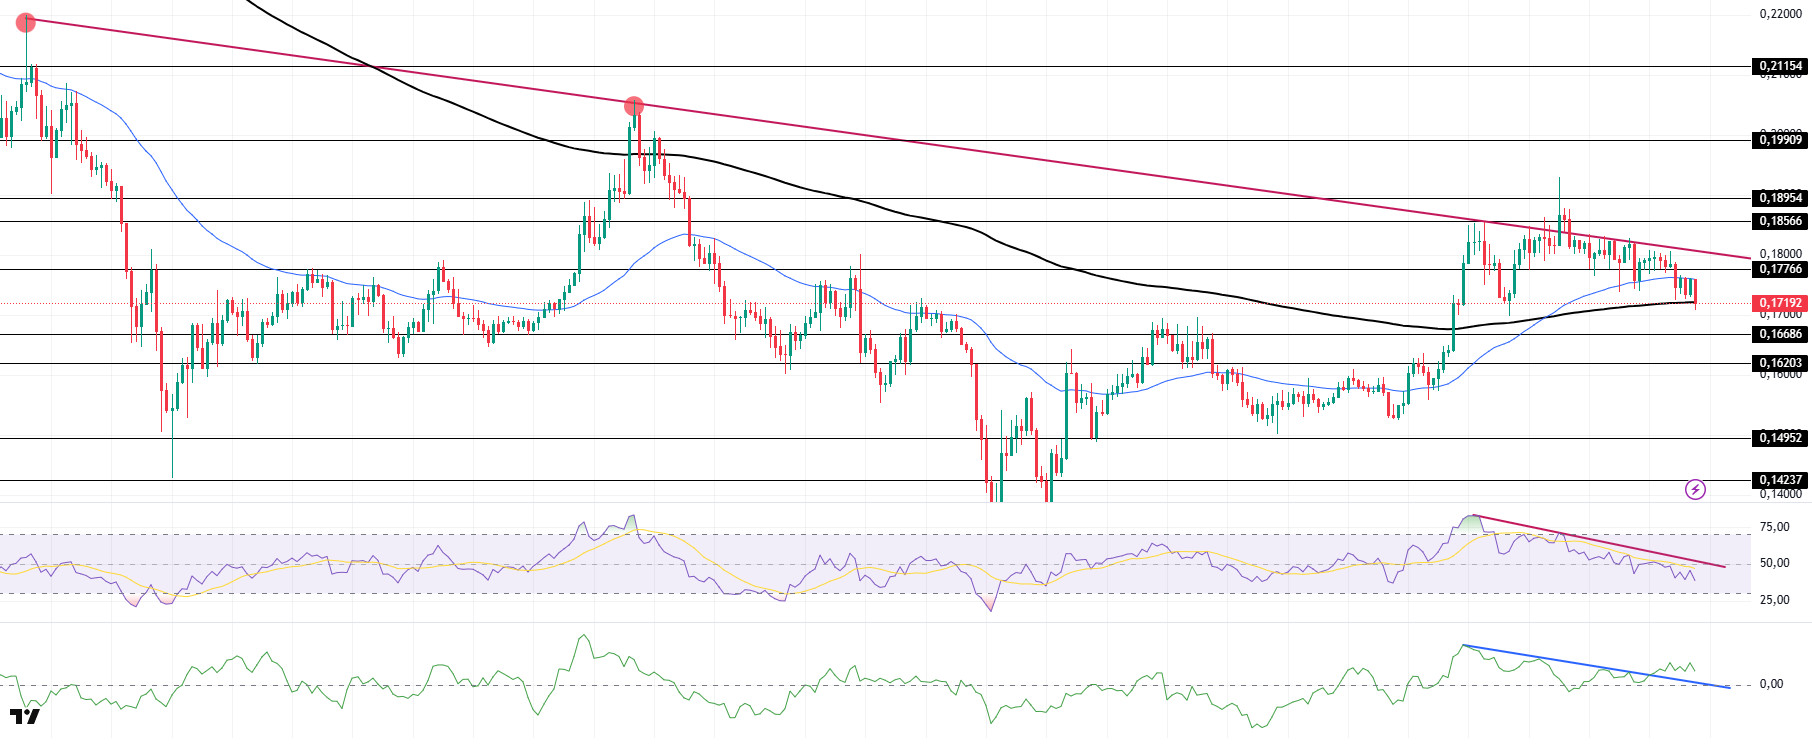
DOGE price moved sideways during the day. Starting on March 6, it tested the downtrend line as resistance but failed to break it and retreated. After breaking the 50 EMA (Blue Line) to the downside, the asset tested the 200 EMA (Black Line) and made a limited rise from there, but is now testing the 200 EMA moving average as support again. In case of a downside break of the 200 EMA, the $0.16686 level should be followed as a strong support. On the 4-hour chart, the 50 EMA is still above the 200 EMA. The fact that the price is between both moving averages indicates that the search for direction in the medium term continues. Chaikin Money Flow (CMF20) indicator remains in positive territory, but inflows are decreasing. On the other hand, the downtrend that started on April 22 has been broken to the upside, suggesting that bullish movements may continue. However, Relative Strength Index (RSI14) is still in negative territory and bullish momentum is weakening. Moreover, the downtrend that started on April 23rd is still in effect. The $0.18954 level stands out as a strong resistance zone in case of possible rises in line with political developments, macroeconomic data or positive news flow in the DOGE ecosystem. In the opposite case or possible negative news flow, the $0.16686 level may be retested. In case of a decline to these levels, the increase in momentum may start a new bullish wave.
Supports 0.16686 – 0.16203 – 0.14952
Resistances 0.17766 – 0.18566 – 0.18954
Legal Notice
The investment information, comments and recommendations contained herein do not constitute investment advice. Investment advisory services are provided individually by authorized institutions taking into account the risk and return preferences of individuals. The comments and recommendations contained herein are of a general nature. These recommendations may not be suitable for your financial situation and risk and return preferences. Therefore, making an investment decision based solely on the information contained herein may not produce results in line with your expectations.


