
TECHNICAL ANALYSIS
BTC/USDT
As US President Donald Trump’s harsh tariff policies continue to affect global markets, National Economic Council Director Kevin Hassett signaled that the rhetoric could be softened. President Trump, on the other hand, emphasized low interest rates again in a post. On the other hand, institutional Bitcoin investor Strategy announced that it did not purchase any new BTC last week. While the company’s total assets remained stable at 528,185 BTC, it reported a paper loss of $ 5.91 billion in the first quarter of the year.
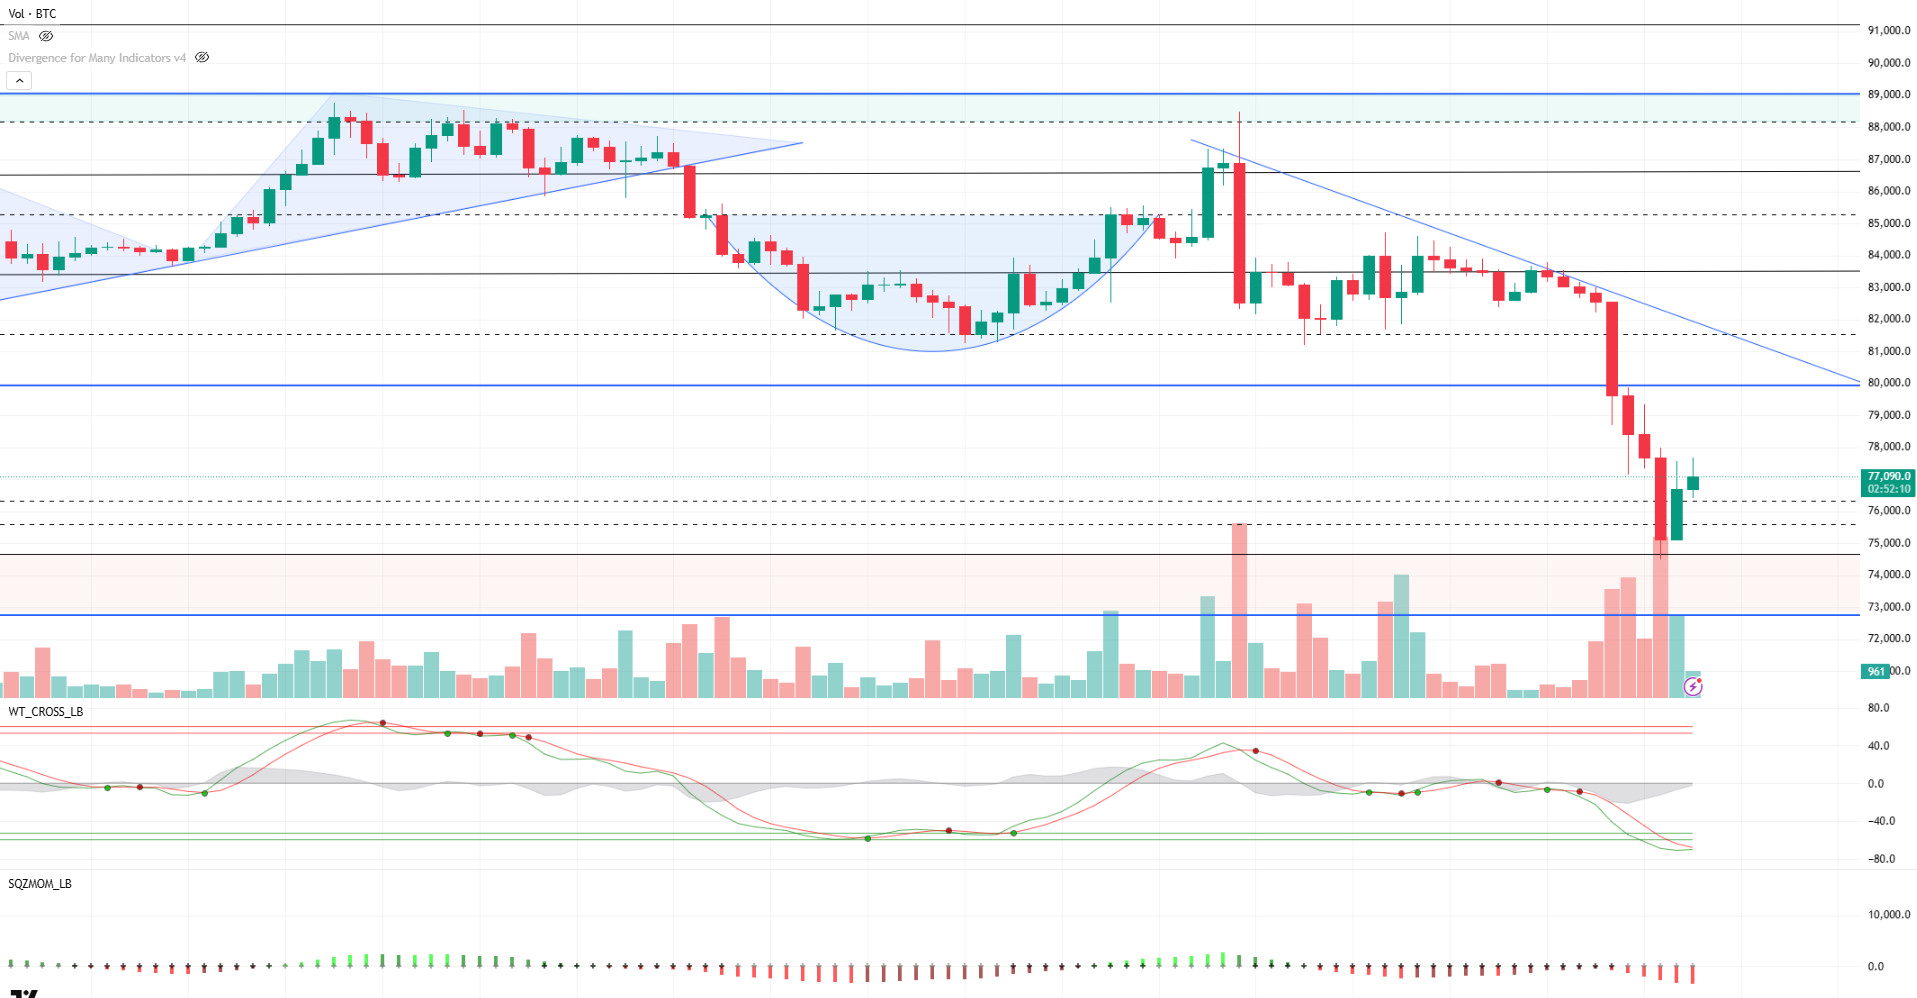
Looking at the technical outlook, BTC, which tested below the 75,000 level in the morning hours, is correcting the decline by making an effort to recover after this decline. In BTC, which was trading at 77,400 at the time of writing, the wave trend oscillator is preparing to generate a buy signal in the oversold zone, while the squeeze momentum indicator continues to weaken in the negative zone. The intense selling wave in Asian and European markets during the day triggered renewed selling pressure in BTC as the negative trend continued in the US futures market. At this point, the statements that may come during the day may be decisive on the direction of the price. Looking at the periodic chart analysis, it is seen that technical indicators maintain the sell signal in both short and medium-term time frames. Liquidation data, on the other hand, indicates that especially short-term investors have started to reopen buying positions from the 75,000 level. Although this indicates that there is a potential search for support at these levels, the uncertainty over the market has not yet disappeared. In the current environment, where uncertainties about tariffs continue, the 80,000 level should be followed as a critical threshold for the direction of BTC. Unless there is persistence above this level, it is difficult to say that the “worst case scenario” is behind us. Otherwise, continued selling pressure could lead BTC to test the 74,600 level once again.
Supports: 74,600 – 72,700- 70,000
Resistances: 76,400 – 78,750 -80,000
ETH/USDT
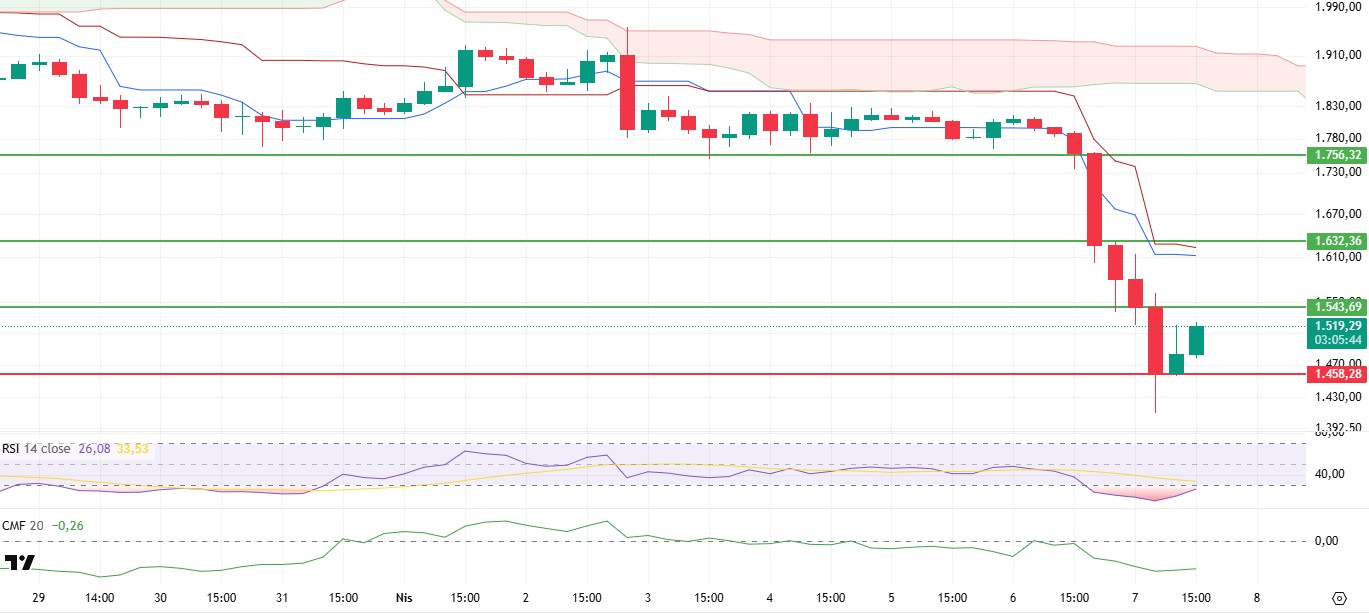
The opening of the US stock markets above pre-market trading prices increased the general risk appetite and paved the way for a limited recovery in crypto assets. With this development, ETH exceeded the $1,458 level during the day and started to persist above $1,500. While regaining this level stands out as an important technical threshold, it gives clues about the short-term direction of the market.
A closer look at the technical indicators shows that the sharp declines observed in the Chaikin Money Flow (CMF) indicator in the previous periods have been replaced by a horizontal outlook. This indicates that the selling pressure and liquidity outflows in the market still persist but have lost momentum. On the other hand, the Relative Strength Index (RSI) is still in the oversold area but has started to show an upward trend. The RSI’s trend out of this region creates a technical backdrop that buying reactions may increase and the price may move to the next resistance level. When the Ichimoku cloud is analyzed, the tankan and kijun lines are close to each other, indicating that the uncertainty about the market direction continues. However, the end of the negative trend observed in the kumo cloud section of Ichimoku indicates that prices may remain stable in this region for a while. This structure suggests that the trend is weakening but there is no clear signal yet in terms of direction.
Although the fact that the ETH price has regained the $1,458 level has somewhat mitigated the downside risks, current technical indicators suggest that the uptrend is not strongly supported. Therefore, the price is likely to move sideways within this band in the short term. However, daily closes above the $1,543 level could lead to a move towards the $1,632 level. On the other hand, a re-break of the $1,458 support could result in a continuation of the downtrend and a test of lower levels.
Supports 1,458 – 1,369 – 1,290
Resistances 1,543 – 1,632 – 1,756
XRP/USDT
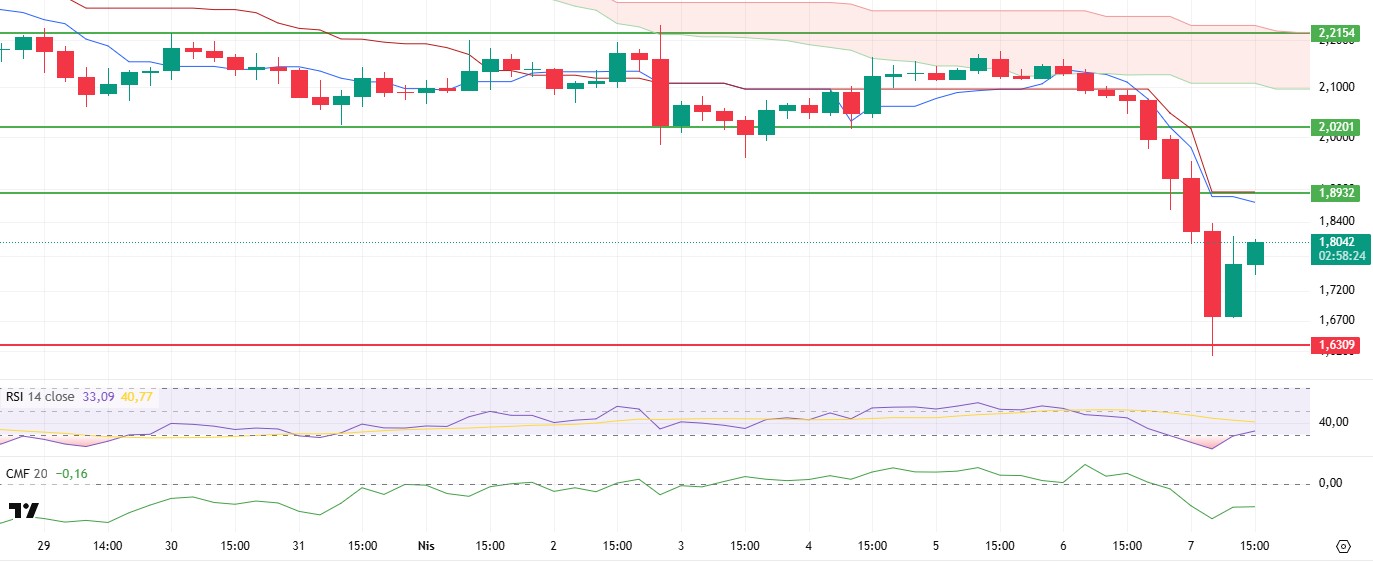
After the recent downward movement, XRP found support by reacting at the level of $1.63 and recovered from this level and rose to $ 1.80 during the day. This price action has both provided some improvement in technical indicators and started to generate signals to turn from neutral to positive in the short-term outlook.
The recovery in the Chaikin Money Flow (CMF) indicator, which decoupled significantly during the downturn, is particularly noteworthy. This improvement in CMF indicates that liquidity outflows from the market have lost momentum and selling pressure has partially subsided. This may be considered as a technical indication that market participants have started to re-buy positions. Similarly, the Relative Strength Index (RSI) indicator’s upward breakout from the oversold area also indicates that the price is in a recovery trend from the lows and gives the first signals of a potential trend reversal.
However, the Ichimoku cloud shows that the tankan-sen and kijun-sen lines are quite close to each other and the price remains below these two levels. This structure suggests that there is a clear indecision about the market direction and that the uptrend is not yet supported by strong momentum. Ichimoku’s overall outlook suggests that uncertainty remains on the XRP side, and the market has yet to generate enough signals to determine direction.
In this context, the fact that the XRP price is moving in the range of $1.89 – $1.63 indicates that the price may follow a horizontal course within this band in the short term. If the price closes above the main resistance level of $1.89, it can be interpreted that the current downtrend has ended and the upward movement can be expected to gain momentum. On the other hand, a downside breach of the $1.63 level could lead to a deepening of the negative trend and a test of lower support levels. Therefore, these two levels stand out as critical technical thresholds that will determine the direction of short-term price movements.
Supports 1.6309 – 1.4264 – 1.2895
Resistances 1.8932 – 2.0201 – 2.2154
SOL/USDT
Pump.fun reintroduces live streaming to 5% of its users with a new moderation policy. SOL price dropped below $100, hitting a 14-month low. A whale address staked 71,318 SOL stakes worth more than $7.63 million. Coinglass data shows that SOL liquidated about $70 million in futures trading in the last 24 hours.
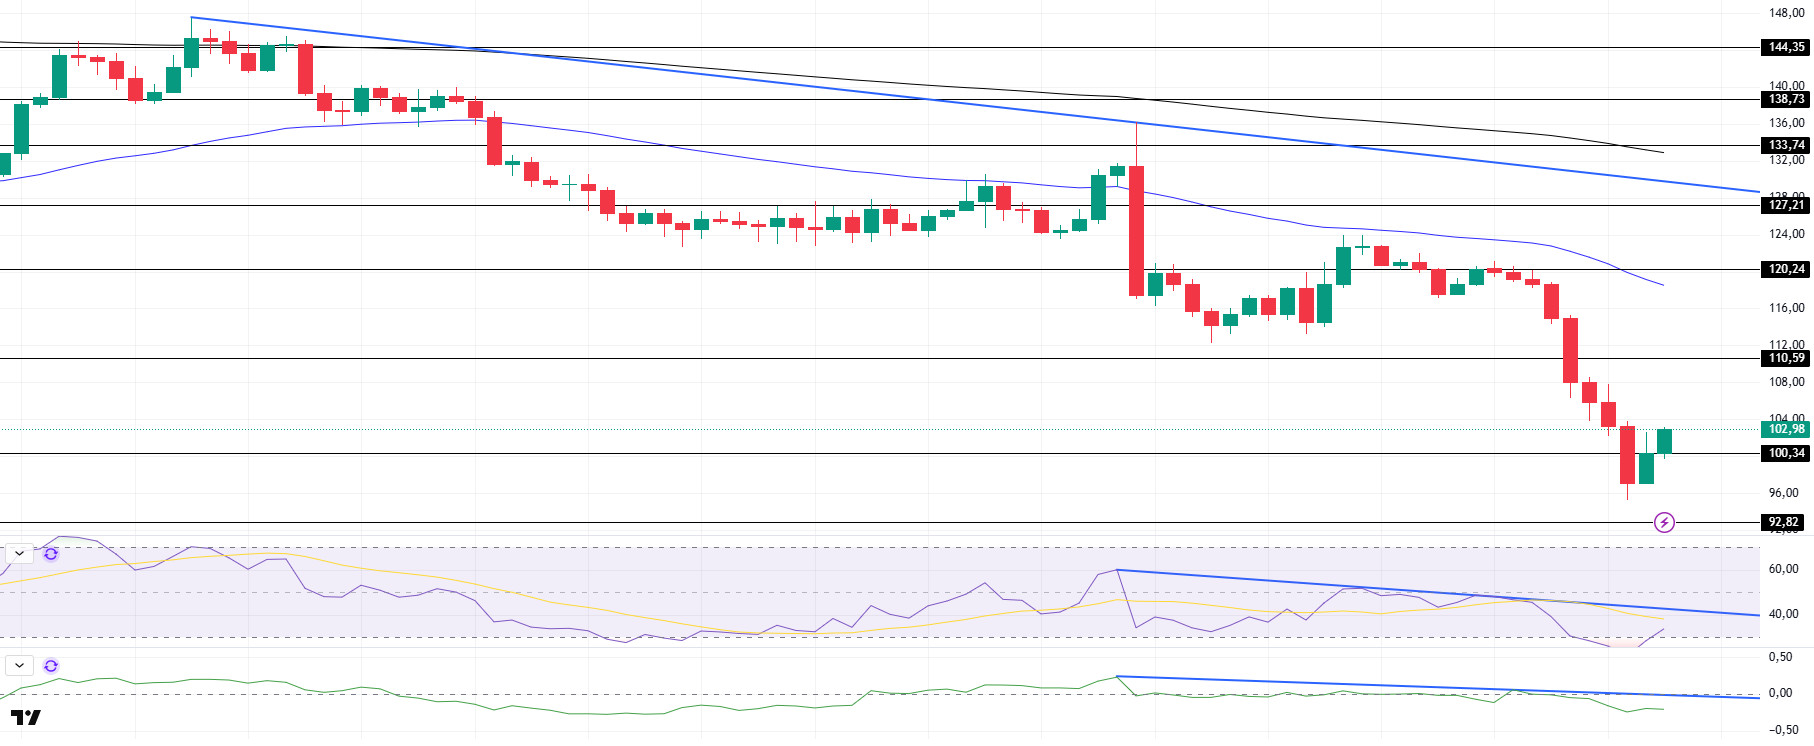
SOL has been slightly bullish since our morning analysis. The asset continued the downtrend that started on March 25, falling as low as December 23, 2023. On the 4-hour timeframe, the 50 EMA (Blue Line) remained below the 200 EMA (Black Line). This could deepen the decline further in the medium term. At the same time, the price continued to move below the two moving averages. When we examine the Chaikin Money Flow (CMF)20 indicator, it is in the negative zone, but the daily volume is positive, which may cause CMF to move back to the positive zone. On the other hand, CMF continued its downtrend that started on April 2. However, the Relative Strength Index (RSI)14 indicator is in oversold territory. This may cause the price to move upwards during the day. The $110.59 level appears as a resistance point in the rises driven by the upcoming macroeconomic data and the news in the Solana ecosystem. If it breaks here, the rise may continue. In case of retracements for the opposite reasons or due to profit sales, the support level of $ 92.82 can be triggered. If the price comes to these support levels, a potential bullish opportunity may arise if momentum increases.
Supports 100.34 – 92.82 – 87.23
Resistances 110.59 – 120.24 – 127.21
DOGE/USDT
In 24 hours, $13.9 million worth of DOGE futures were liquidated. Whale wallets added 750 million DOGE on dips.
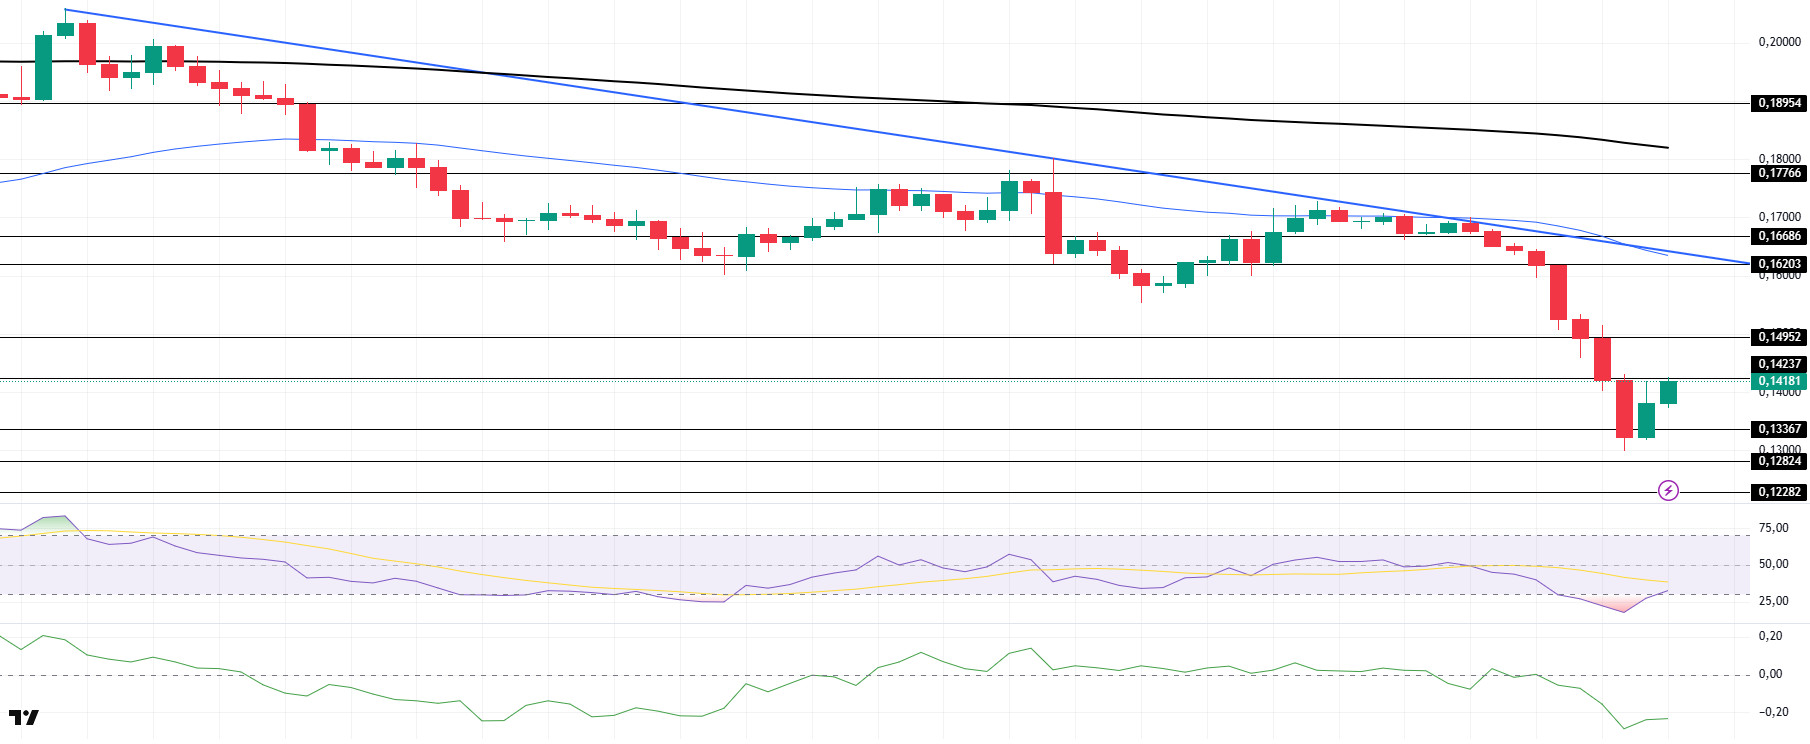
DOGE has been slightly bullish since our morning analysis. The asset continues to hover below the downtrend that started on March 26. After breaking the strong support at $0.14952, the price tested the strong support at $0.13367 and moved higher. On the 4-hour timeframe, the 50 EMA (Blue Line) continues to be below the 200 EMA (Black Line). This could mean that the decline could deepen in the medium term. However, the price continues to price below the two moving averages. The Chaikin Money Flow (CMF)20 indicator is in the extreme negative territory. In addition, the fact that the 24-hour volume is on the plus may increase the inflows, allowing CMF to move into the positive zone. On the other hand, Relative Strength Index (RSI)14 is in oversold territory. This may reduce selling pressure. The $0.14237 level stands out as a very strong resistance point in the rises due to political reasons, macroeconomic data and innovations in the DOGE coin. In case of possible pullbacks due to political, macroeconomic reasons or negativities in the ecosystem, the $ 0.12824 level, which is a strong support place, is an important support place. If the price comes to these support levels, a potential bullish opportunity may arise if momentum increases.
Supports 0.13367 – 012824 – 0.12282
Resistances 0.14237 – 0.14952 – 0.16203
Legal Notice
The investment information, comments and recommendations contained herein do not constitute investment advice. Investment advisory services are provided individually by authorized institutions taking into account the risk and return preferences of individuals. The comments and recommendations contained herein are of a general nature. These recommendations may not be suitable for your financial situation and risk and return preferences. Therefore, making an investment decision based solely on the information contained herein may not produce results in line with your expectations.
