
TECHNICAL ANALYSIS
BTC/USDT
Despite US President Donald Trump’s harsh tariff policies that have caused turbulence in both crypto and traditional financial markets, Bitcoin has shown a more robust stance against declines. Compared to past crisis periods, Bitcoin prices have often experienced sharp corrections of more than 50%. This is a factor that strengthens the thesis that BTC is digital gold in the long run. In addition, such declines are considered as a demand collection area for new investors to join the market.
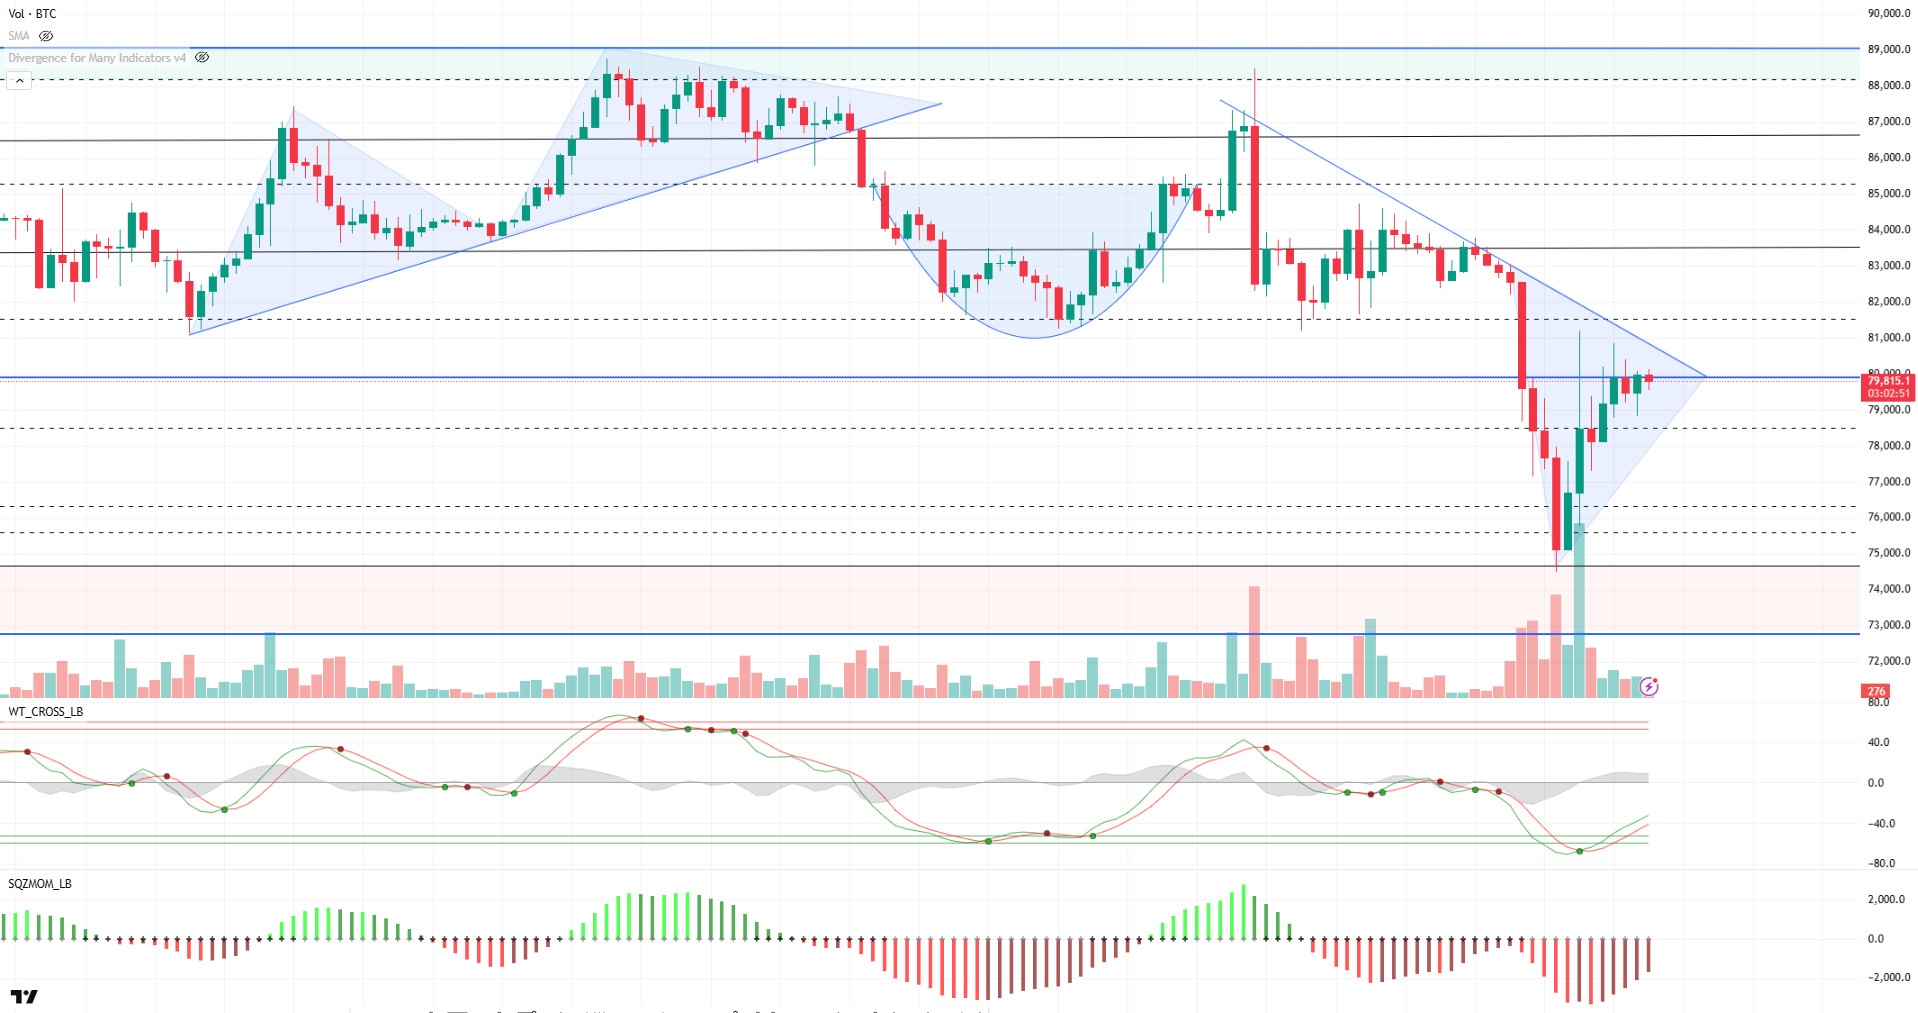
Looking at the technical outlook, BTC corrected to price just below the 80,000 level and exhibited low volatility with low volume during the day. Compared to the previous analysis, the fact that the price is still trading around 79,600 levels stands out as an important sign that the market is focusing on fundamental developments rather than technicals. BTC, which tested below the 75,000 level due to the impact of tariff policies, continues to be on the agenda as the possibility of retesting this level remains on the agenda due to the ongoing market uncertainty. Liquidation data also supports this view; It is observed that the accumulation of long transactions in the 75,000 region has increased and these levels have become critical in terms of liquidity. In such a scenario, if the price reacts from this support level and forms a double bottom formation and then the pattern is confirmed, it may bring the possibility of a medium-term recovery to the agenda. Looking at the technical indicators, the Wave Trend Oscillator is still generating a buy signal, while momentum indicators have not yet clearly accompanied this move. A recovery in momentum may support a short-term upward movement. However, in order for this movement to be permanent, fundamental developments should also support this technical outlook. Otherwise, upward attempts are likely to remain limited and selling pressure is likely to reappear. In the short term, exceeding the 80,000 level may be a positive signal in technical terms, but in order for this movement to gain strength, it is of great importance to increase momentum and to experience developments that will increase risk appetite on the fundamental side.
Supports: 78,500 -76,400 – 74,600
Resistances 80,000 – 81,500 – 83,500
ETH/USDT
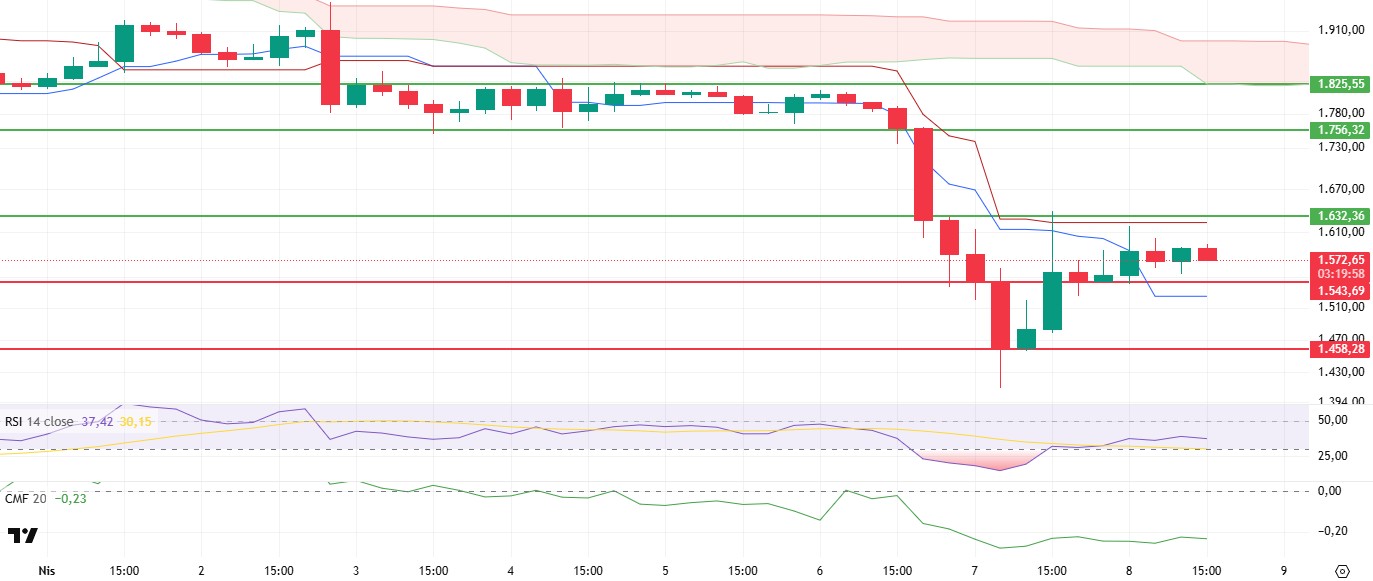
ETH continues to move horizontally in a narrow band during the day in line with expectations. While the price consolidated between the levels of $1,543 – $1,632, it is seen that this compression is reflected in technical indicators as stasis. The inability to determine a clear direction in the market in this process indicates both the cautious stance of investors and the increasing influence of external factors, especially macroeconomic developments. If the recovery trend in the US stock markets continues, it is among the possible scenarios that upward movements in the cryptocurrency market, especially on the ETH side, will gain momentum later in the day.
Analyzing the technical indicators, the fact that the Chaikin Money Flow (CMF) indicator is moving horizontally in the negative zone indicates that a balance has been established between buyers and sellers in the market, but capital inflows have not yet started a clear upward trend. This may indicate a limited recovery in the risk appetite of market players. On the other hand, the Relative Strength Index (RSI), although it has broken out of the oversold zone, suggests that the upside momentum remains weak and buying pressure has not yet reached a sufficient level. The Ichimoku indicator is stuck between the kijun and tenkan levels, indicating that the market remains indecisive and it is difficult to determine a clear direction
All these technical data support that the sideways trend may continue in the short term. However, the limited positive outlook seen in the US futures markets may pave the way for ETH to attempt an upward breakout, especially in the evening hours. In this context, the $1,632 level stands out as a critical resistance point. If this level is exceeded in volume, it may be possible for the price to gain momentum up to $1,756. However, downside risks should not be ignored. Especially if the support point at the $1,458 level is broken, the possibility of triggering deeper declines on the ETH side will increase.
Supports 1,458 – 1,369 – 1,290
Resistances 1,543 – 1,632 – 1,756
XRP/USDT
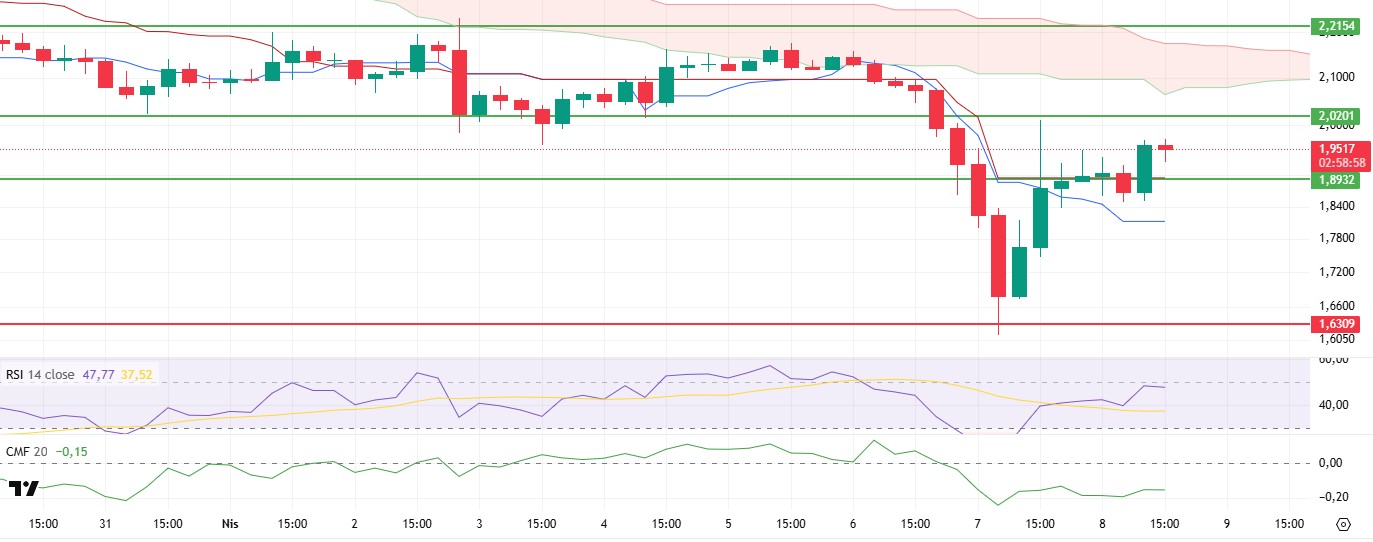
Despite weak signals from technical indicators, XRP rallied strongly earlier in the day, breaking through the $1.89 resistance level and climbing as high as $1.97. The main trigger for this rise was the news that Ripple acquired brokerage firm Hidden Road for $1.25 billion. While this development created a positive perception in the markets, it is observed that there has been a significant recovery in technical indicators with this rise.
Although the Chaikin Money Flow (CMF) indicator remains flat in the negative territory, this indicates that liquidity outflows are slowing down and the market is starting to restore the balance between buyers and sellers. This indicates that the selling pressure on the market has eased and a short-term balance has been established between the parties. On the other hand, the Relative Strength Index (RSI) rose above the Based MA, indicating that the market momentum is strengthening and buying is gaining momentum. This development supports that buyers have started to enter the market more strongly. On the Ichimoku indicator side, the price breaking above both Tenkan-sen and Kijun-sen levels is an important signal that the uptrend is sustainable. In particular, the upward crossing of these two reference levels is a critical indicator for the continuation of the trend in technical analysis and confirms XRP’s upward movement potential.
In general assessment, if the price does not fall below the $1.89 level again, the possibility of a new bullish attack towards the $2.02 level in the evening seems quite strong. If this level is exceeded, it may be possible to accelerate the rise further and test new resistance zones. However, if the $1.89 level is lost, the current positive technical outlook may lose its validity, which may pave the way for deepening correction movements in XRP.
Supports 1.6309 – 1.4264 – 1.2895
Resistances 1.8932 – 2.0201 – 2.2154
SOL/USDT
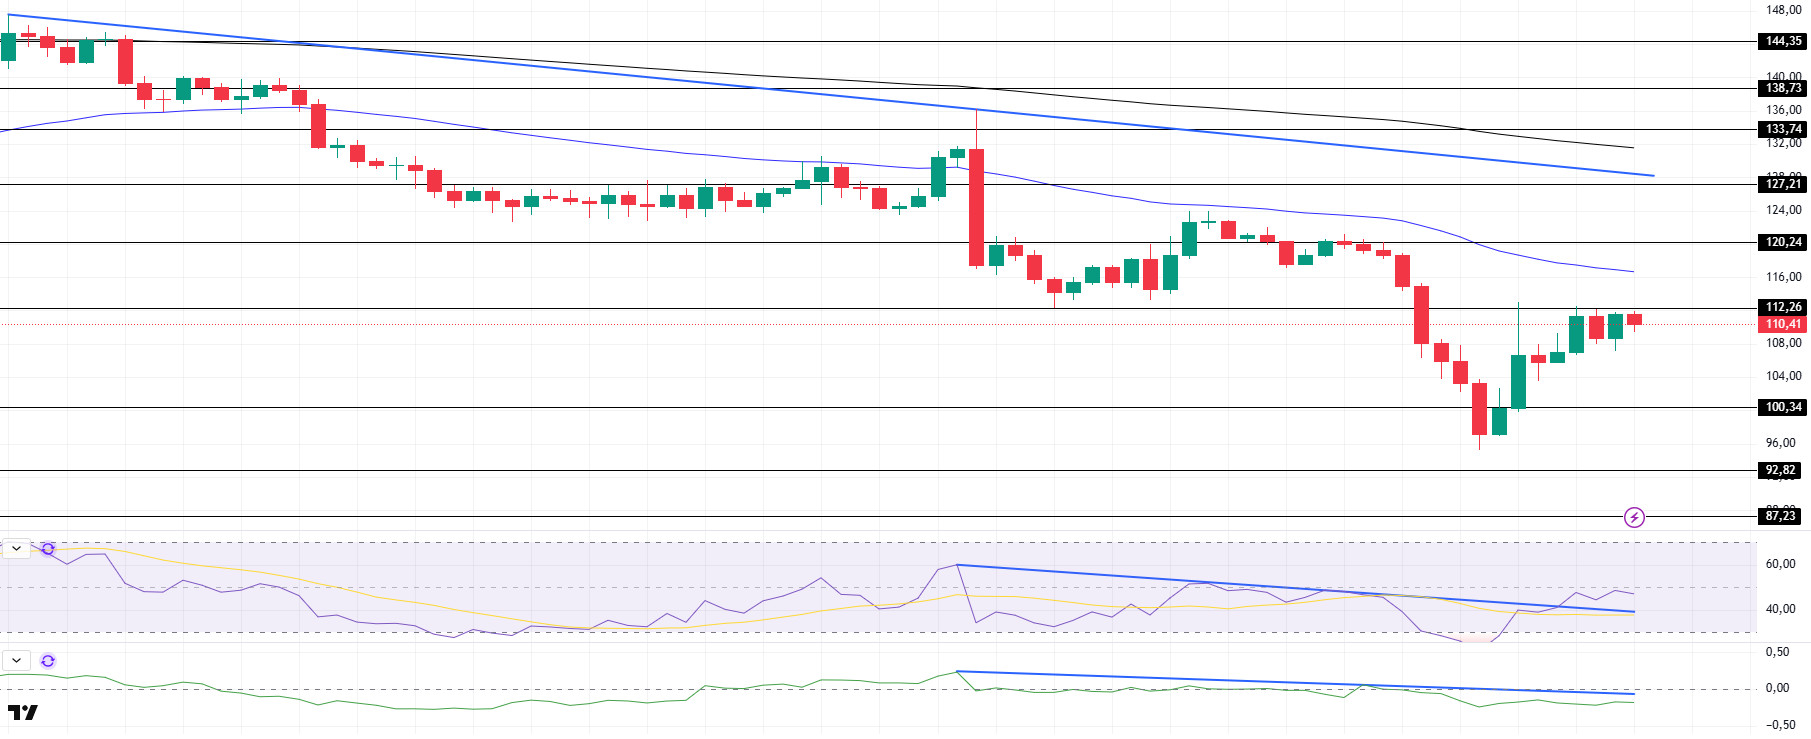
SOL has moved sideways since our morning analysis. The asset continues to maintain the downtrend that started on March 25th. On the 4-hour timeframe, the 50 EMA (Blue Line) remained below the 200 EMA (Black Line). This could deepen the decline further in the medium term. At the same time, the price continues to move below the two moving averages. When we analyze the Chaikin Money Flow (CMF)20 indicator, it is in the negative zone, but the negative daily volume may keep CMF in the negative zone. On the other hand, CMF continued its downtrend that started on April 2. However, the Relative Strength Index (RSI)14 indicator rose from the oversold zone to the upper levels of the negative zone and managed to stay there and broke the selling pressure. At the same time, it broke the downtrend that started on April 2 on the upside. The $112.26 level appears as a resistance point in the rises driven by the upcoming macroeconomic data and the news in the Solana ecosystem. If it breaks here, the rise may continue. In case of retracements for the opposite reasons or due to profit sales, the support level of $100.34 can be triggered. If the price comes to these support levels, a potential bullish opportunity may arise if momentum increases.
Supports 100.34 – 92.82 – 87.23
Resistances 112.26 – 120.24 – 127.21
DOGE/USDT
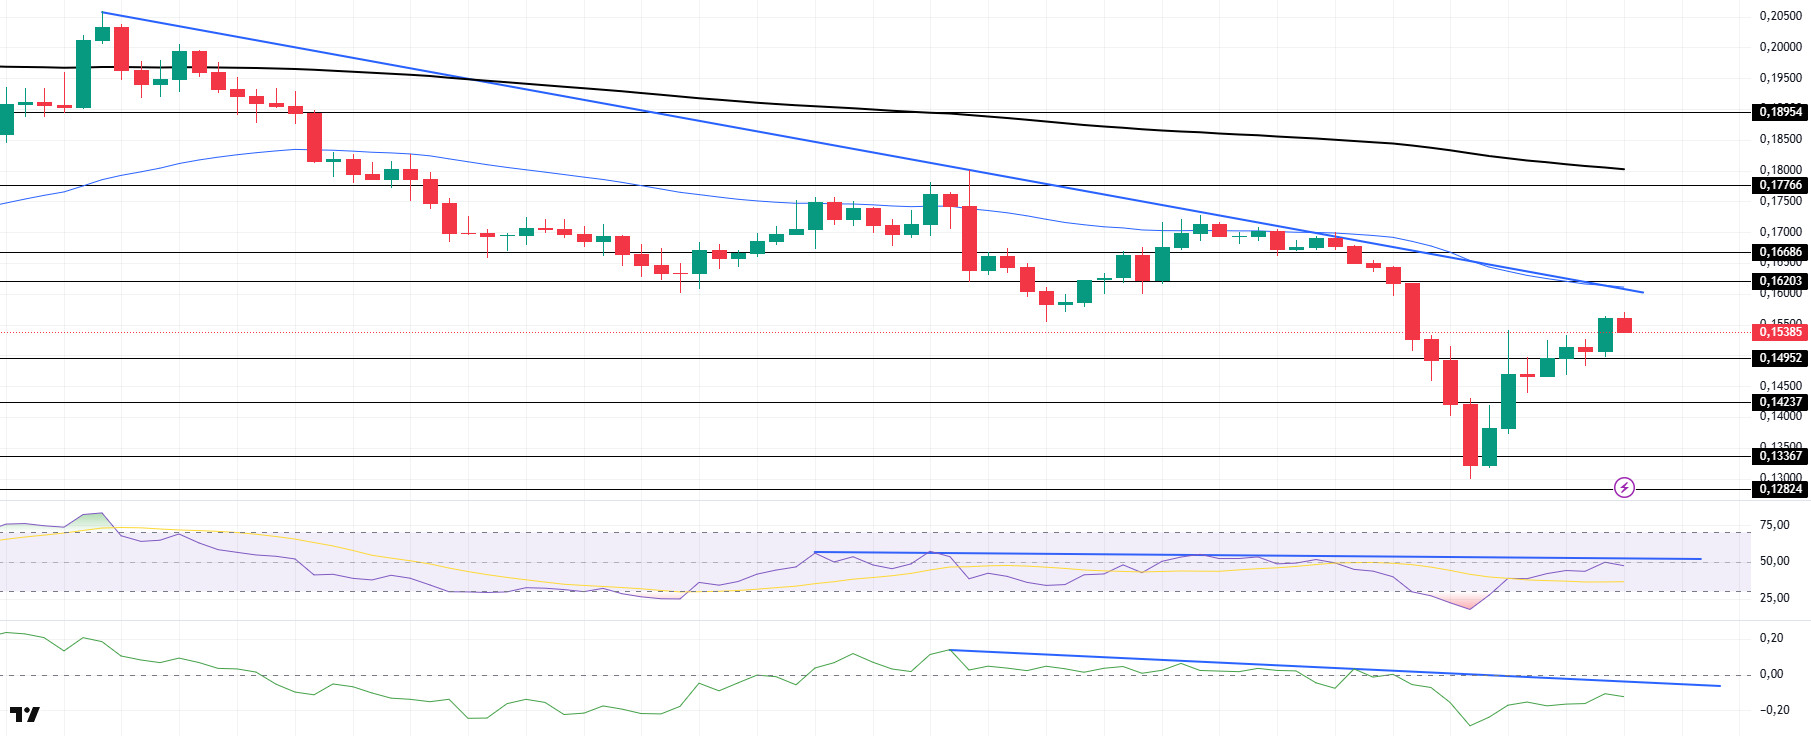
DOGE has continued its uptrend since our morning analysis. The asset continues to hover below the downtrend that started on March 26. Breaking the strong resistance at $0.14952, the asset is currently preparing to test the downtrend as resistance. On the 4-hour timeframe, the 50 EMA (Blue Line) continues to be below the 200 EMA (Black Line). This could mean that the decline could deepen in the medium term. However, the price continues to price below the two moving averages. The Chaikin Money Flow (CMF)20 indicator is at the mid-level of the negative zone. In addition, the fact that the 24-hour volume is in balance shows us that CMF may continue to stay in the negative zone. However, the downtrend continues. On the other hand, the Relative Strength Index (RSI) reached the neutral level by rising from the 14 oversold zone, but selling pressure continues. However, the downtrend that started on April 1 continues. The $0.16686 level stands out as a very strong resistance point in the rises due to political reasons, macroeconomic data and innovations in the DOGE coin. In case of possible retracements due to political, macroeconomic reasons or due to negativities in the ecosystem, the $0.14952 level, which is a strong support place, is an important support place. If the price comes to these support levels, a potential bullish opportunity may arise if momentum increases.
Supports 0.14952 – 0.14237 – 013367
Resistances 0.16203 – 0.16686 – 0.17766
Legal Notice
The investment information, comments and recommendations contained herein do not constitute investment advice. Investment advisory services are provided individually by authorized institutions taking into account the risk and return preferences of individuals. The comments and recommendations contained herein are of a general nature. These recommendations may not be suitable for your financial situation and risk and return preferences. Therefore, making an investment decision based solely on the information contained herein may not produce results in line with your expectations.
