
TECHNICAL ANALYSIS
BTC/USDT
North Korea-linked hacker group Lazarus Group transferred 12,929 BTC, while total Bitcoin assets fell to $1.18 billion. On the macroeconomic front, initial jobless claims in the US were announced as 223,000 in the week ending March 15. On the other hand, today Donald Trump will attend the Digital Asset Summit in New York with a 5-minute pre-recorded video message. Strategy’s chairman of the board Michael Saylor is among the speakers at the event.
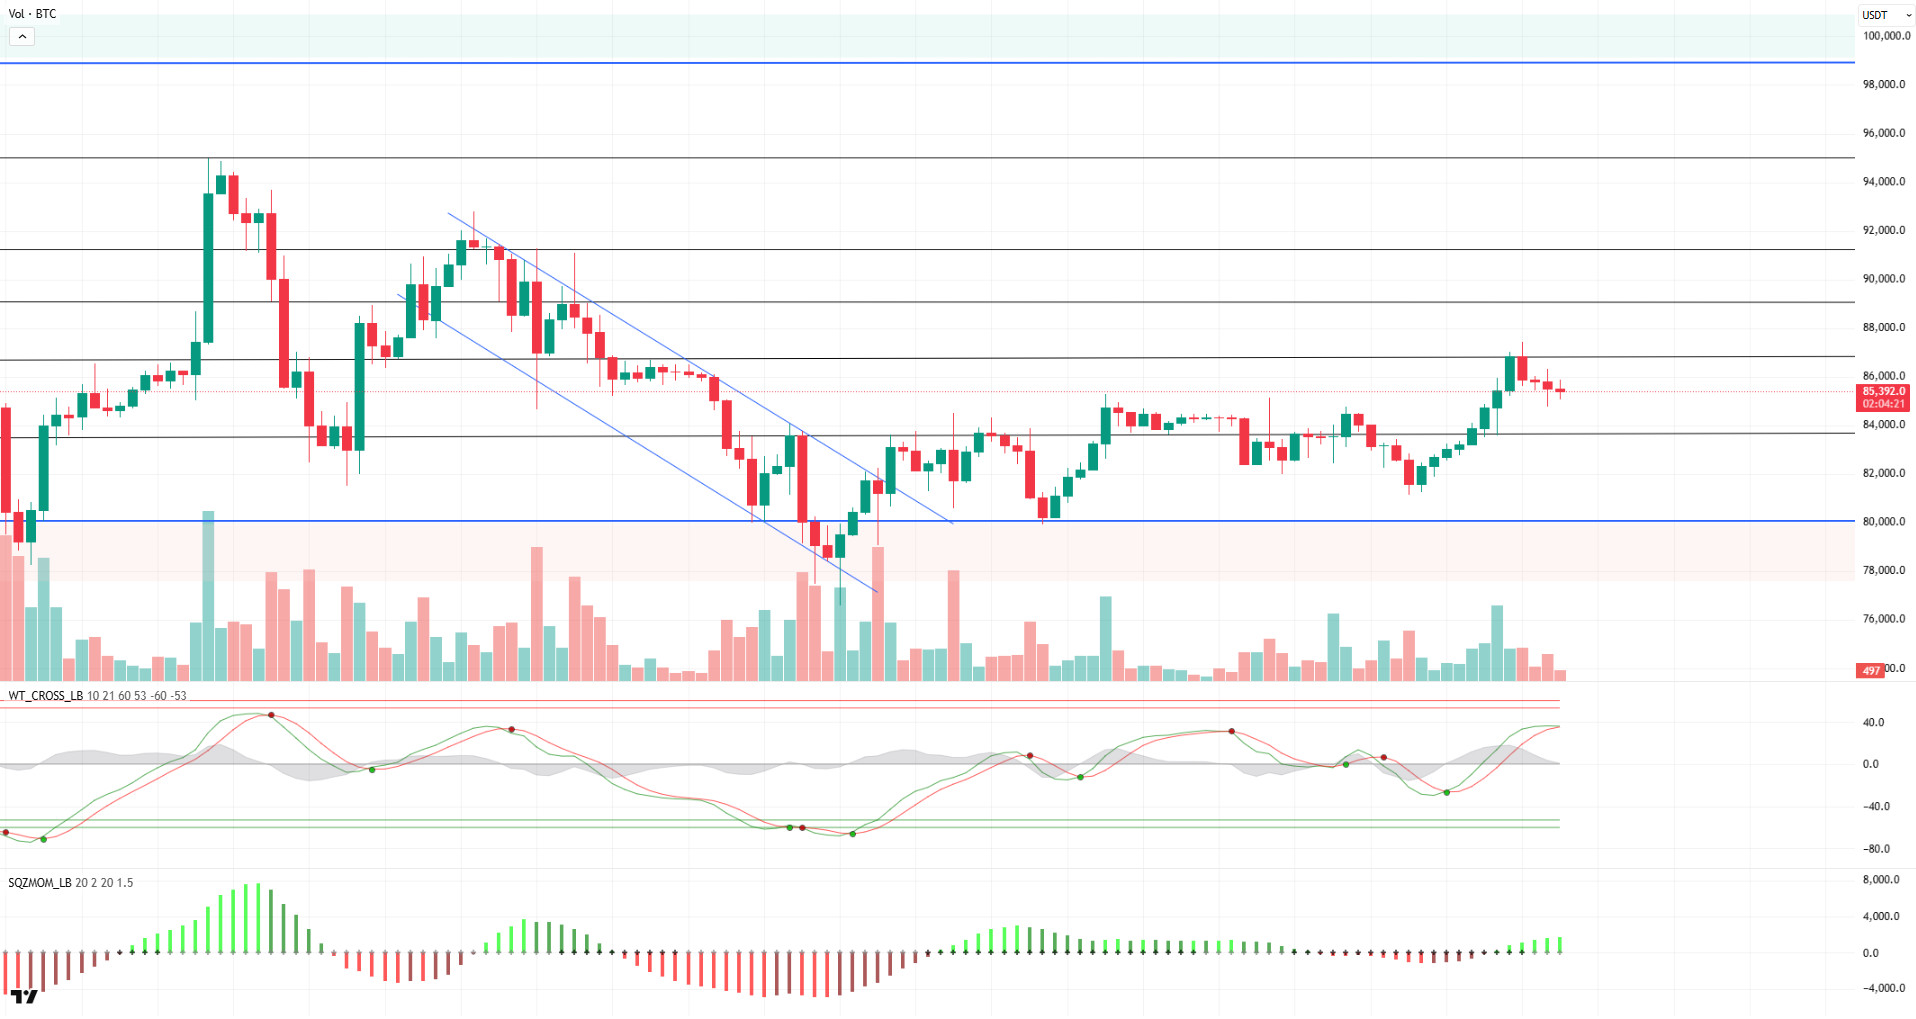
When we look at the technical outlook of BTC, it is observed that it entered a correction process after yesterday’s rise and is currently trading at 85,700. It is noteworthy that the Wave Trend Oscillator’s buy signal has weakened, but the Squeeze Momentum indicator has gained some strength. On the 4-hour chart, it is noticeable that the price is forming a flag pattern. If this pattern holds, BTC is likely to target the 89,000 level. When analyzed periodically, the neutral signal is maintained on the hourly charts, while the buy signal continues on the 4-hour charts. The dominance of long trades on the liquidation heatmap stands out as an important factor that causes the market to focus on the crypto peak. If the upward movement continues, the 86,600 level will be followed as a resistance point. Exceeding this level may contribute to BTC’s upward momentum. In a possible selling pressure, the 83,500 level will be followed as a support point.
Supports 83,500 – 82,400 – 80,000
Resistances 86,600 – 89,000 – 91,400
ETH/USDT
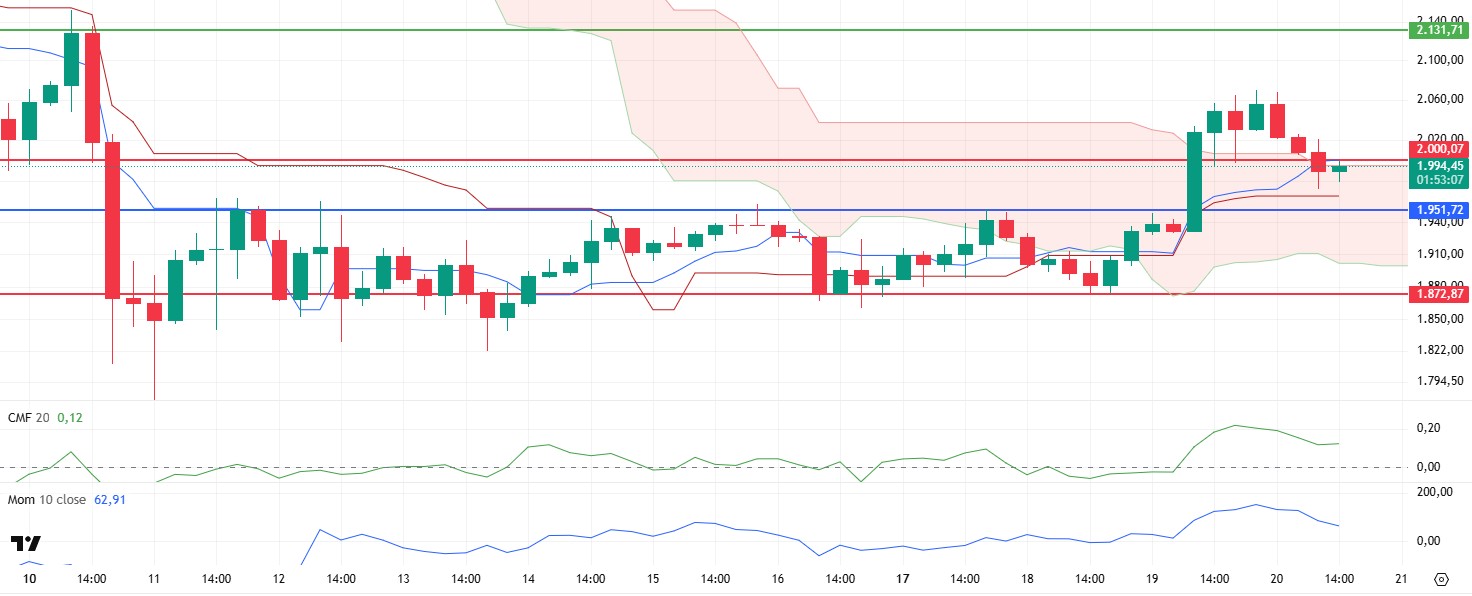
ETH continued its downward movement in the morning hours of the day and fell below the $2,000 level. While this retracement has caused certain changes in the current technical indicators in the market, it gives important signals in terms of the general trend.
In terms of technical analysis, there is a slight decline in the Chaikin Money Flow (CMF) indicator, which is in line with the price retracement. However, CMF is still in positive territory, suggesting that the current selling pressure could be considered as a correction. This suggests that market participants have largely maintained confidence in the market and that the sell-off does not yet signal a strong trend reversal. The Ichimoku indicator shows that the tenkan level continues to remain above the kijun level. Although this structure indicates that the overall outlook is still positive, the fact that the price is moving at the boundaries of the kumo cloud emphasizes the need for investors to be cautious. If the price movement slips below the kumo cloud, the possibility of a further deepening of the downtrend may come to the fore. However, in the current situation, the fact that the price moves within the cloud boundaries indicates a market structure that is at the decision stage. When looking at momentum indicators, weakness is noteworthy. In particular, the decrease in volume and the loss of momentum in price movements suggest that selling pressure may continue for some more time in the evening hours. However, at this point, it will be important whether critical support levels can be maintained.
In terms of macro developments, the Digital Asset Summit, which will take place today, stands out as an important event for the markets. The topics to be discussed at the summit and especially the statements to be made by former US President Donald Trump may lead to increased volatility in the markets. Since political and macroeconomic factors can directly affect investor sentiment, the impact of these statements on the market should be closely monitored. In terms of technical levels, it will be a critical factor to maintain the intermediate support point at $1.951, indicated by the blue line on the chart. A decline below this level may deepen the selling pressure and pave the way for the price to head lower. However, if the price continues to hold above this level, the possibility of continued short-term positive movements may strengthen.
Supports 1,951 – 1,872 – 1,755
Resistances 2,131 – 2,254 – 2,552
XRP/USDT
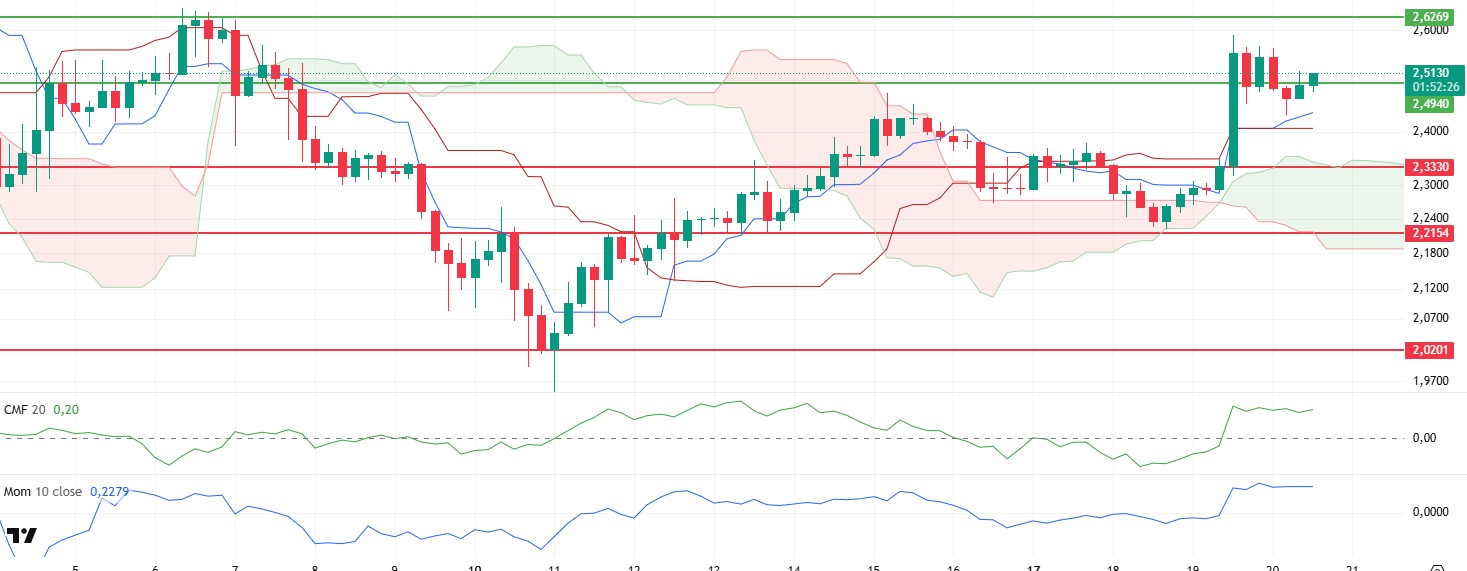
XRP recovered as expected during the day and managed to reach the $2.49 level again. Technical indicators for XRP, which is trying to win this region, seem to continue their horizontal movements.
The horizontal movement of Chaikin Money Flow (CMF) in the positive area indicates that liquidity remains stable, and the positive structure is maintained. Relative Strength Index (RSI) and momentum indicators are also moving sideways and point to a continued positive outlook for XRP.
With the US SEC dropping its lawsuit against Ripple after a four-year legal battle, the ongoing positive movement is supported by technical indicators, indicating that the XRP price is open to steeper rises in the coming period. The $2.49 level has become the support level and it can be said that the upward movement will continue as long as it is not violated.
Supports 2.4940 – 2.3330 – 2.2154
Resistances 2.6261 – 2.8280 – 3.2125
SOL/USDT
Launched on March 17, CME SOL futures recorded a trading volume of $12.3 million and open interest of $7.8 million.
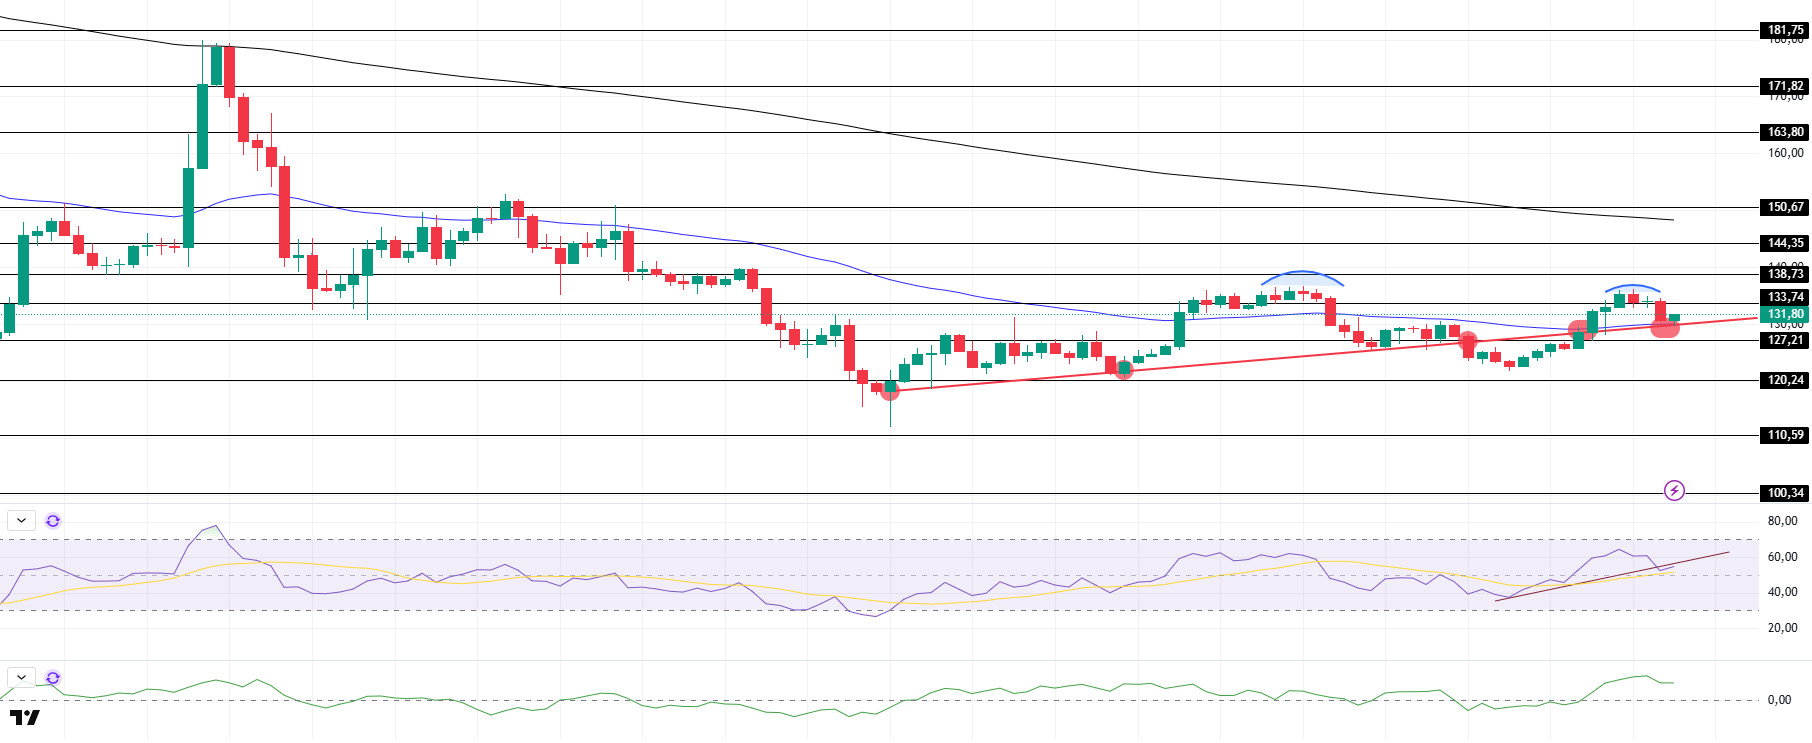
SOL has declined since our morning analysis and is currently testing the March 11 uptrend and the 50 EMA (Blue Line) as support. On the 4-hour timeframe, the 50 EMA (Blue Line) remained below the 200 EMA (Black Line). This could deepen the decline further in the medium term. At the same time, the price is moving between two moving averages. However, a large difference between the two moving averages may cause the asset to rise. When we examine the Chaikin Money Flow (CMF)20 indicator, it has moved into the positive zone. In addition, the high 24-hour volume may further increase money inflows. However, although the Relative Strength Index (RSI)14 indicator moved into positive territory, it has been declining since the morning, approaching the neutral zone and breaking the uptrend of March 18 downwards. This may cause the asset to fall further. On the other hand, the double top pattern should be taken into consideration. The $150.67 level appears to be a very strong resistance point in the rises driven by both the upcoming macroeconomic data and the news in the Solana ecosystem. If it breaks here, the rise may continue. In case of retracements for the opposite reasons or due to profit sales, the support level of 120.24 dollars can be triggered. If the price comes to these support levels, a potential bullish opportunity may arise if momentum increases.
Supports 127.21 – 120.24 – 110.59
Resistances 133.74 – 138.73 – 144.35
DOGE/USDT
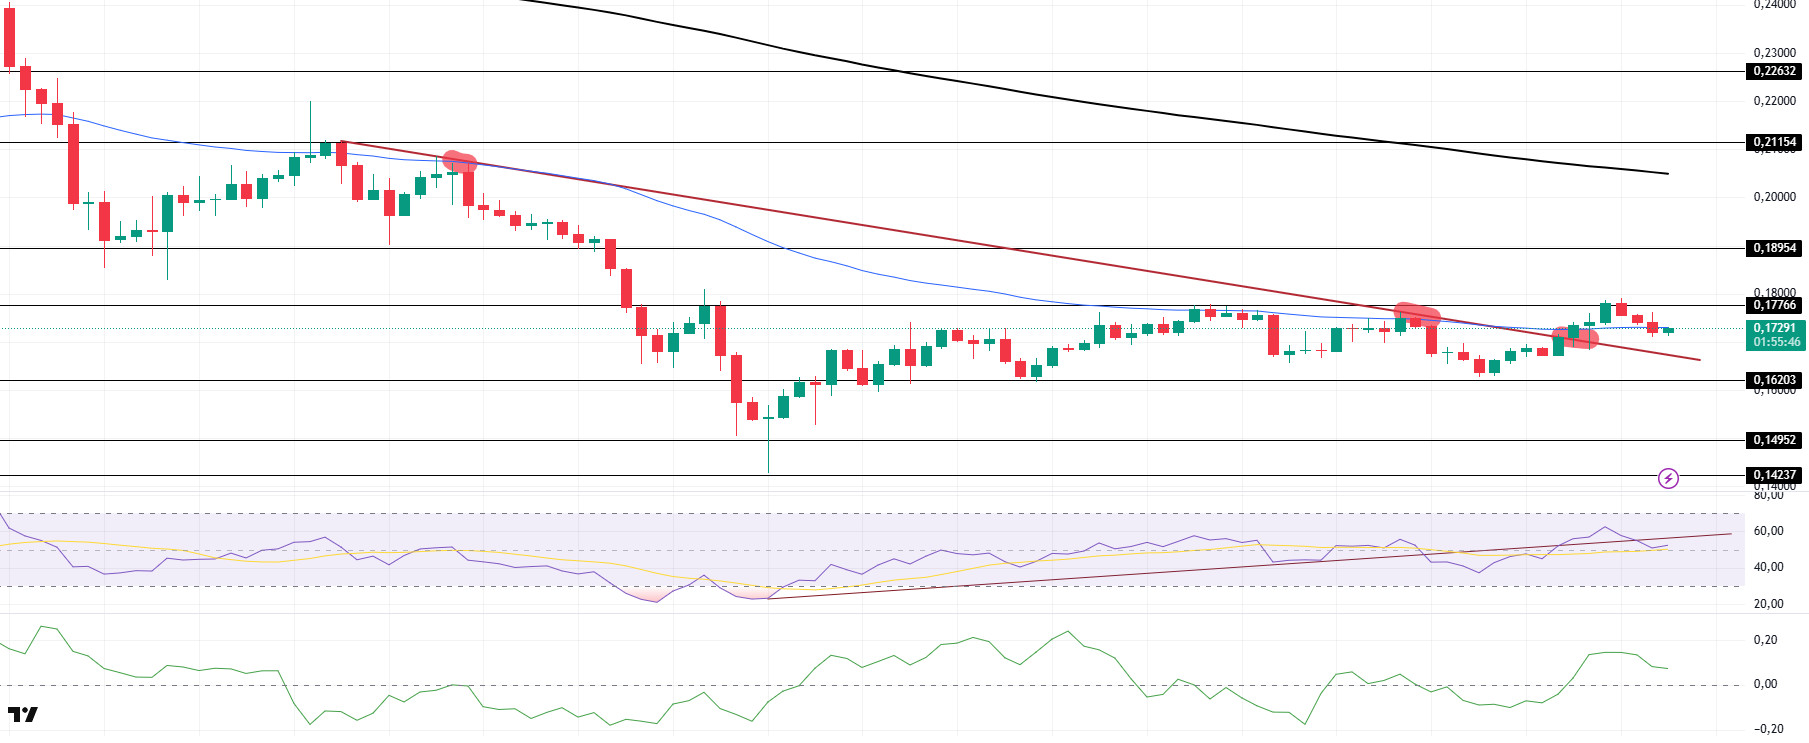
DOGE has retreated since our analysis this morning. Although the asset failed to break the downtrend it has been in since March 6, despite testing it twice before, it failed to break the strong resistance at 0.17766, breaking it on yesterday’s uptrend, and retreated slightly, and as of now, it cannot find support from the 50 EMA (Blue Line) moving average and started pricing below the moving average. On the 4-hour timeframe, the 50 EMA (Blue Line) is below the 200 EMA (Black Line). This could mean that the decline could deepen in the medium term. However, the price started to price below two moving averages. In addition, the difference between the two moving averages is large, which increases the probability that DOGE will rise. When we analyze the Chaikin Money Flow (CMF)20 indicator, it is in positive territory. In addition, the fact that the 24-hour volume is on the plus side may increase inflows and cause CMF to rise further. On the other hand, Relative Strength Index (RSI)14 has moved into the positive zone, but it has declined since the morning and approached the neutral zone. However, it started to position below the uptrend on March 11 again. This may deepen the decline. The level of 0.18954 dollars appears as a very strong resistance place in the rises due to political reasons, macroeconomic data and innovations in the DOGE coin. In case of possible pullbacks due to political, macroeconomic reasons or negativities in the ecosystem, the $0.14952 level, which is the base level of the trend, is an important support. If the price reaches these support levels, a potential bullish opportunity may arise if momentum increases.
Supports 0.16203 – 0.14952 – 0.14237
Resistances 0.17766 – 0.18954 – 0.21154
LEGAL NOTICE
The investment information, comments and recommendations contained herein do not constitute investment advice. Investment advisory services are provided individually by authorized institutions taking into account the risk and return preferences of individuals. The comments and recommendations contained herein are of a general nature. These recommendations may not be suitable for your financial situation and risk and return preferences. Therefore, making an investment decision based solely on the information contained herein may not produce results in line with your expectations.
