
TECHNICAL ANALYSIS
BTC/USDT
As institutional investor interest in the crypto market regains momentum, Bitcoin purchases by major companies have picked up pace again. Strategy bought 6,911 BTC last week, bringing its total holdings to 506,137 BTC, while Metaplanet, Bitdeer, Core Scientific and Bitcoin Depot bought a combined 7,349 BTC. According to CoinShares’ weekly report, the five-week downtrend ended, and digital asset funds recorded net inflows of $644 million. Bitcoin was the biggest gainer with inflows of $724 million.
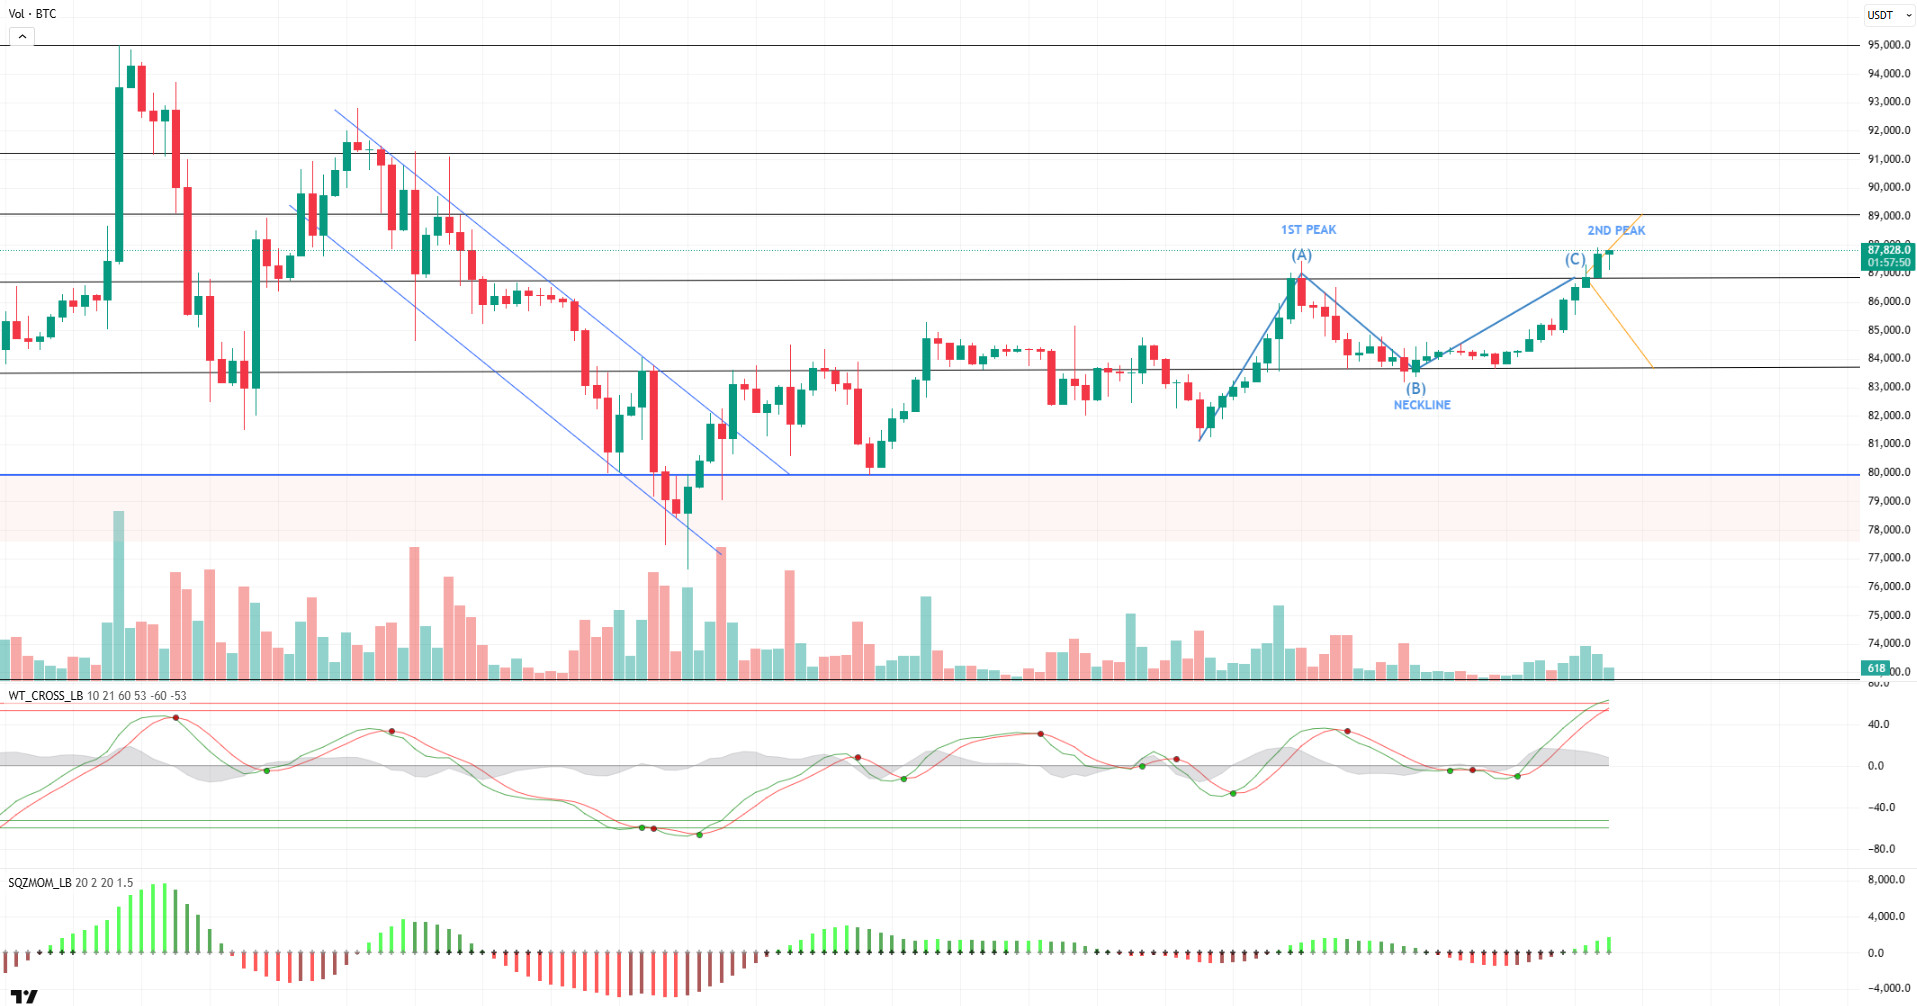
Looking at BTC’s technical outlook, the scenario that the price could target short trades at the 87,600 level by breaking the double top pattern mentioned in the previous analysis has come true. BTC, which broke through the 86,600-resistance level during the day, achieved persistence in this region and tested the 87,850 level and liquidated the short trades there. While the technical oscillators approaching the overbought zone limited the upward momentum, the momentum indicator moved back into the positive zone. BTC, which is currently trading at 87,500, is accumulating at these levels, causing an increase in short trades, while an intense accumulation of short positions at the 88,300 level attracts attention. In a possible correction movement, if the price tests the support level of 86,600, it can be considered as a demand collection zone for the new bullish movement towards the 88,300 level. If the rise does not enter the correction, the 89,000 level appears as a resistance point. In a possible pullback, if it slips below 86,600, the double top pattern becomes active again and selling pressure may deepen. In this scenario, BTC is likely to make a corrective move towards lower support levels.
Supports 86,600 – 83,500 – 82,400
Resistances 89,000 – 91,400 – 92,800
ETH/USDT
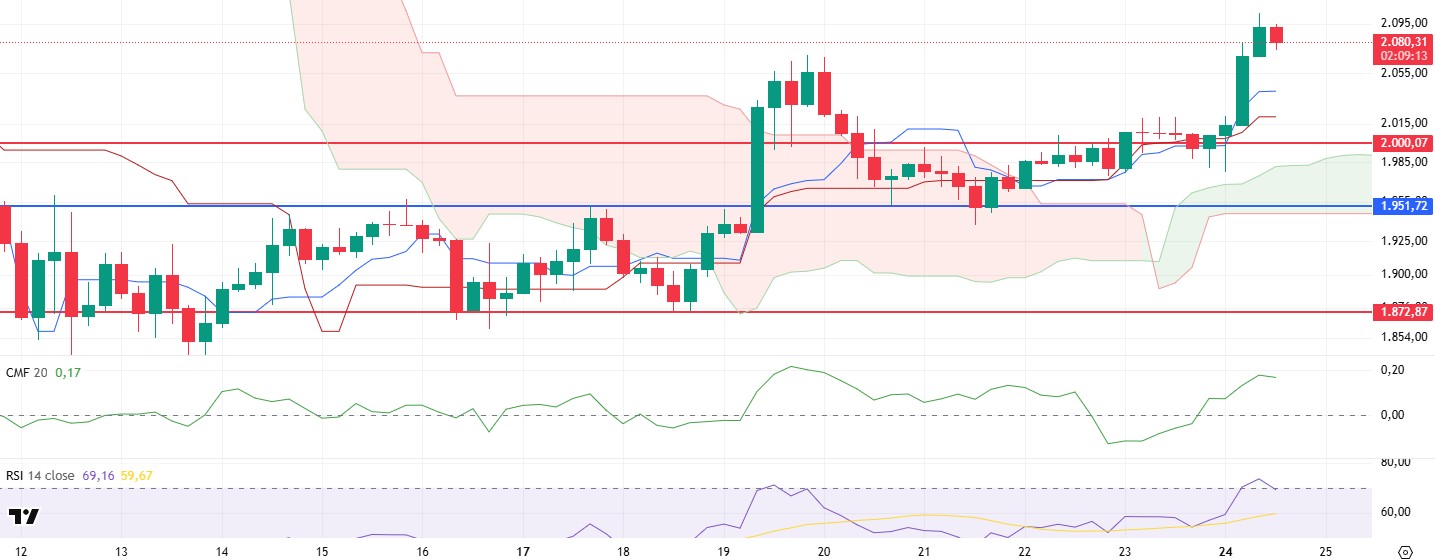
ETH moved sideways in this region, reaching as high as $2,090 during the day after its morning surge. In particular, the fact that it closed above the previous peak level of $ 2,068 supports the positive outlook. Staying above this level increases the likelihood of the rise continuing.
Looking at the technical indicators, the positive signal formed by the intersection of the tankan and kijun lines on the Ichimoku indicator continues. The fact that the price remains above the kijun, tankan and kumo cloud also indicates that the uptrend continues. The upward momentum is maintained with the Chaikin Money Flow (CMF) indicator moving into positive territory, while Cumulative Volume Delta (CVD) data also shows that spot purchases are increasing. This continues to have a positive impact on the price. On the other hand, the Relative Strength Index (RSI) indicator is in overbought territory, pointing to a possible correction. However, the RSI has not turned structurally negative for now and has not shown any negative divergence during the rise. This shows that the overall positive structure is maintained.
Looking at the overall picture, technical indicators suggest that the uptrend could continue and the price could go as high as $2,131. However, if the $2,068 level is lost, a short-term correction may occur. In this case, the price may fall to the $2,000 level and get a reaction from this region.
Supports 2,000 – 1,951 – 1,872
Resistances 2,131 – 2,254 – 2,507
XRP/USDT
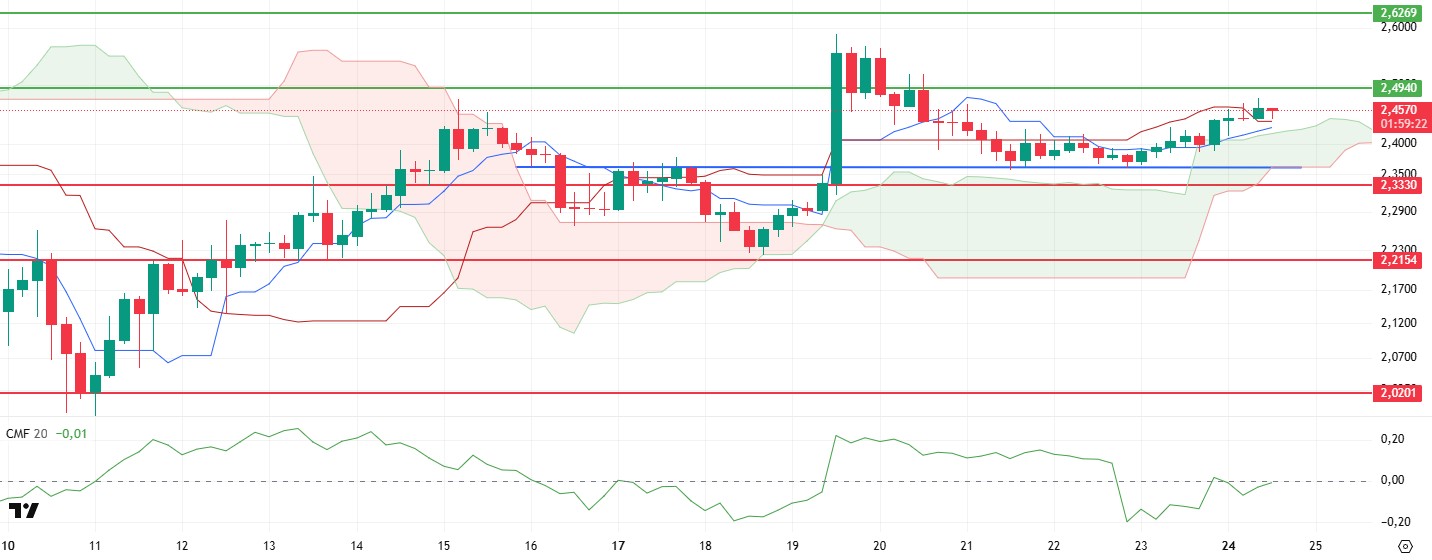
As mentioned in the morning analysis, XRP cannot maintain its upward movement with weak spot support. Technical indicators for XRP, which faced selling pressure at $ 2.47 levels during the day, maintain their structure.
Chaikin Money Flow (CMF) indicator continues to hover in negative territory. However, very important changes are observed in Cumulative Volume Delta (CVD) data. Spot buying has increased again in recent hours, while selling positions have increased in the futures markets. This shows that the spot support mentioned in morning analysis has started slightly. If this situation in CVDs continues, it suggests that upward movements may continue by moving to the positive area in CMF. When the Ichimoku indicator is analyzed, the price rising above the kijun level and the convergence of the tenkan level to the kijun level supports the positive outlook.
As a result, with the changes in indicators and positive structures, the possibility of XRP rising up to $ 2.49 levels is strengthening, and closures above this region may continue the upward movement. Violation of the Kijun level may cause a retracement down to $ 2.33.
Supports 2.3330 – 2.2154 – 2.0201
Resistances 2.4940 – 2.6269 – 2.8280
SOL/USDT
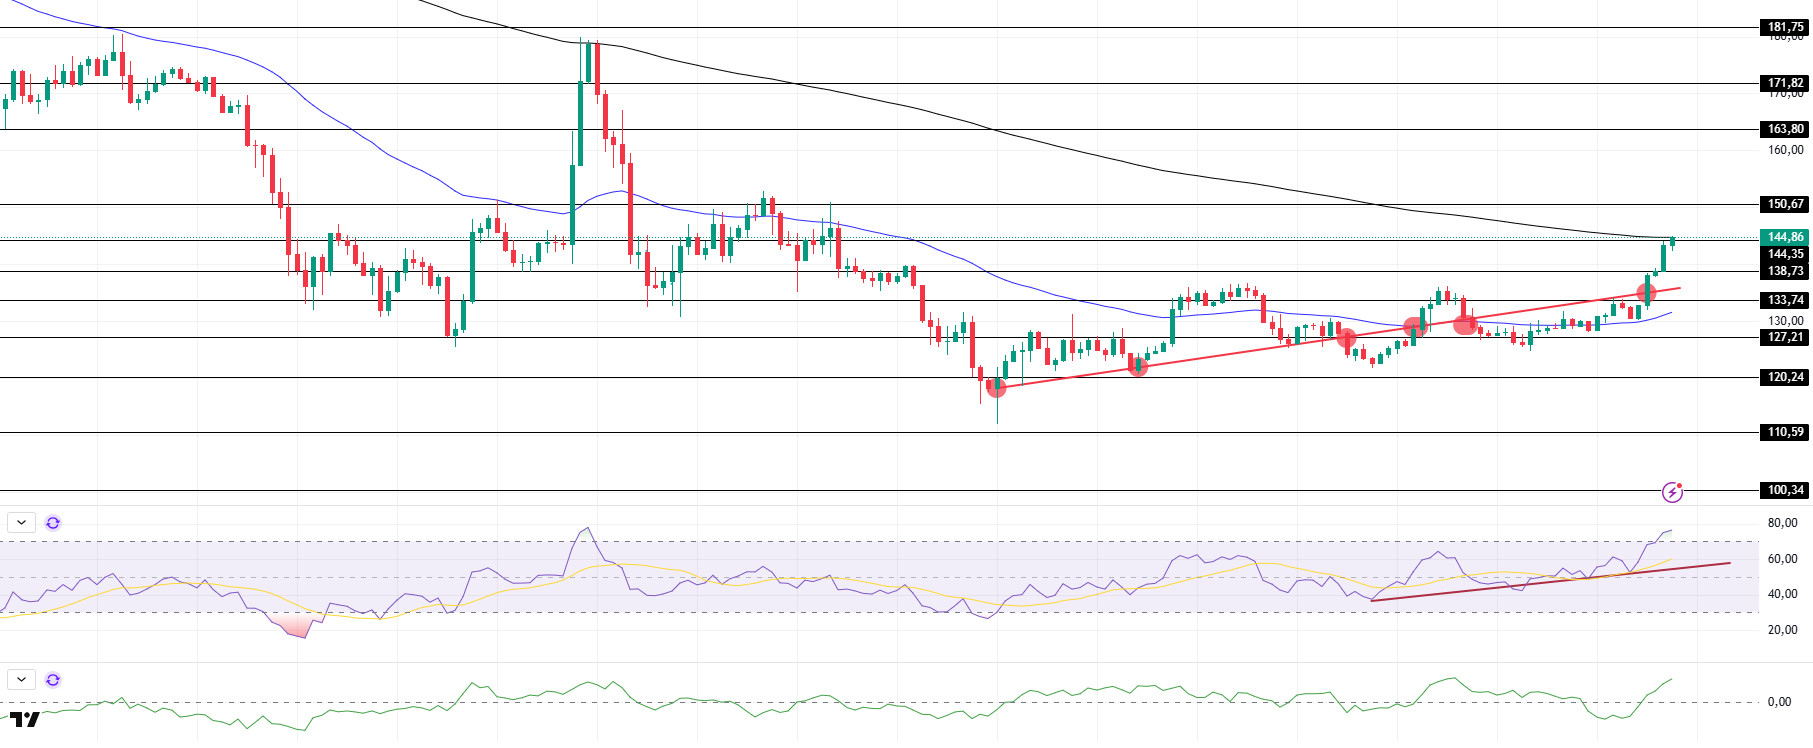
SOL has continued its ascent since our analysis in the morning. This rise took place when it tested the 50 EMA (Blue Line) as support. Thus, it started to price above the uptrend that started on March 11 again. It is currently testing the 200 EMA (Black Line). If it breaks here, it could test the strong resistance level of $163.80. On the 4-hour timeframe, the 50 EMA (Blue Line) remained below the 200 EMA (Black Line). This could deepen the decline further in the medium term. At the same time, the price is moving between the two moving averages again. The Chaikin Money Flow (CMF)20 indicator is in positive territory, but the positive daily volume may increase inflows and push CMF higher. However, the Relative Strength Index (RSI)14 indicator is in overbought territory. This could cause investors to take profits and push the price lower. At the same time, the uptrend in the RSI, which started on March 18, continues. The $150.67 level appears as a resistance point in the uptrend driven by both the upcoming macroeconomic data and the news in the Solana ecosystem. If it breaks here, the rise may continue. In case of retracements for the opposite reasons or due to profit sales, the support level of $ 133.74 can be triggered. If the price comes to these support levels, a potential bullish opportunity may arise if momentum increases.
Supports 138.73 – 133.74 – 127.21
Resistances 144.35 – 150.67 – 163.80
DOGE/USDT
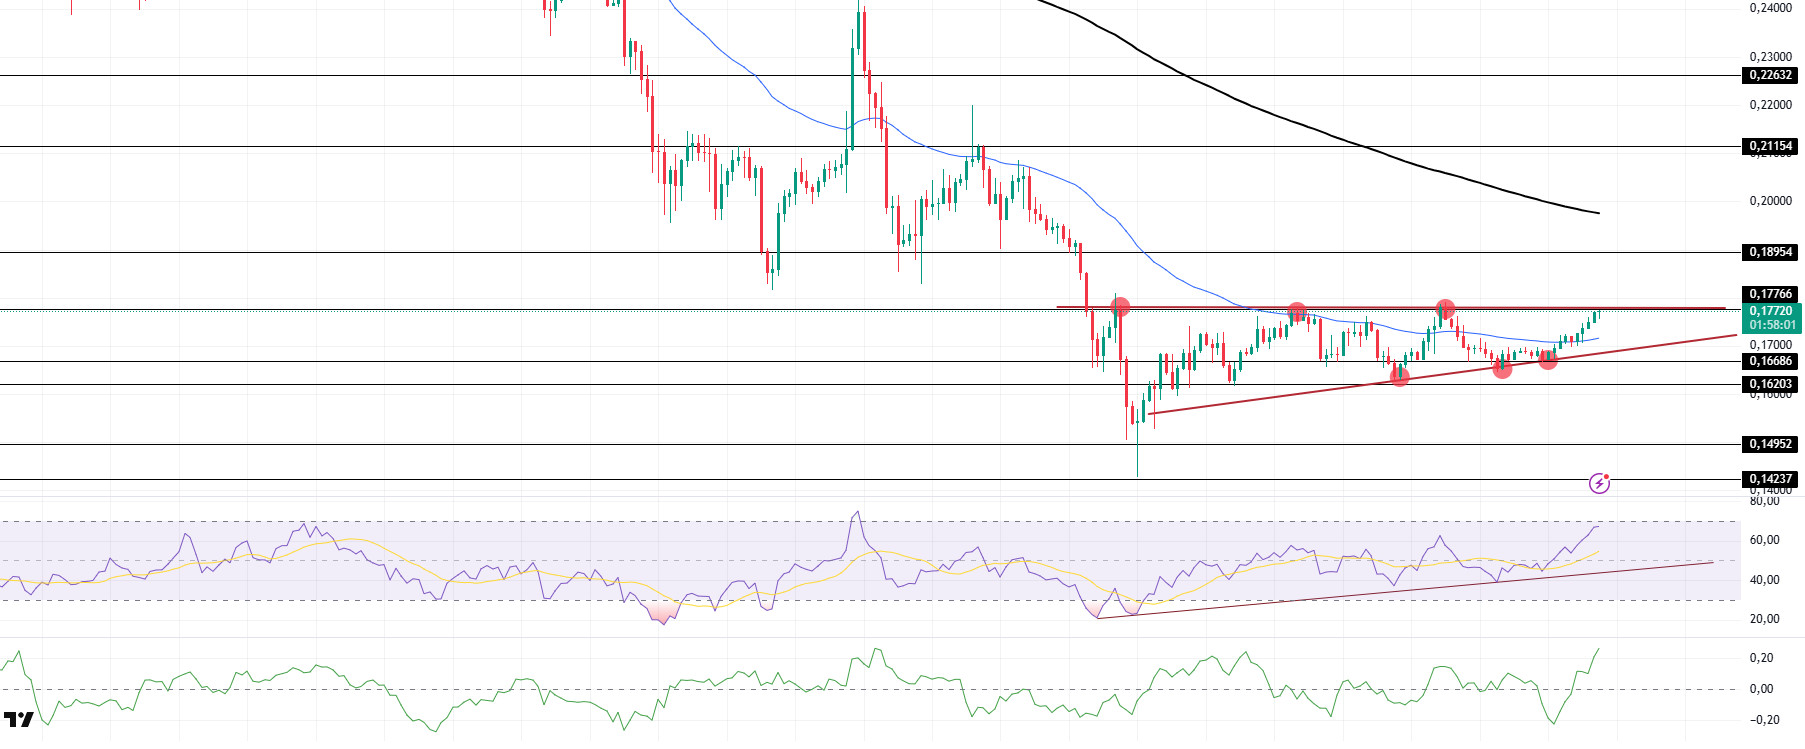
DOGE continued to price inside the ascending triangle pattern over the past weekend. The asset, which has risen slightly since our morning analysis, is currently testing the ceiling of the ascending triangle pattern as resistance. If it breaks here, it may test the $0.18954 level. On the 4-hour timeframe, the 50 EMA (Blue Line) is below the 200 EMA (Black Line). This could mean that the decline could deepen in the medium term. However, the price has started to price between two moving averages. In addition, the larger gap between the two moving averages increases the probability that DOGE will rise. When we analyze the Chaikin Money Flow (CMF)20 indicator, it is in positive territory. In addition, the fact that the 24-hour volume is on the plus side may increase money inflows, allowing CMF to reach the higher zone. On the other hand, Relative Strength Index (RSI)14 moved from negative to positive territory. However, it managed to stay above the uptrend on March 9. This may increase the uptrend further. The $0.18954 level stands out as a very strong resistance point in the rises due to political reasons, macroeconomic data and innovations in the DOGE coin. In case of possible retracements due to political, macroeconomic reasons or due to negativities in the ecosystem, the $ 0.16686 level, which is a strong support place, is an important support place. If the price comes to these support levels, a potential bullish opportunity may arise if momentum increases.
Supports 0.16686 – 0.16203 – 0.14952
Resistances 0.17766 – 0.18954 – 0.21154
LEGAL NOTICE
The investment information, comments and recommendations contained herein do not constitute investment advice. Investment advisory services are provided individually by authorized institutions taking into account the risk and return preferences of individuals. The comments and recommendations contained herein are of a general nature. These recommendations may not be suitable for your financial situation and risk and return preferences. Therefore, making an investment decision based solely on the information contained herein may not produce results in line with your expectations.
