
TECHNICAL ANALYSIS
BTC/USDT
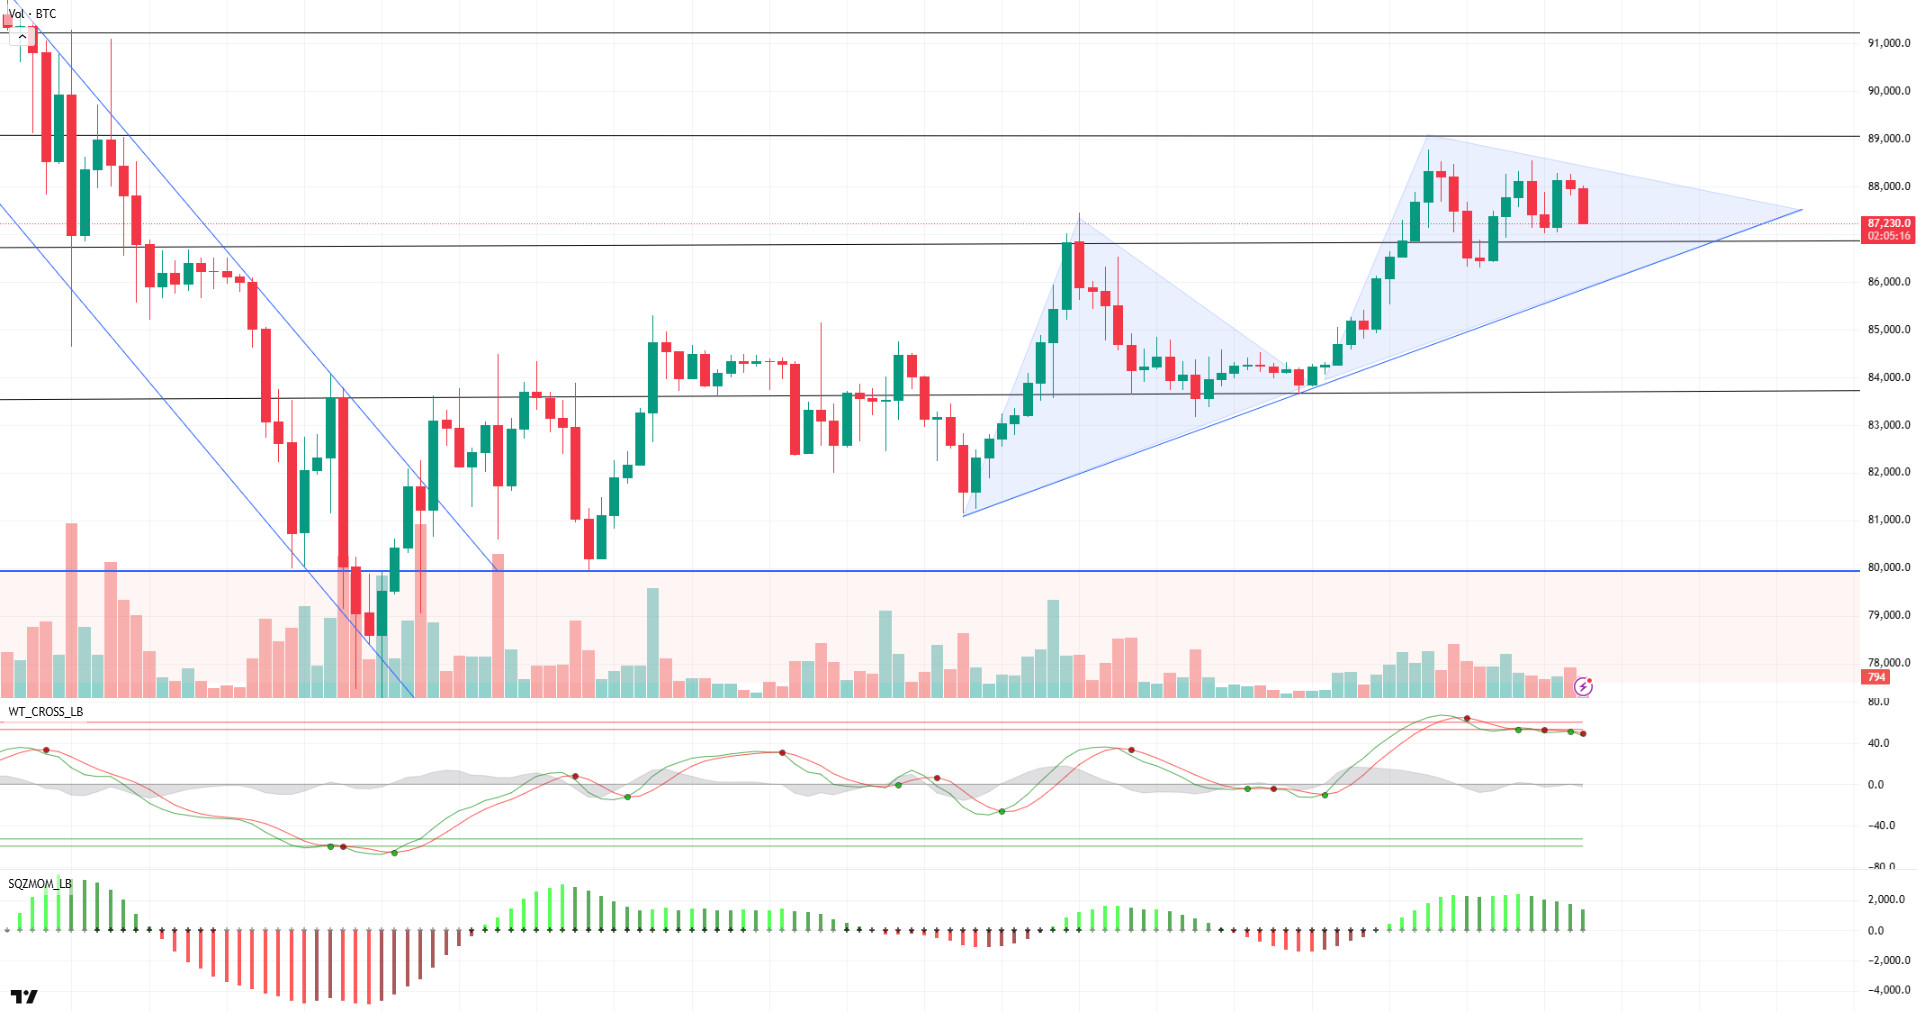
The crypto market continues to have a relatively quiet day with no major developments on the fundamental side. On-chain data shows that the profit-taking level for short-term traders is at $87,500, while the reluctance of long-term traders to sell is leading to limited upside in the market. Unlike in previous cycles, long-term Bitcoin holders continue to hold their positions and are sending strong signals that they expect higher exit prices.
BTC’s technical outlook shows that it reached 89,000 levels, forming a second and higher peak within the ascending trend channel, but retreated due to a slight selling sentiment. Currently, BTC is trading at 87,600. In the weekly liquidation data, it is observed that selling positions increased and concentrated above the 89,000 level. It is also noteworthy that intense long trading positions above the 80,000 level continue to be maintained. When technical oscillators are analyzed, it is seen that the sell signal is dominant while the momentum indicator shows weakness. Although institutional investors are slowly starting to show interest again on the ETF side, the effectiveness of retail investors, which are characterized as smart money, which is the main catalyst for BTC, is still weak. In this sense, it is insufficient for the price to accumulate above 90,000 levels. Technically, the price is likely to retreat to the 86,600-support level, where the 200-day moving average crosses, after the liquidation of short trades above 89,000. In case this level is broken, the price can be expected to pin the price to lower levels. In the event that short positions decline without liquidation, it may indicate that the market will follow upward movements again.
Supports 86,600 – 83,500 – 82,400
Resistances 89,000 – 91,400 – 92,800
ETH/USDT
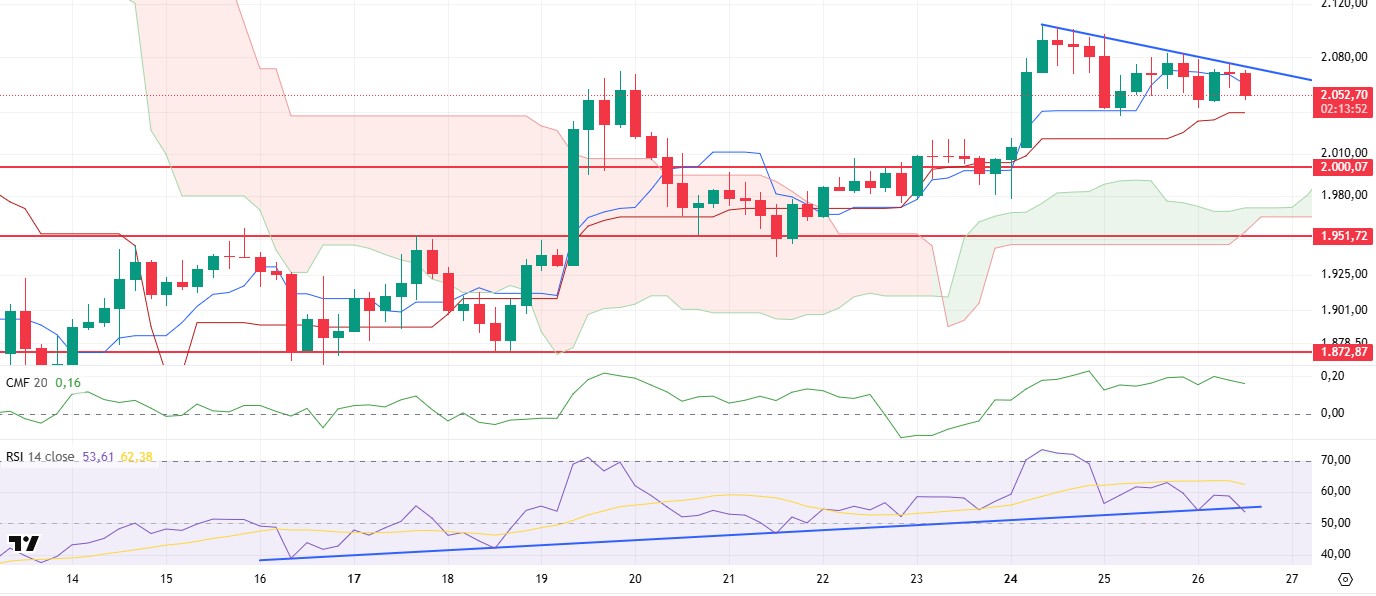
ETH rose up to the falling trend line that started at $2,104 during the day, but faced selling pressure from this area and experienced a slight pullback again. As a result of this pullback, the key to a potential rise towards the $2,131 level could be an upside break of the current falling trendline for ETH, which has dipped below the tenkan level that tracks short-term price movements. If the price fails to break this trend in the current market structure, signs of short-term weakness are likely to continue.
When technical indicators are analyzed, it is possible to make two different interpretations on the Relative Strength Index (RSI). First of all, the RSI breaking its trend line downwards can be considered as a negative signal. This can be read as a sign that the market is losing momentum and selling pressure may increase. However, on the other hand, when the structure of the RSI with price movements is taken into account, it is observed that the pricing is in a positive divergence. This indicates that the market is in an unstable zone and there is uncertainty about the direction of the market based on the RSI. The Chaikin Money Flow (CMF) indicator, which measures the liquidity flow of the market, fluctuates with price movements, but generally follows a horizontal course in the positive zone, indicating that buyers are still active in the market and the positive outlook is maintained. However, CMF’s ability to maintain its movement in the positive zone will be critical in terms of strengthening the bullish potential. When the Ichimoku indicator is analyzed, it is noteworthy that the price violates the tenkan level and the kijun level moves upwards. The rise in the kijun level stands out as an important development that increases the possibility of a critical break in price movements.
If the price manages to break the downtrend shown by the blue line on the chart during the day, a rapid rise to the $2,131 level seems likely. However, if the price breaks the Kijun level to the downside amid the uncertainty created by the RSI and Ichimoku indicators, ETH could retreat to below the $2,000 level. Considering the current technical indicators and price action together, ETH is in a critical zone for short-term directional determination. It can be said that the market can set a clearer direction with an upside break of the downtrend or a downside breach of the kijun level.
Supports 2,000 – 1,951 – 1,872
Resistances 2,131 – 2,254 – 2,507
XRP/USDT
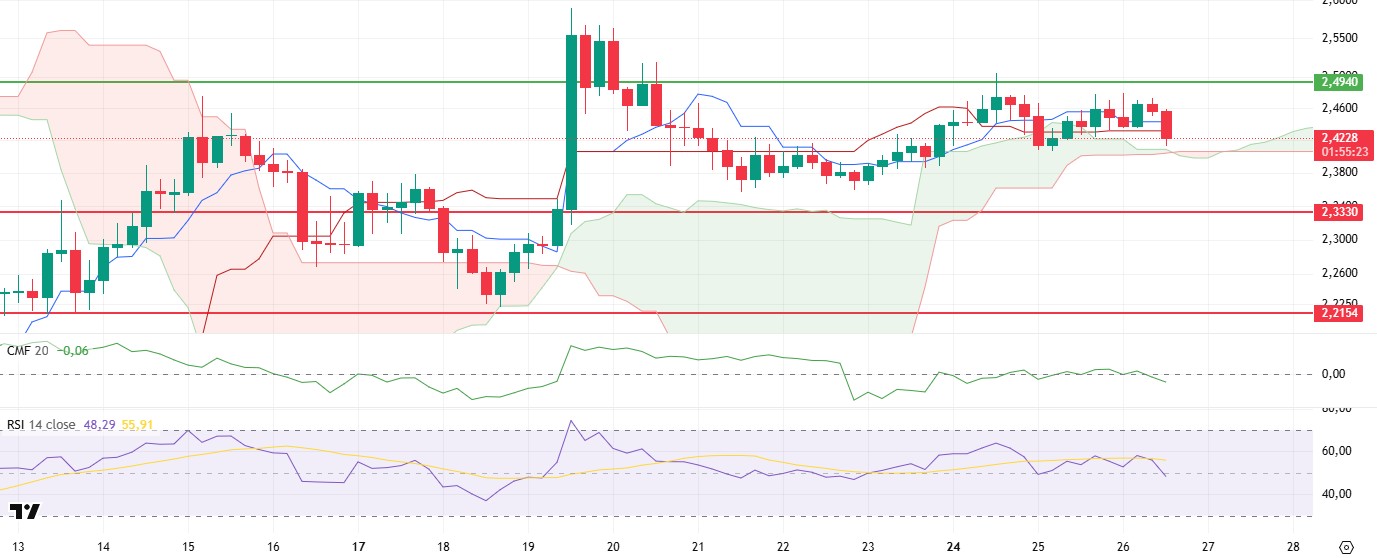
While XRP followed a horizontal course during the day, it fell as low as $2.42 with the negative opening of the US markets. With this price movement, signs of weakness in technical indicators stand out, while uncertainties on the market draw attention.
First, the Chaikin Money Flow (CMF) indicator moved sharply into negative territory, indicating that liquidity outflows from the market accelerated and selling pressure increased. If CMF continues to remain in negative territory, it could signal that buyers remain weak and the price is under downward pressure. The Ichimoku indicator shows that XRP lost both Tenkan and Kijun levels during the decline. This indicates a loss of momentum in the short and medium term and a strengthening negative outlook. However, the price is still holding the edge of the Kumo cloud, suggesting that technically there is no clear sell signal yet. If the price slips below the Kumo cloud, the declines are likely to intensify. The Relative Strength Index (RSI) indicator broke its trend line and fell below 50, indicating a loss of momentum and increased selling pressure. If the RSI continues to remain below 50, it suggests that the market remains weak and downward movements may continue.
XRP is currently hovering between $2.47 and $2.40. While the continued movement between these levels increases uncertainty, it seems likely that the selling pressure will deepen if the price sags below the $ 2.40 level. On the other hand, if the $2.49 level is exceeded, upward movements can be expected to strengthen and the uptrend can be expected to begin.
Supports 2.3330 – 2.2154 – 2.0201
Resistances 2.4940 – 2.6269 – 2.8280
SOL/USDT
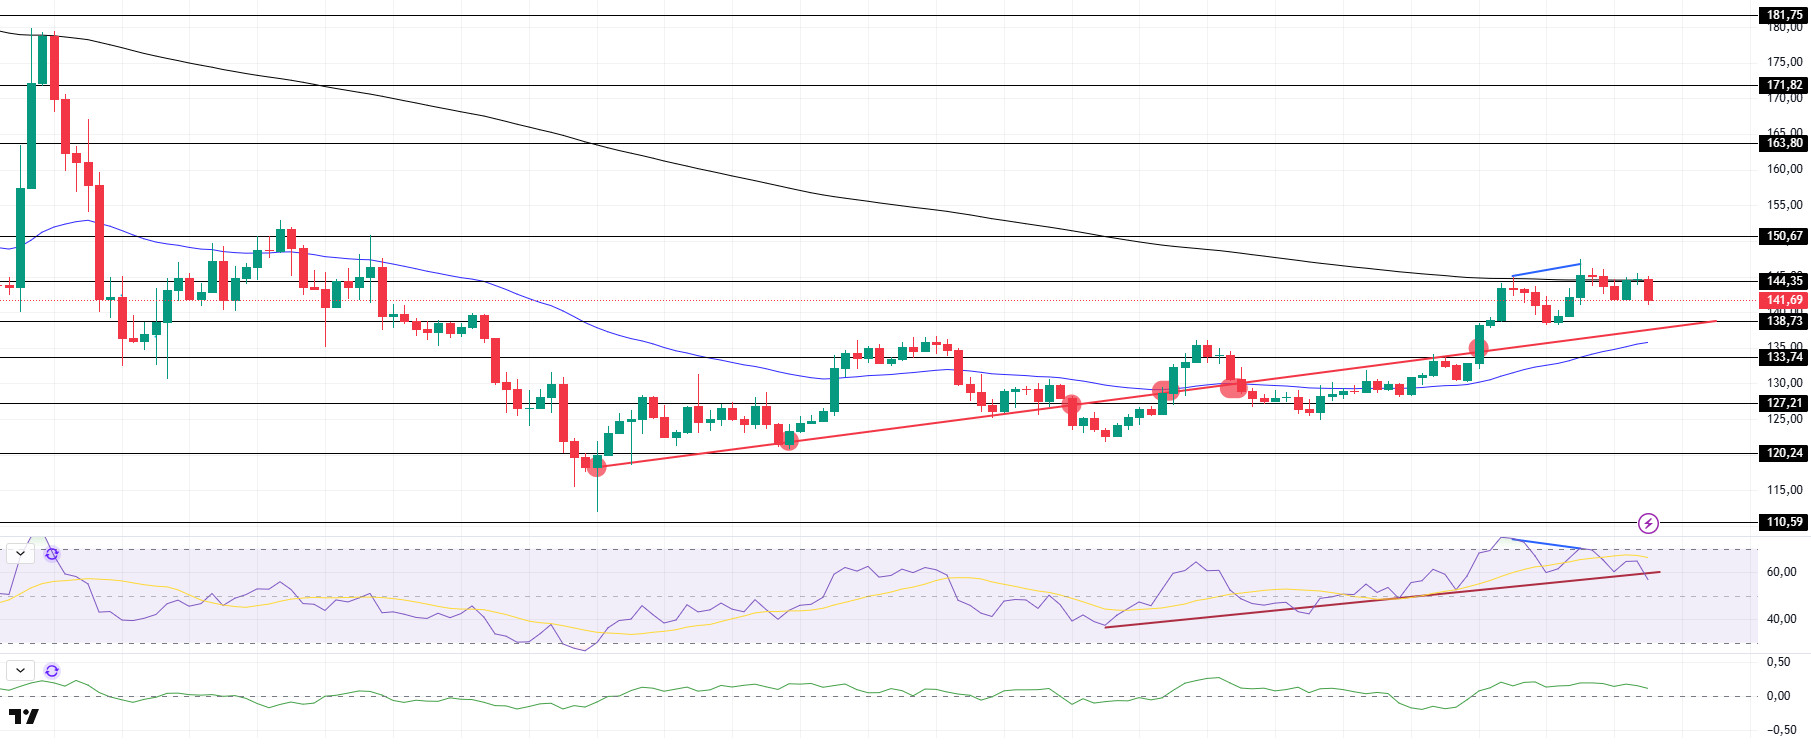
SOL has retreated since our analysis in the morning. The asset failed to break the strong resistance at $144.35 and the 200 EMA (Black Line) moving average. If it breaks here, it could test the strong resistance level of $163.80. In addition, the discrepancy in the RSI (14) Relative Strength Index indicator seems to have worked. On the 4-hour timeframe, the 50 EMA (Blue Line) remained below the 200 EMA (Black Line). This could deepen the decline further in the medium term. At the same time, the price is moving between two moving averages again. The Chaikin Money Flow (CMF)20 indicator is in positive territory, but negative daily volume may reduce inflows and move CMF into negative territory. However, the Relative Strength Index (RSI)14 indicator is about to retreat from the overbought zone and test the uptrend formed since March 18 as support. The $150.67 level appears as a resistance point in the rises driven by the upcoming macroeconomic data and the news in the Solana ecosystem. If it breaks here, the rise may continue. In case of retracements for the opposite reasons or due to profit sales, the support level of $ 133.74 can be triggered. If the price comes to these support levels, a potential bullish opportunity may arise if momentum increases.
Supports 138.73 – 133.74 – 127.21
Resistances 144.35 – 150.67 – 163.80
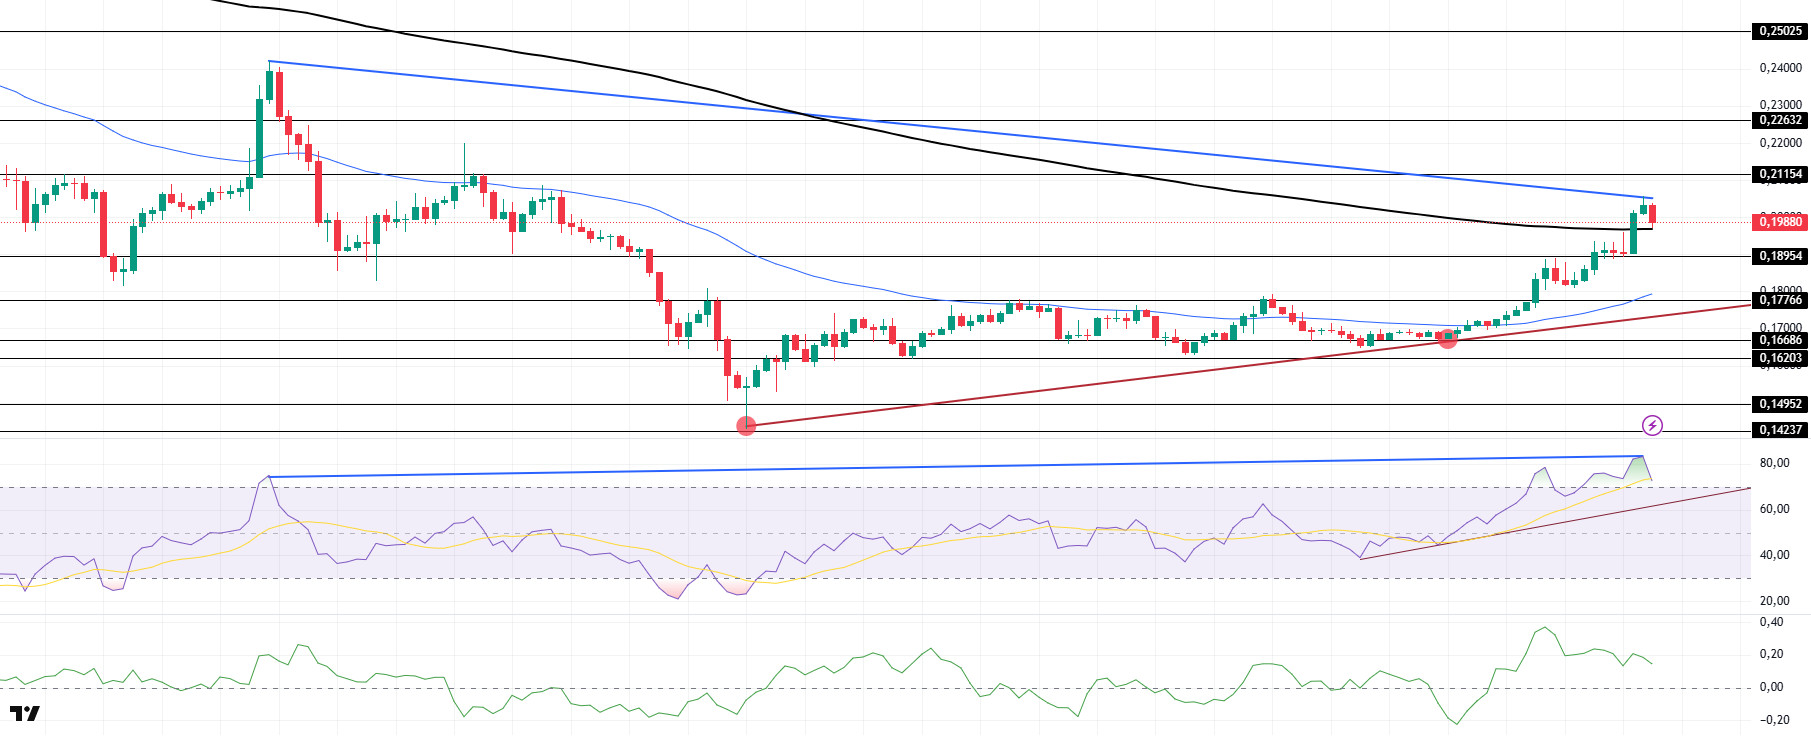
DOGE/USDT
After our analysis in the morning, DOGE managed to hold its position and stay above the 200 EMA (Black Line) and the uptrend that started on March 11. It is currently testing the 200 EMA as support. On the 4-hour timeframe, the 50 EMA (Blue Line) is below the 200 EMA (Black Line). This could mean that the decline could deepen in the medium term. However, the price has started to price above the two moving averages. The Chaikin Money Flow (CMF)20 indicator is in positive territory. In addition, the fact that the 24-hour volume is on the rise may increase the inflows and cause CMF to increase further. On the other hand, Relative Strength Index (RSI)14 is positioned at the overbought level. On the other hand, bearish divergence should be taken into account. This may cause pullbacks. The level of 0.21154 dollars appears as a very strong resistance place in the rises due to political reasons, macroeconomic data and innovations in the DOGE coin. In case of possible retracements due to political, macroeconomic reasons or due to negativities in the ecosystem, the $ 0.17766 level, which is a strong support place, is an important support place. If the price comes to these support levels, a potential bullish opportunity may arise if momentum increases.
Supports 0.18954 – 0.17766 – 0.16686
Resistances 0.21154 – 0.22632 – 0.25025
Legal Notice
The investment information, comments and recommendations contained herein do not constitute investment advice. Investment advisory services are provided individually by authorized institutions taking into account the risk and return preferences of individuals. The comments and recommendations contained herein are of a general nature. These recommendations may not be suitable for your financial situation and risk and return preferences. Therefore, making an investment decision based solely on the information contained herein may not produce results in line with your expectations.
