
TECHNICAL ANALYSIS
BTC/USDT
Among the important macroeconomic developments followed today, US Gross Domestic Product (GDP) and jobless claims data were announced. US GDP data came in above market expectations, pointing to the resilience in the economy. On the other hand, applications for unemployment benefits came in close to market expectations.
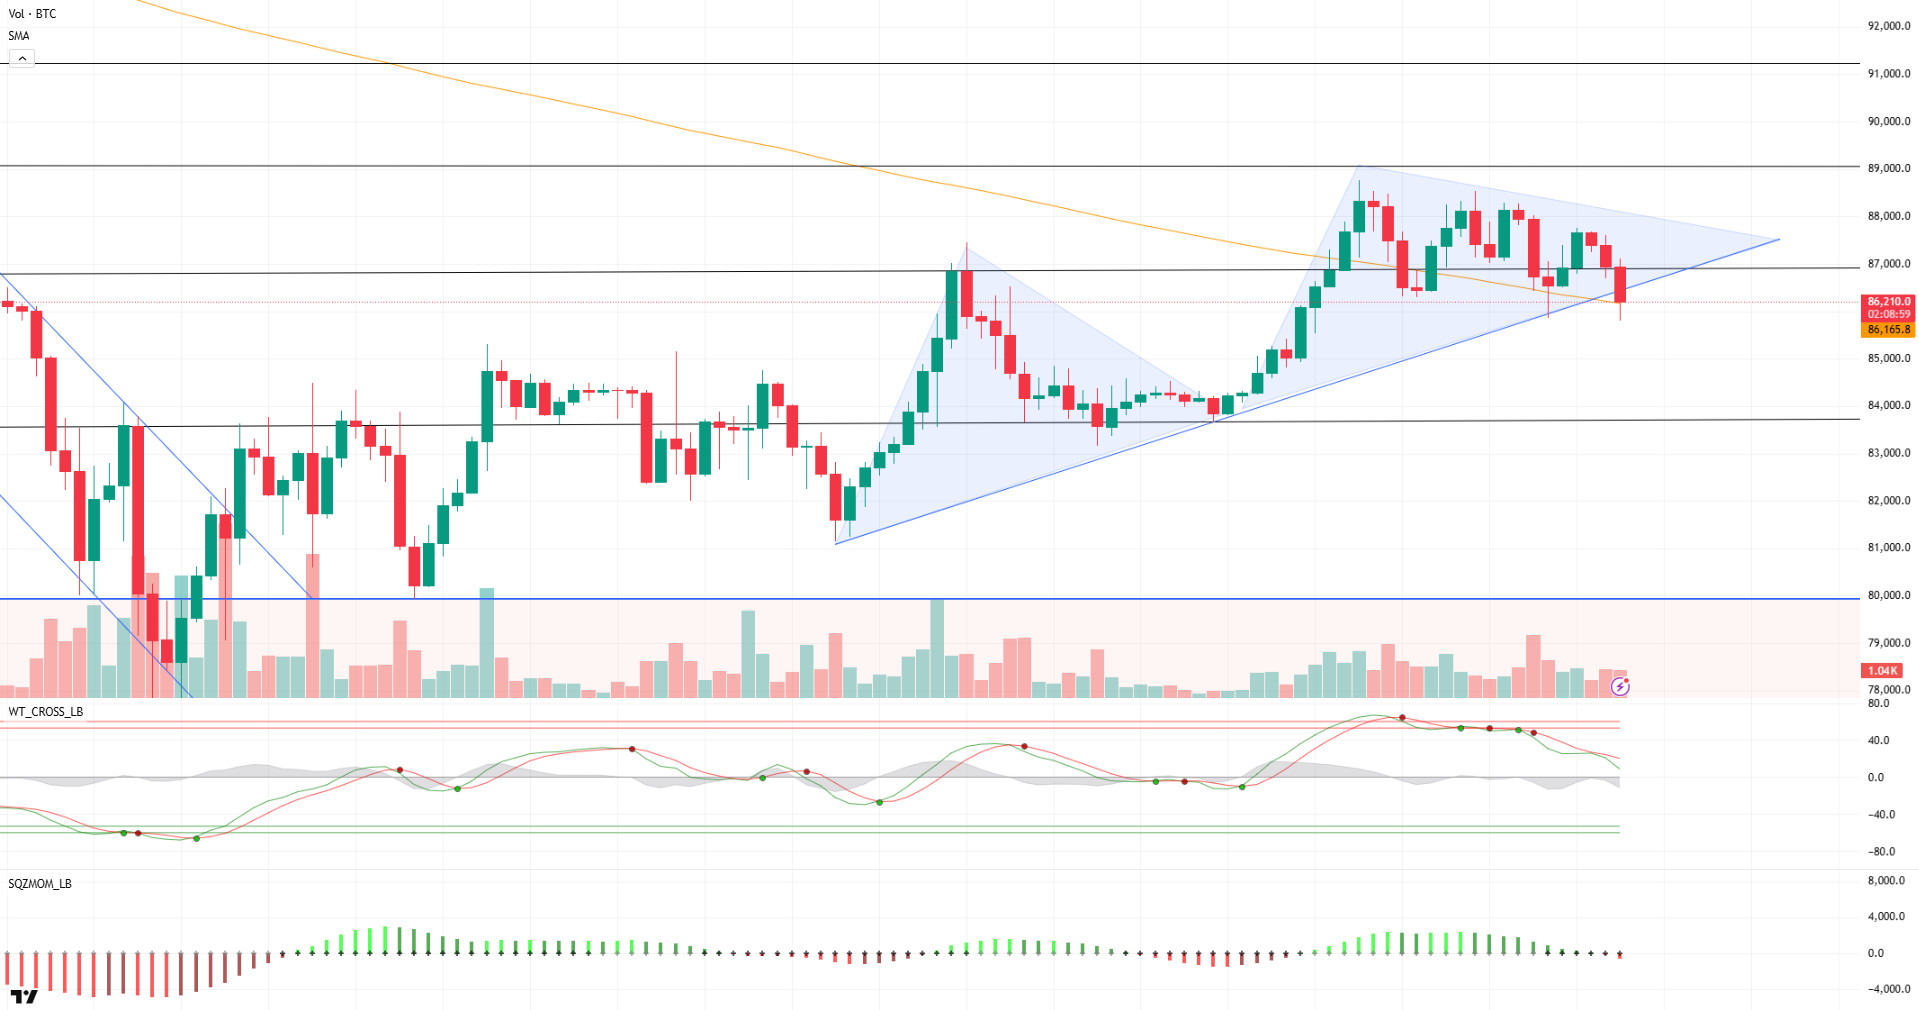
When we look at the technical outlook of BTC, it is seen that the price, which hovered above the 87,000 level during the day within the rising trend channel, turned down with the selling pressure as the US markets opened. Currently, BTC is trading at 86,000, below the 86,600 support level and the SMA 200 line. It is noteworthy that the Wave Trend Oscillator is showing a sell signal while the Squeeze Momentum indicator has lost its positive outlook. Looking at the liquidation map, it is observed that BTC retreated without liquidating short trades above 88,000, while long positions at 86,000 were liquidated. Price closes below the 86,600 level could strengthen selling pressure, in which case the next target level of 83,500 support could be retested. In a possible recovery scenario, BTC’s rise above the 86,600 level will be an important level to follow in terms of gaining upward momentum.
Supports 86,600 – 83,500 – 82,400
Resistances 89,000 – 91,400 – 92,800
ETH/USDT
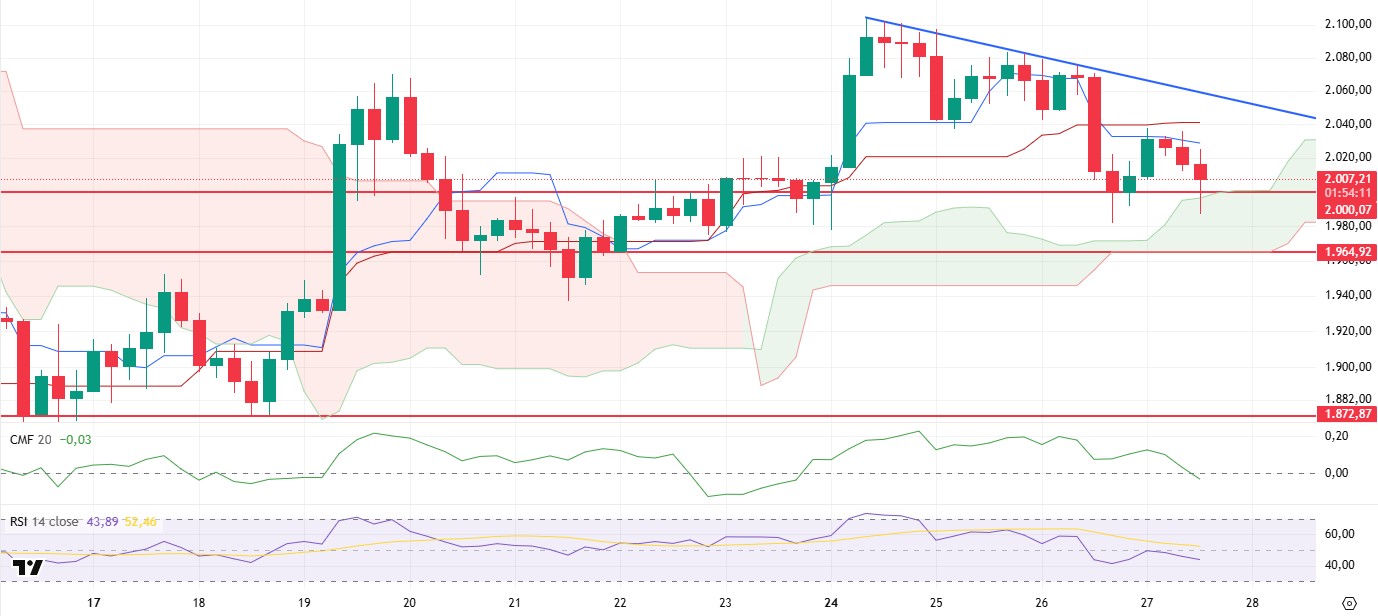
The ongoing bearish trend in the US markets continues to negatively affect the cryptocurrency market. ETH, in particular, has been showing weak price movements, dipping below the $2,000 level amid this negative outlook. Technical indicators reveal that the current downtrend has not yet ended and selling pressure continues.
The Chaikin Money Flow (CMF) indicator, which tracks liquidity flows, fell into negative territory with the recent decline, indicating a heavy capital outflow from the market. This indicates that buyers are weakening and selling is still dominant. The Ichimoku indicator shows that the price lost the tankan and kijun levels and retreated to the limits of the kumo cloud. In addition, the technical weakness signal formed by the intersection of the tankan and kijun levels continues. In terms of momentum indicators, it is also observed that the market is losing strength. The Relative Strength Index (RSI), in particular, confirms the loss of momentum in the market by continuing its downward movement after a re-test towards the 50 level after the trend breakout. Overall, the picture painted by technical indicators suggests that bearish expectations are still predominant, and the price remains under pressure.
If the ETH price breaches the $2,000 level, the downside movement is likely to deepen, and the price could fall as low as the Ichimoku cloud support at $1,964. A break of this support level could increase selling pressure and pave the way for steeper declines. However, since the current levels are within strong support ranges, possible purchases at the $2,000 – $1,964 levels could trigger a price recovery. In particular, daily closes above $2,000 could ease some of the selling pressure and allow the short-term recovery to begin.
Supports 2,000 – 1,964 – 1,872
Resistances 2,131 – 2,254 – 2,507
XRP/USDT
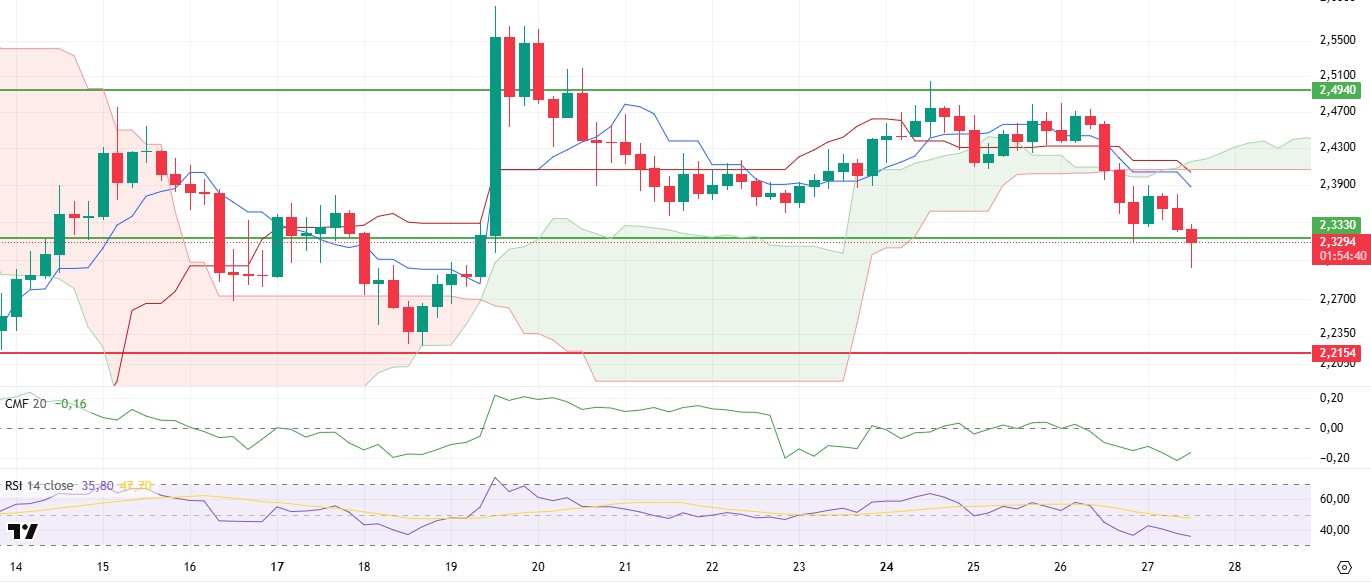
After yesterday’s sharp decline, XRP continues to maintain its downward trend by losing the Ichimoku cloud support. While this decline caused the price to sag below the critical support level of $2.33, technical indicators started to produce important signals in the market structure.
In particular, the Chaikin Money Flow (CMF) indicator, which measures liquidity flow, has fallen into negative territory with the recent decline, but has received a reaction from an important support point. This development can be considered as a possible turn signal and may pave the way for reaction buying in price movements. However, the overall weak outlook of the market continues. On the momentum side, the Relative Strength Index (RSI) continues its weak course by maintaining its structure converging to the oversold zone. This suggests that the price is struggling to gain upward momentum and selling pressure is still strong.
Analysis of the Ichimoku indicator reveals that XRP is still trading under a cloud, with tankan and kijun levels continuing to trend downwards. This suggests continued technical weakness and an overall negative market structure. However, the fact that the gap between the tankan and kijun levels has not widened significantly suggests that a possible reversal may occur faster than expected. This suggests that if the price finds buyers at critical support levels, a strong recovery may be possible.
According to the current technical outlook, XRP’s closes below $2.33 could lead to increased selling pressure and deepen the downtrend. However, according to the Ichimoku indicator, if the price finds support from this region with strong purchases, it could trigger a sharp recovery, albeit short-term. For investors, whether it can be sustained above the $2.33 level stands out as a critical factor.
Supports 2.3330 – 2.2154 – 2.0201
Resistances 2.4940 – 2.6269 – 2.8280
SOL/USDT
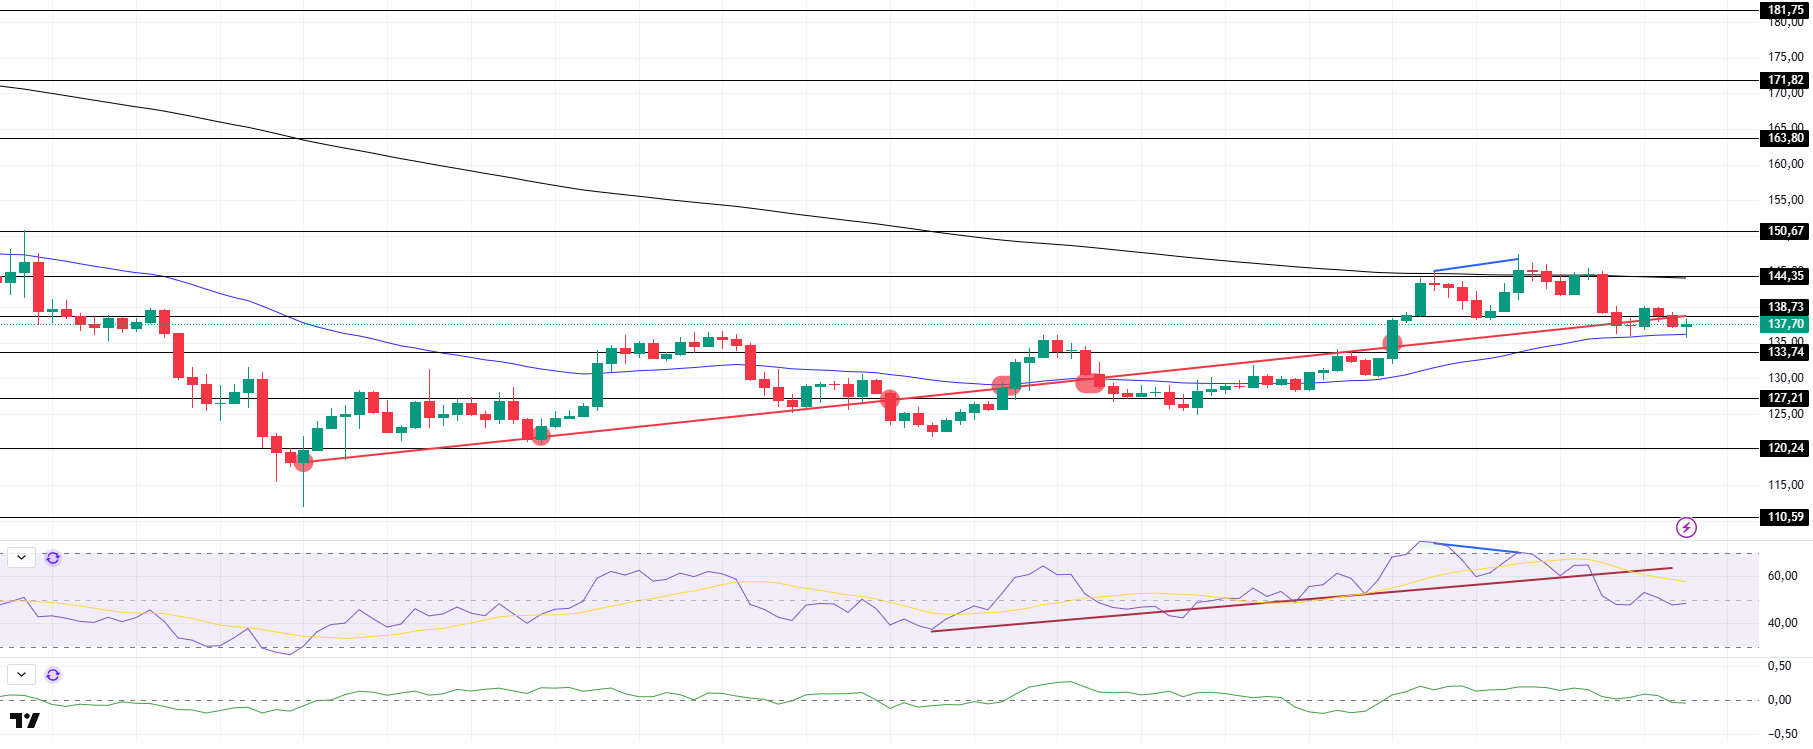
SOL has moved sideways since our morning analysis. The asset failed to break the strong resistance at $144.35 and the 200 EMA (Black Line) moving average and started pricing below the uptrend that started on March 11. It is currently testing the 50 EMA (Blue Line). On the 4-hour timeframe, the 50 EMA (Blue Line) remained below the 200 EMA (Black Line). This could deepen the decline further in the medium term. At the same time, the price is moving between two moving averages again. The Chaikin Money Flow (CMF)20 indicator is in negative territory, but positive daily volume may increase inflows and move CMF into positive territory. However, the Relative Strength Index (RSI)14 indicator retreated from the overbought zone and came to the negative zone. However, it broke the downward uptrend that has formed since March 18. The $ 144.35 level appears as a place of resistance in the rises driven by the upcoming macroeconomic data and the news in the Solana ecosystem. If it breaks here, the rise may continue. In case of retracements for the opposite reasons or due to profit sales, the support level of $ 133.74 can be triggered. If the price comes to these support levels, a potential bullish opportunity may arise if momentum increases.
Supports 133.74 – 127.21 – 120.24
Resistances 138.73 – 144.35 – 150.67
DOGE/USDT
Dogecoin (DOGE) was again revitalized by Elon Musk’s touch. A “Lion King” parody he shared in Ghibli style on social media revitalized the Dogecoin price.
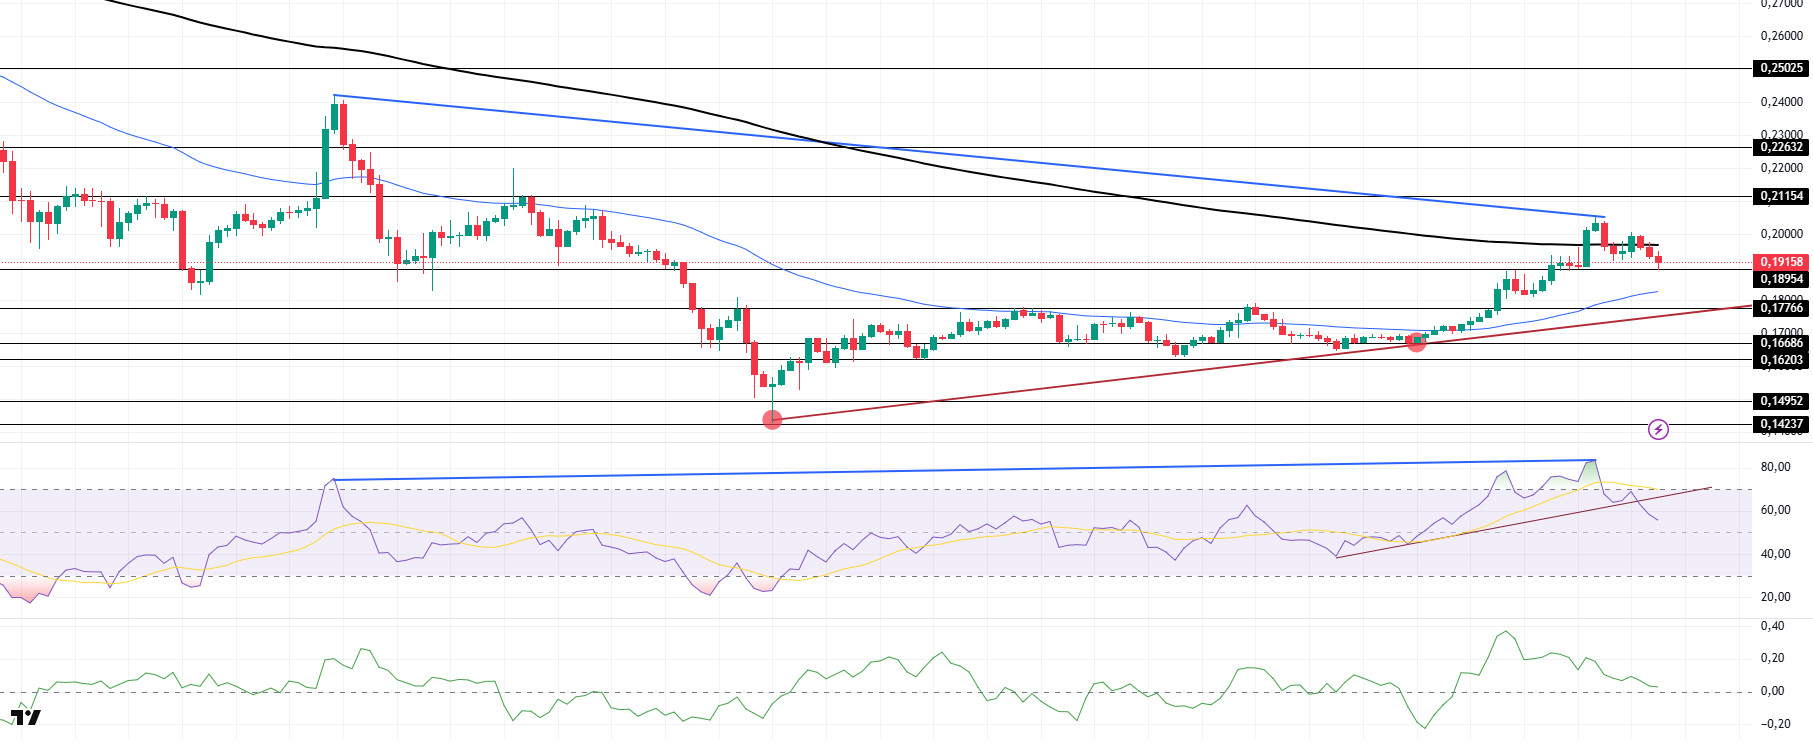
DOGE has been trading lower and priced below the 200 EMA (Black Line) after our analysis in the morning. It is currently testing the $0.18954 level, which is a strong support. On the 4-hour timeframe, the 50 EMA (Blue Line) is below the 200 EMA (Black Line). This could mean that the decline could deepen in the medium term. However, the price has started to price between two moving averages. The Chaikin Money Flow (CMF)20 indicator is in positive territory. In addition, the negative 24-hour volume may reduce inflows and keep CMF in negative territory. On the other hand, Relative Strength Index (RSI)14 retreated from the overbought level and broke the uptrend that started on March 21 downwards. This may deepen the decline further. On the other hand, bearish divergence should be taken into account. This may also cause pullbacks. The $ 0.21154 level is a very strong resistance point in the rises due to political reasons, macroeconomic data and innovations in the DOGE coin. In case of possible retracements due to political, macroeconomic reasons or due to negativities in the ecosystem, the $ 0.17766 level, which is a strong support place, is an important support place. If the price comes to these support levels, a potential bullish opportunity may arise if momentum increases.
Supports 0.18954 – 0.17766 – 0.16686
Resistances 0.21154 – 0.22632 – 0.25025
Legal Notice
The investment information, comments and recommendations contained herein do not constitute investment advice. Investment advisory services are provided individually by authorized institutions taking into account the risk and return preferences of individuals. The comments and recommendations contained herein are of a general nature. These recommendations may not be suitable for your financial situation and risk and return preferences. Therefore, making an investment decision based solely on the information contained herein may not produce results in line with your expectations.

