
Technical Analysis
BTC/USDT
Global markets are focused on today’s Fed interest rate decision and Powell’s press conference, while investors are watching for the possibility of new cuts in October and December. A strategic Bitcoin reserve plan was discussed in the US Congress, with legislation proposing the purchase of 1 million BTC over five years coming to the fore. Industry leaders such as Michael Saylor and Tom Lee also attended the meeting. While the White House called for a 50 bp cut by the Fed, Glassnode announced an increase in option demand. Metaplanet announced it had acquired the Bitcoin.jp domain name and was establishing new companies.
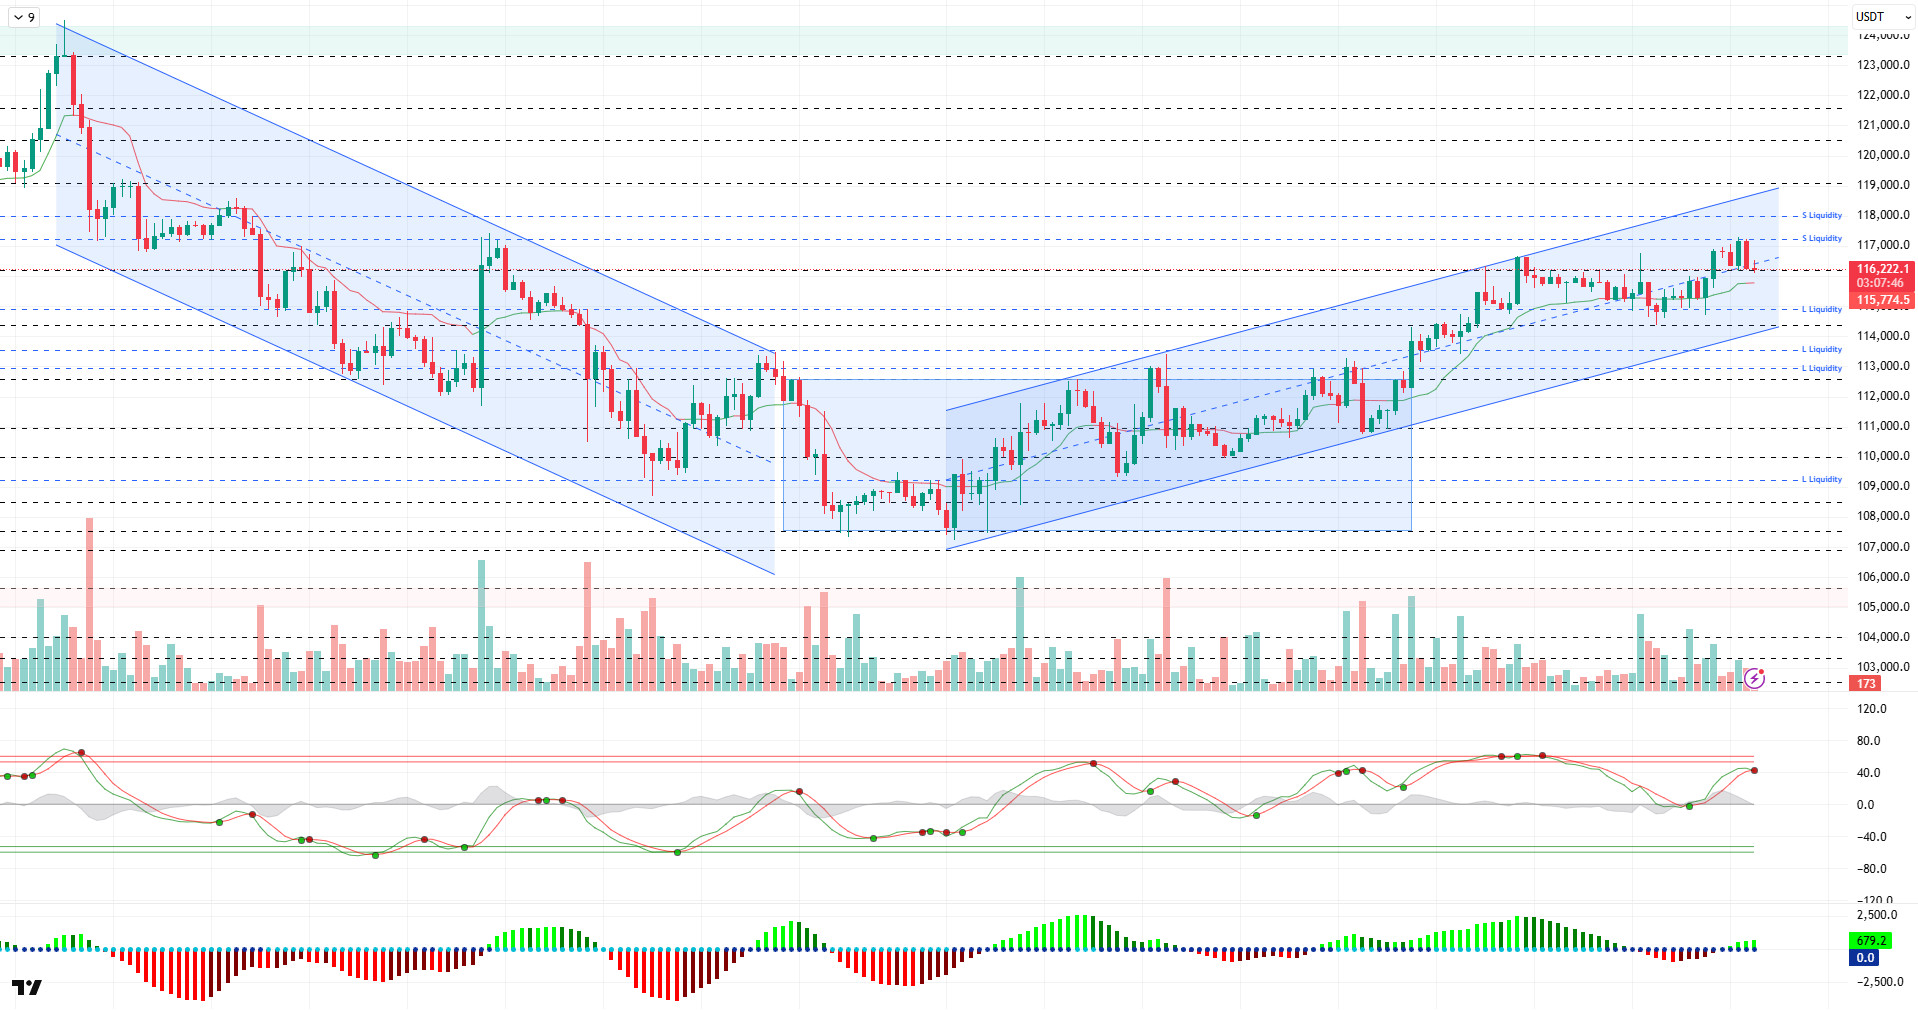
Looking at the technical picture, BTC continues to show indecisive price movements ahead of the meeting. BTC, which tested the 117,250 resistance level in the previous analysis, failed to break through this level and retreated to 116,200 amid selling pressure.
Technical indicators point to a trend reversal, with the Wave Trend oscillator (WT) giving a sell signal in the overbought zone, while the Squeeze Momentum (SM) indicator’s histogram moved into positive territory. The Kaufman moving average is currently trading below the price at 115,768.
According to liquidity data, part of the volume created by short-term heavy selling in the 117,000 – 117,800 range has been liquidated. However, the remaining part of the selling pressure is maintained at the 117,800 level. On the other hand, while short-term buying levels are intensifying at 115,000 – 115,500, the 113,600 – 112,500 band continues to be a strong liquidity zone in the long term.
In summary, the recently weakened optimistic sentiment, along with fundamental developments, regained strength ahead of today’s meeting as US macro data and interest rate cut expectations became almost certain. Powell’s statements will be critical going forward, and the Fed’s projections will be decisive for the short-term direction. From a technical perspective, with favorable conditions, the price completed its consolidation within the horizontal band it had been in for a long time and tested the 117,250 level accompanied by a minor upward channel. While sell-side transactions in liquidity data were liquidated, buying pressure continues. In the coming period, it will be critical for the price to maintain its current upward channel for the sustainability of the rise. Closes above the 117,000 level, in particular, are an important threshold to monitor for the continuation of the uptrend. If momentum is gained above this level, the 120,000 region could emerge as a target. On the other hand, the 115,000 level is the first reference point in the event of potential selling pressure. If this level is lost, the 113,500 – 113,000 band will be monitored as a strong support and liquidity area.
Supports: 115,000 – 114,000 – 113,000
Resistances: 116,100 – 117,250 – 118,000
ETH/USDT
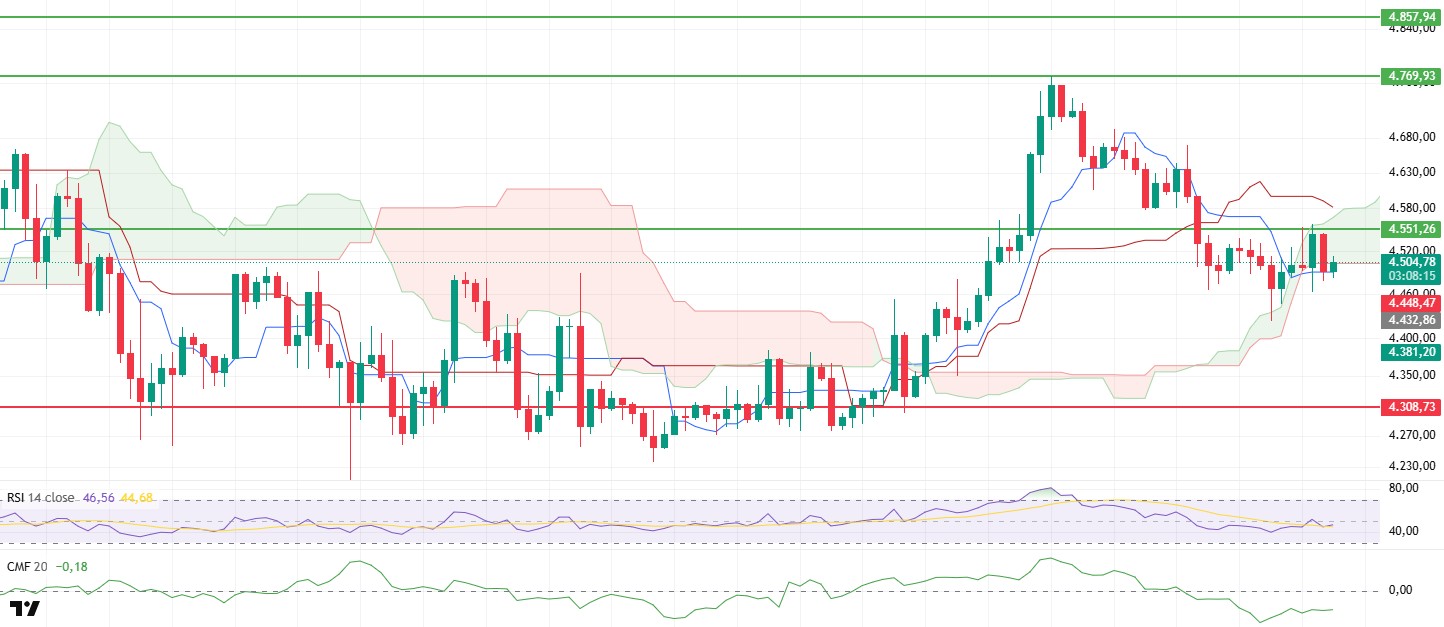
While Ethereum’s price showed limited range movements yesterday, it tested the critical $4,551 resistance level this morning. However, selling pressure from this area pushed the price back down to the $4,500 level. This movement indicates that the market continues to search for direction and that investors are maintaining a cautious stance, especially ahead of the Fed interest rate decision to be announced this evening.
The price falling back below the Ichimoku cloud is a risk signal for the short-term outlook. However, the fact that there has not yet been a close below the cloud indicates that the trend reversal is not yet confirmed. At this stage, maintaining the Tenkan level is considered critical. Otherwise, the price remaining below the cloud could lead to increased selling pressure.
On the liquidity side, the Chaikin Money Flow (CMF) indicator hovering horizontally in negative territory clearly shows that new buyers are limited and investors are avoiding risk. Similarly, the RSI indicator continuing to move in weak territory indicates that the recovery in momentum is still quite limited.
Critical levels are now clearly defined for the price direction in the coming period. In an upward scenario, staying above the $4,551 resistance level could pave the way for Ethereum to move towards the $4,769 resistance level. Conversely, in a downward scenario, losing the $4,500 support level could bring pullbacks towards the $4,470 and $4,440 levels into focus. From a broader perspective, the $4,308 level remains the most critical support position.
As a result, the market’s eyes are on the Fed’s interest rate decision and Powell’s speech, which will be announced in the evening. As these developments could lead to high volatility, sharp fluctuations in prices are likely in the short term. In particular, whether the price can remain above the $4,551 s level will be decisive in determining the direction.
Support levels: 4.308 – 4.196 – 4.084
Resistance levels: 4,551 – 5,857 – 5,000
XRP/USDT
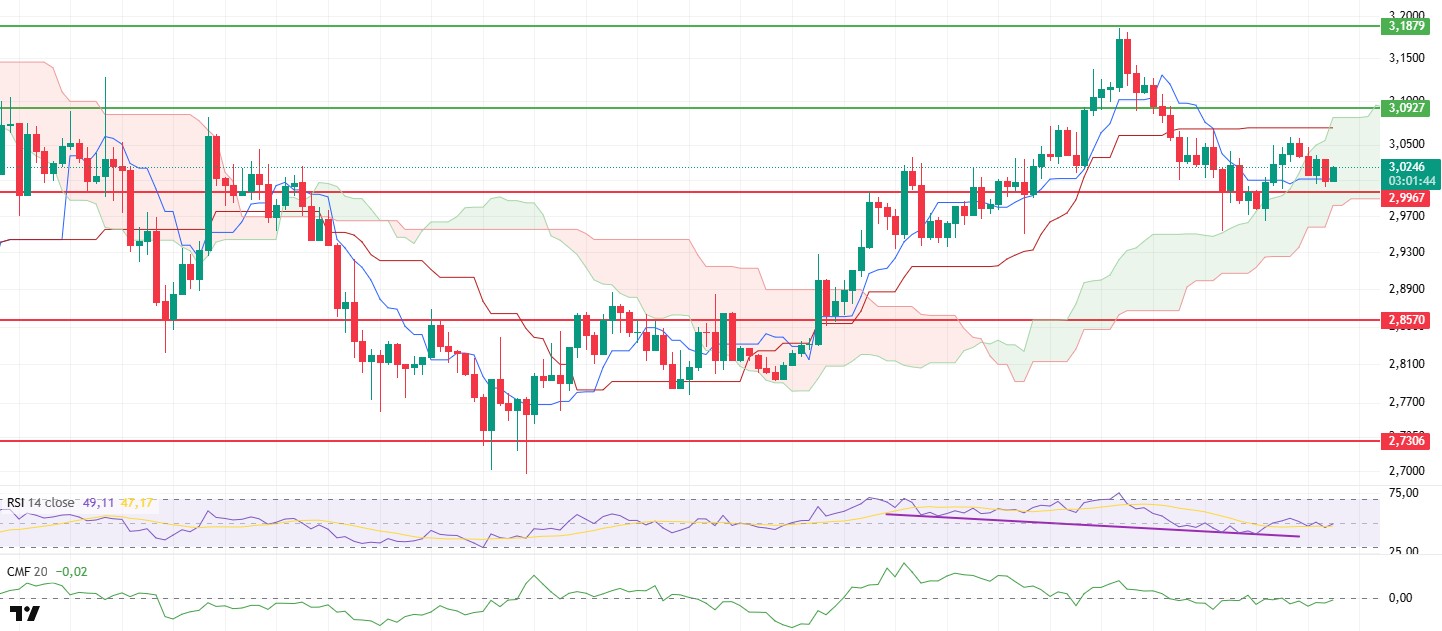
Following yesterday’s upward attempts, the XRP price is showing a calmer and more balanced outlook today. The price continuing its horizontal movement within the cloud during the day indicates that the market is still searching for direction and that uncertainty prevails. Currently trading at $3.025, XRP is trying to find balance just above critical thresholds.
Looking at liquidity, the Chaikin Money Flow (CMF) indicator approaching the zero line indicates that buyers are entering the market, albeit to a limited extent. This signals that selling pressure has eased, but strong buyer interest has not yet emerged.
On the momentum side, the RSI indicator’s horizontal movement at the 50 level clearly reflects the market’s indecisive structure. Neither buyers nor sellers have been able to gain a clear advantage, causing the price to be stuck between critical levels.
The levels to watch in the short term are clear. In an upward scenario, if the $3.09 resistance is broken, the price is likely to rise towards the $3.15–$3.18 range. In a downward scenario, staying below the $2.99 support level could increase selling pressure. As a result, the market’s eyes are on the Fed’s interest rate decision and Powell’s speech, which will be announced in the evening. These developments are expected to increase volatility. Therefore, if critical support and resistance levels are broken, movements are likely to accelerate.
Support levels: 2.9967 – 2.8570 – 2.7306
Resistance levels: 3.0927 – 3.1879 – 3.3058
SOL/USDT
Forward Industries announced a $4 billion capital increase program to expand the Solana (SOL) treasury.
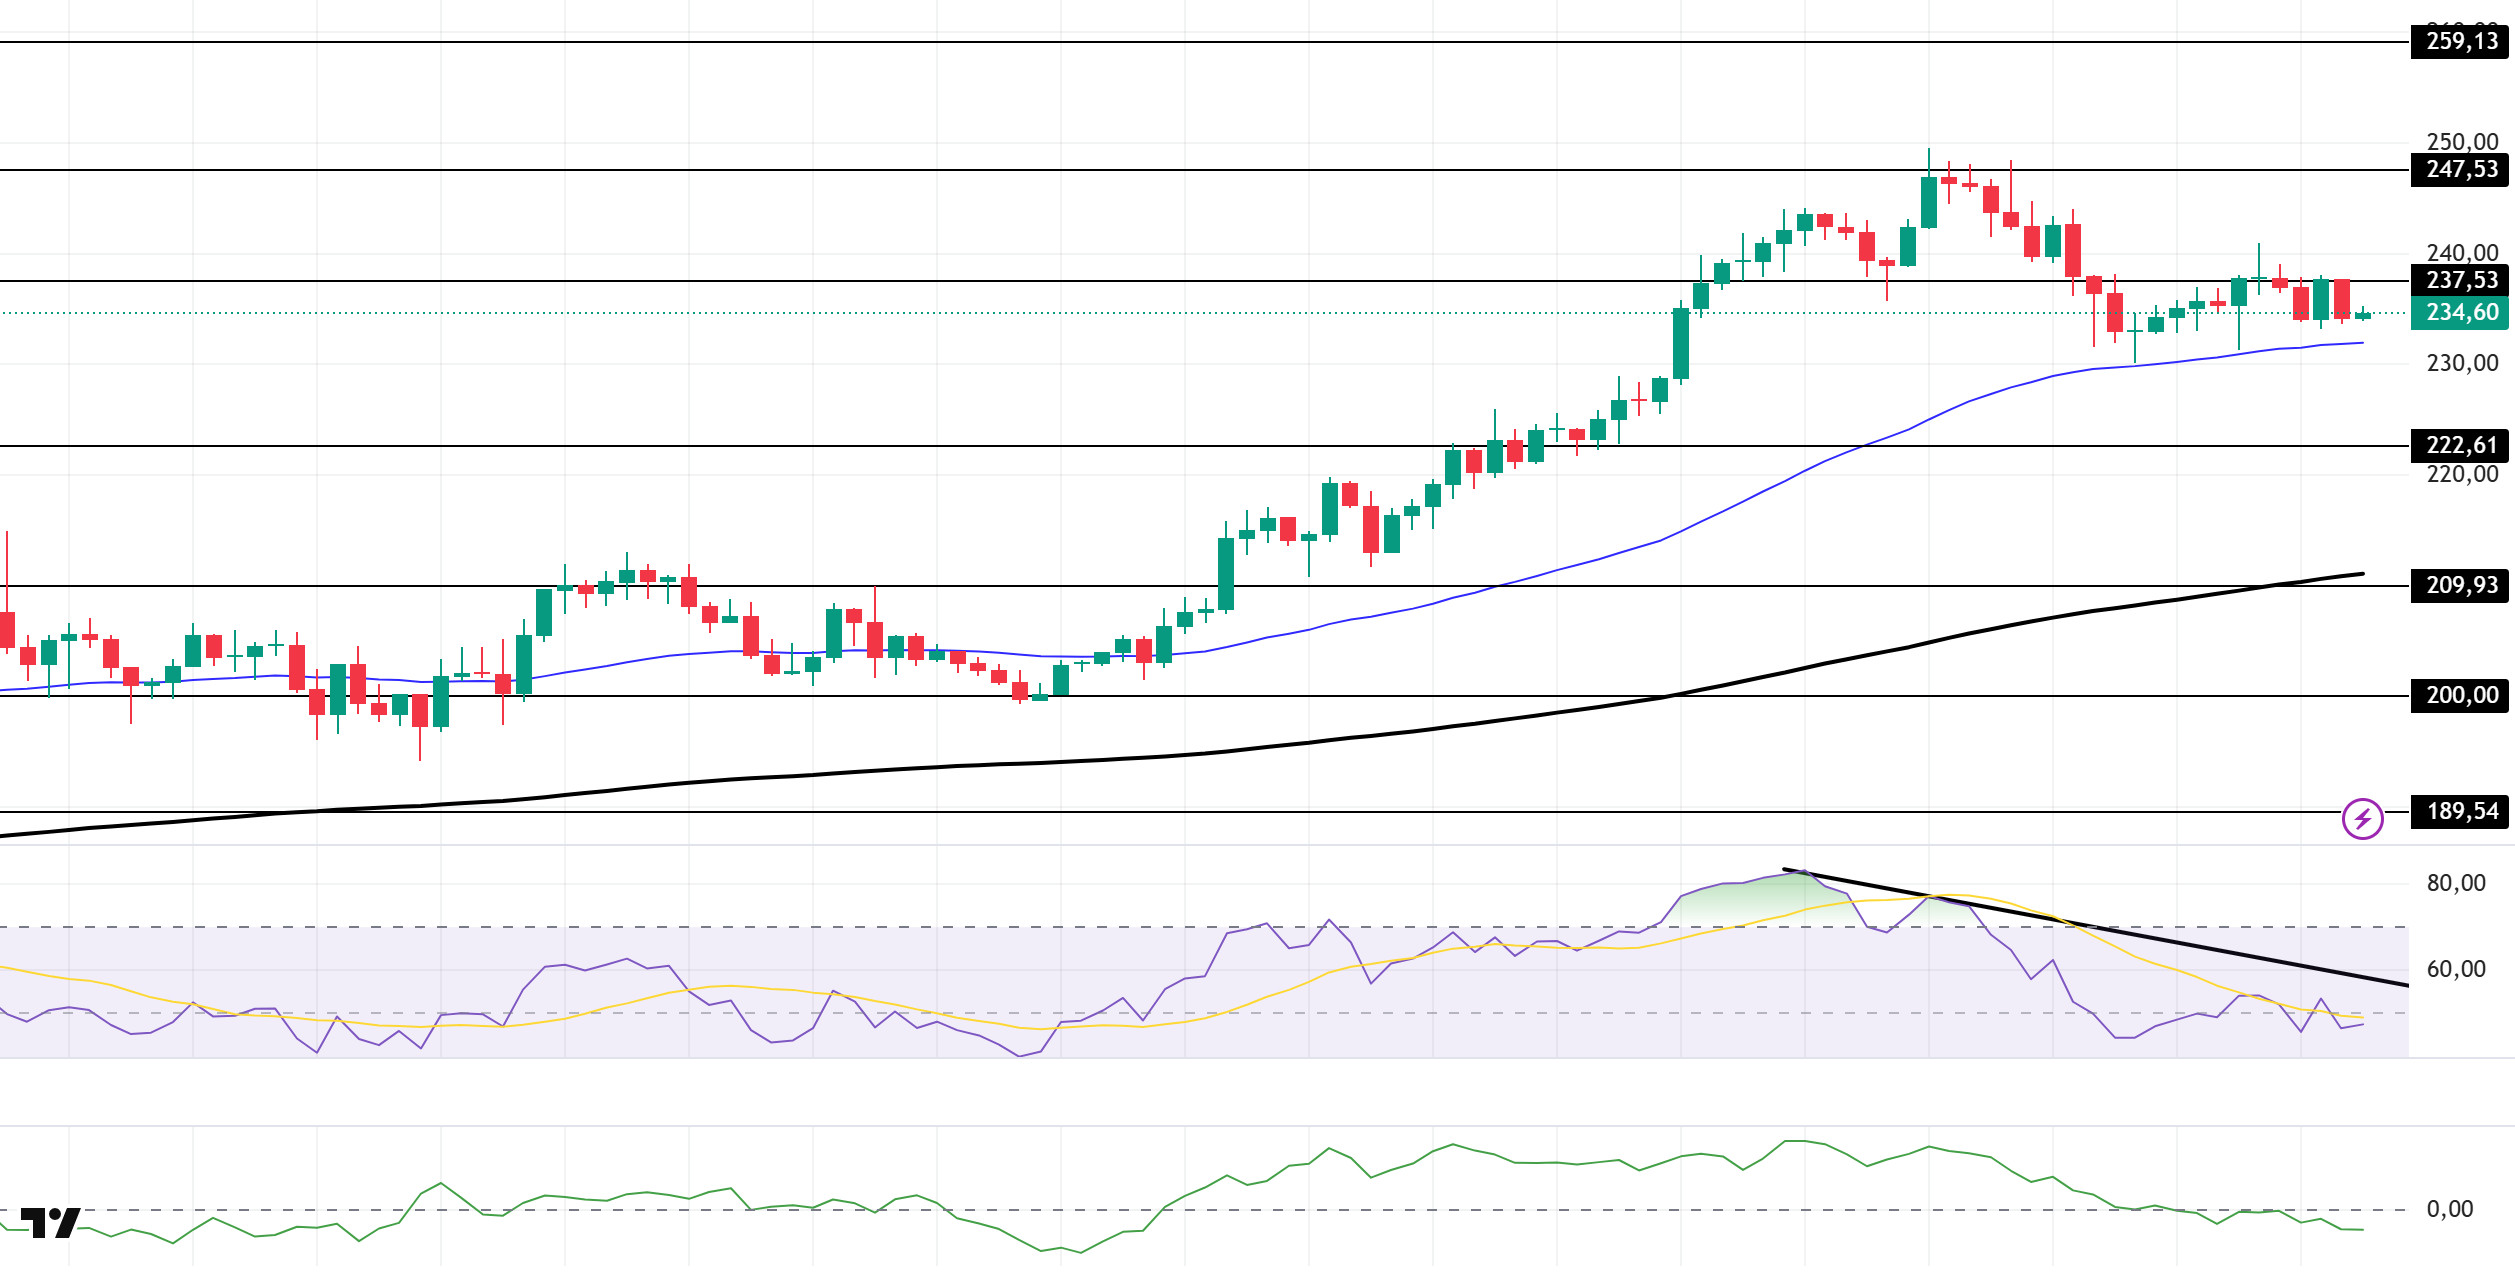
The SOL price traded sideways. The asset tested the strong resistance level of $237.53 but failed to break through, retreating and trading near the 50 EMA (Exponential Moving Average – Blue Line). It may test the $222.61 level on 50 EMA lower candle closes. On 237.53 dollar level higher candle closes, the $247.53 level should be monitored.
On the 4-hour chart, it remained above the 50 EMA (Exponential Moving Average – Blue Line) and 200 EMA (Black Line). This indicates that the medium-term upward trend may continue. At the same time, the price being above both moving averages shows us that the market is trending upward in the short term. The large difference between the two moving averages indicates that the asset may be in a sideways or downward trend. Chaikin Money Flow (CMF-20) remained in negative territory. However, an increase in cash inflows could push the CMF into positive territory. The Relative Strength Index (RSI-14) remained in negative territory from a neutral level. At the same time, its position in the lower region of the downward trend that began on September 12 indicated that selling pressure continued. In the event of an uptrend due to macroeconomic data or positive news related to the Solana ecosystem, the $247.53 level stands out as a strong resistance point. If this level is broken upwards, the uptrend is expected to continue. In case of pullbacks due to developments in the opposite direction or profit-taking, the $222.61 level could be tested. A decline to these support levels could increase buying momentum, presenting a potential upside opportunity.
Supports: 222.61 – 209.93 – 200.00
Resistances: 237.53 – 247.53 – 259.13
DOGE/USDT
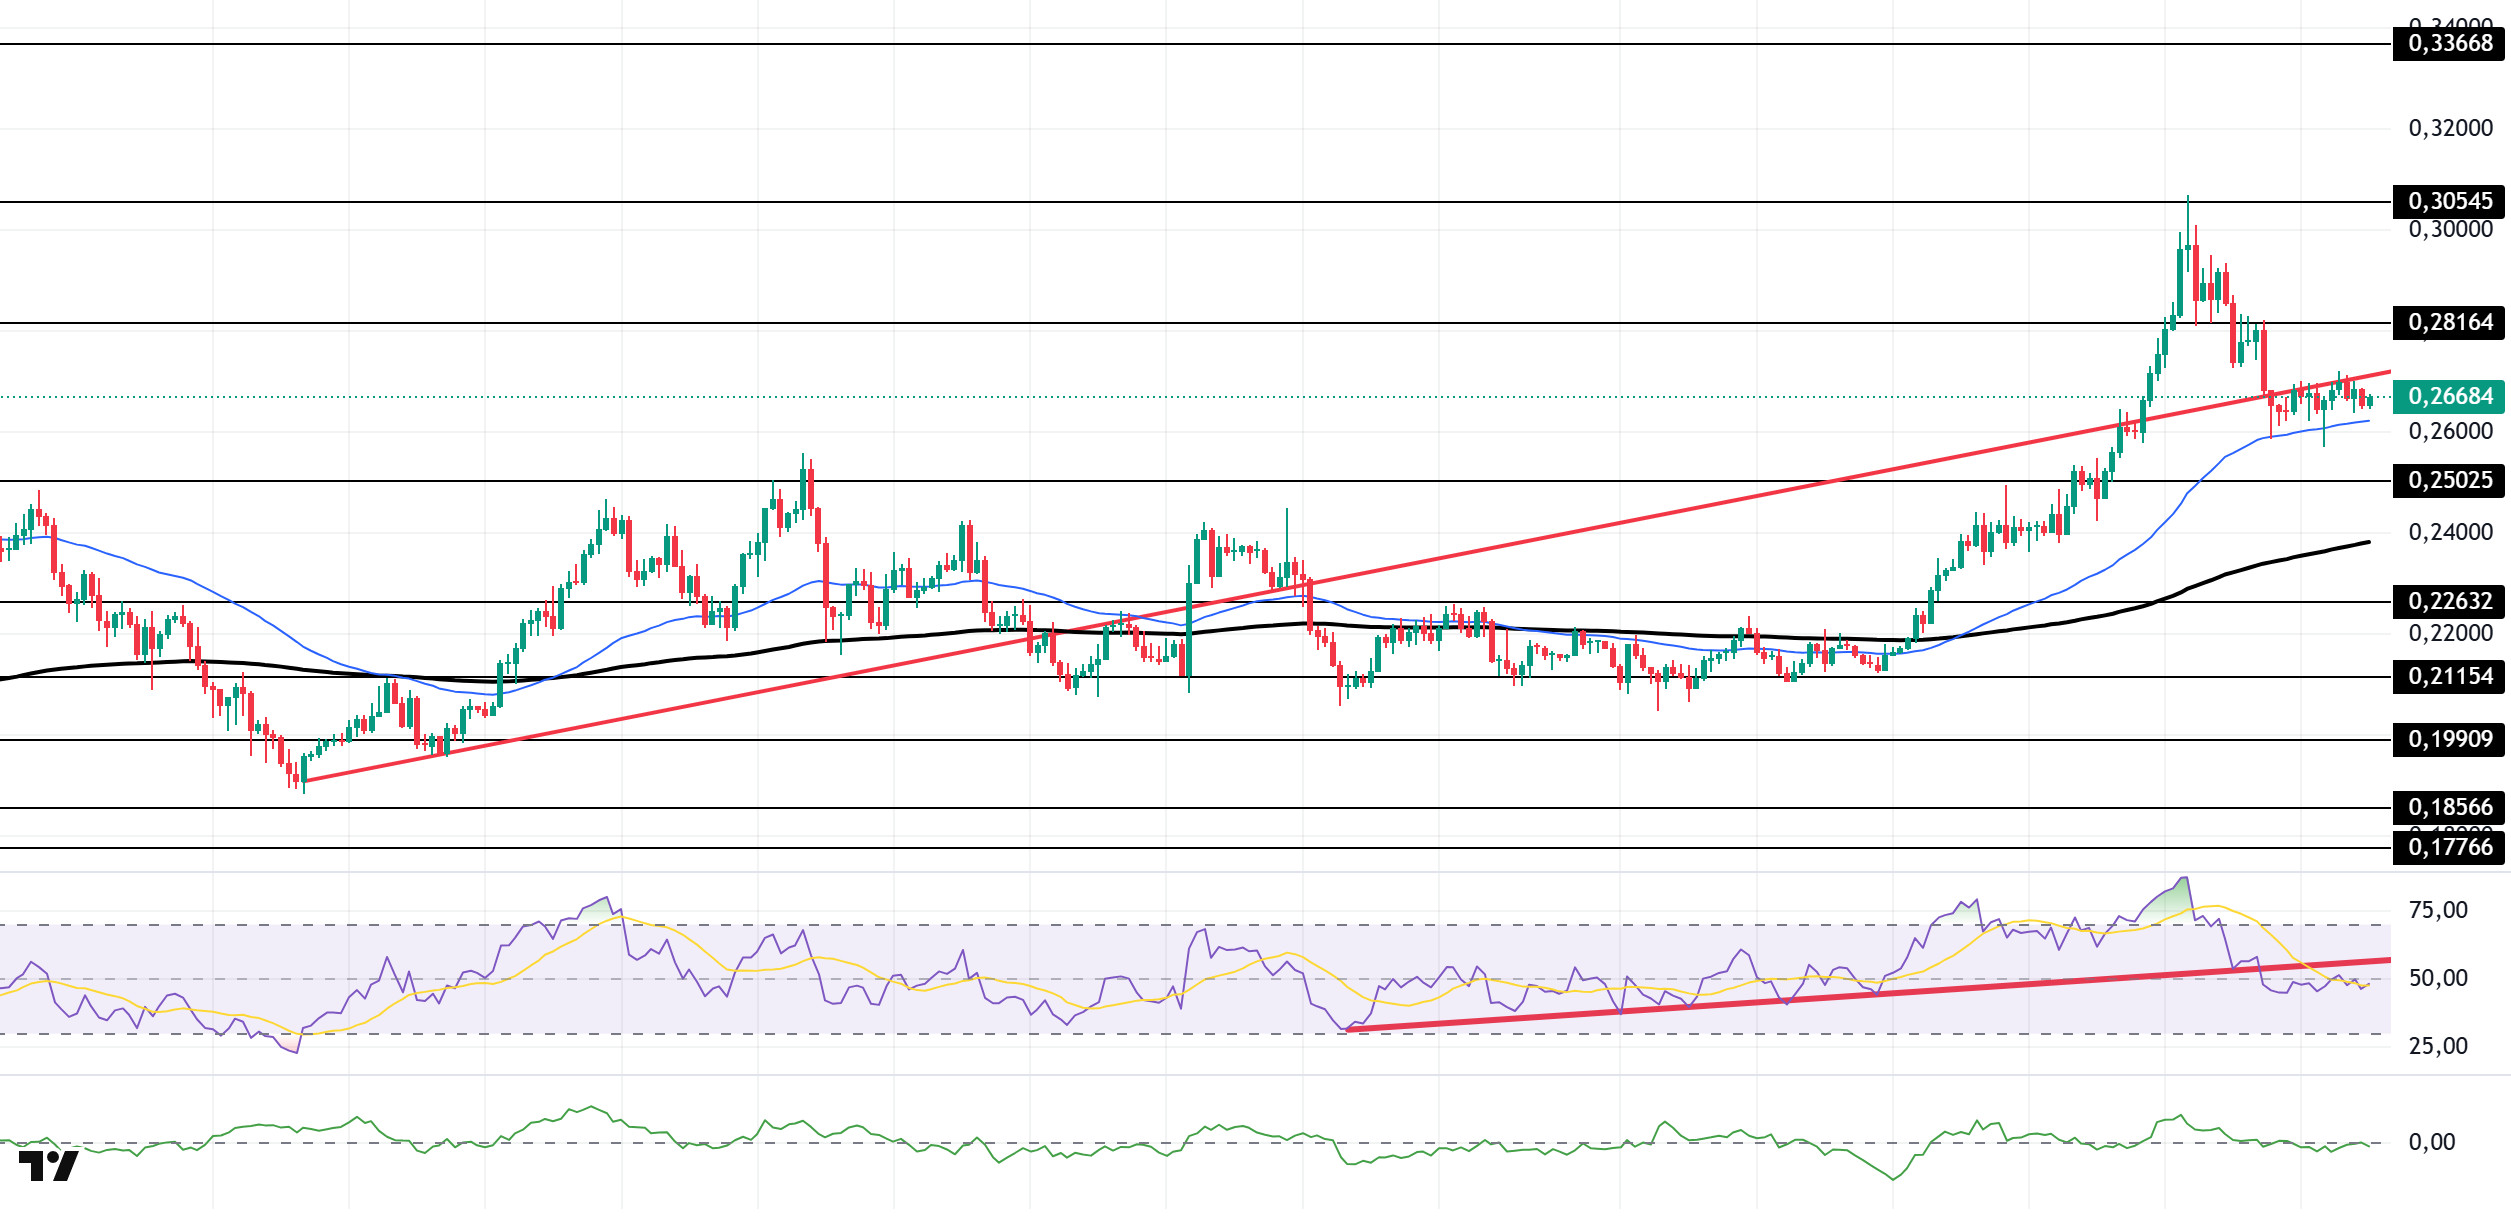
The DOGE price continued to fluctuate. The asset tested the upward trend that began on August 3 as support and broke below it, deepening its pullback. The price, which is preparing to retest the 50 EMA (Exponential Moving Average – Blue Line) as support, could test the $0.25025 level on candlestick closes below the 50 EMA. On the upside, the $0.28164 level could act as resistance.
On the 4-hour chart, the 50 EMA (Blue Line) remained above the 200 EMA (Black Line). This indicates that the medium-term upward trend continues. The price being above both moving averages shows that the short-term upward trend is strong. A large gap between the two moving averages could cause the asset to pull back or trade sideways. The Chaikin Money Flow (CMF-20) remained in negative territory. Additionally, a decrease in money inflows could push the CMF deeper into negative territory. The Relative Strength Index (RSI-14) remained in negative territory. At the same time, it remained in the lower region of the upward trend that began on August 26. This indicated that selling pressure continued. In the event of potential increases due to political developments, macroeconomic data, or positive news flow in the DOGE ecosystem, the $0.28164 level stands out as a strong resistance zone. Conversely, in the event of negative news flow, the $0.25025 level could be triggered. A decline to these levels could increase momentum and potentially initiate a new upward wave.
Supports: $0.25025 – $0.22632 – $0.21154
Resistances: 0.28164 – 0.30545 – 0.33668
AVAX/USDT
AVAX continues its sideways movement at the levels it started the day. Markets are focused on the critically important Fed interest rate decision and Powell’s subsequent speech. Ahead of these developments, AVAX is trading within a narrow range, just like the broader crypto market. Following the decision, AVAX is likely to react in line with the market in the event of sharp upward or downward price movements. If Powell’s statements are positive, momentum could increase, and AVAX could reach the $40 level. However, in the opposite scenario, negative statements could trigger heavy selling pressure in the market.
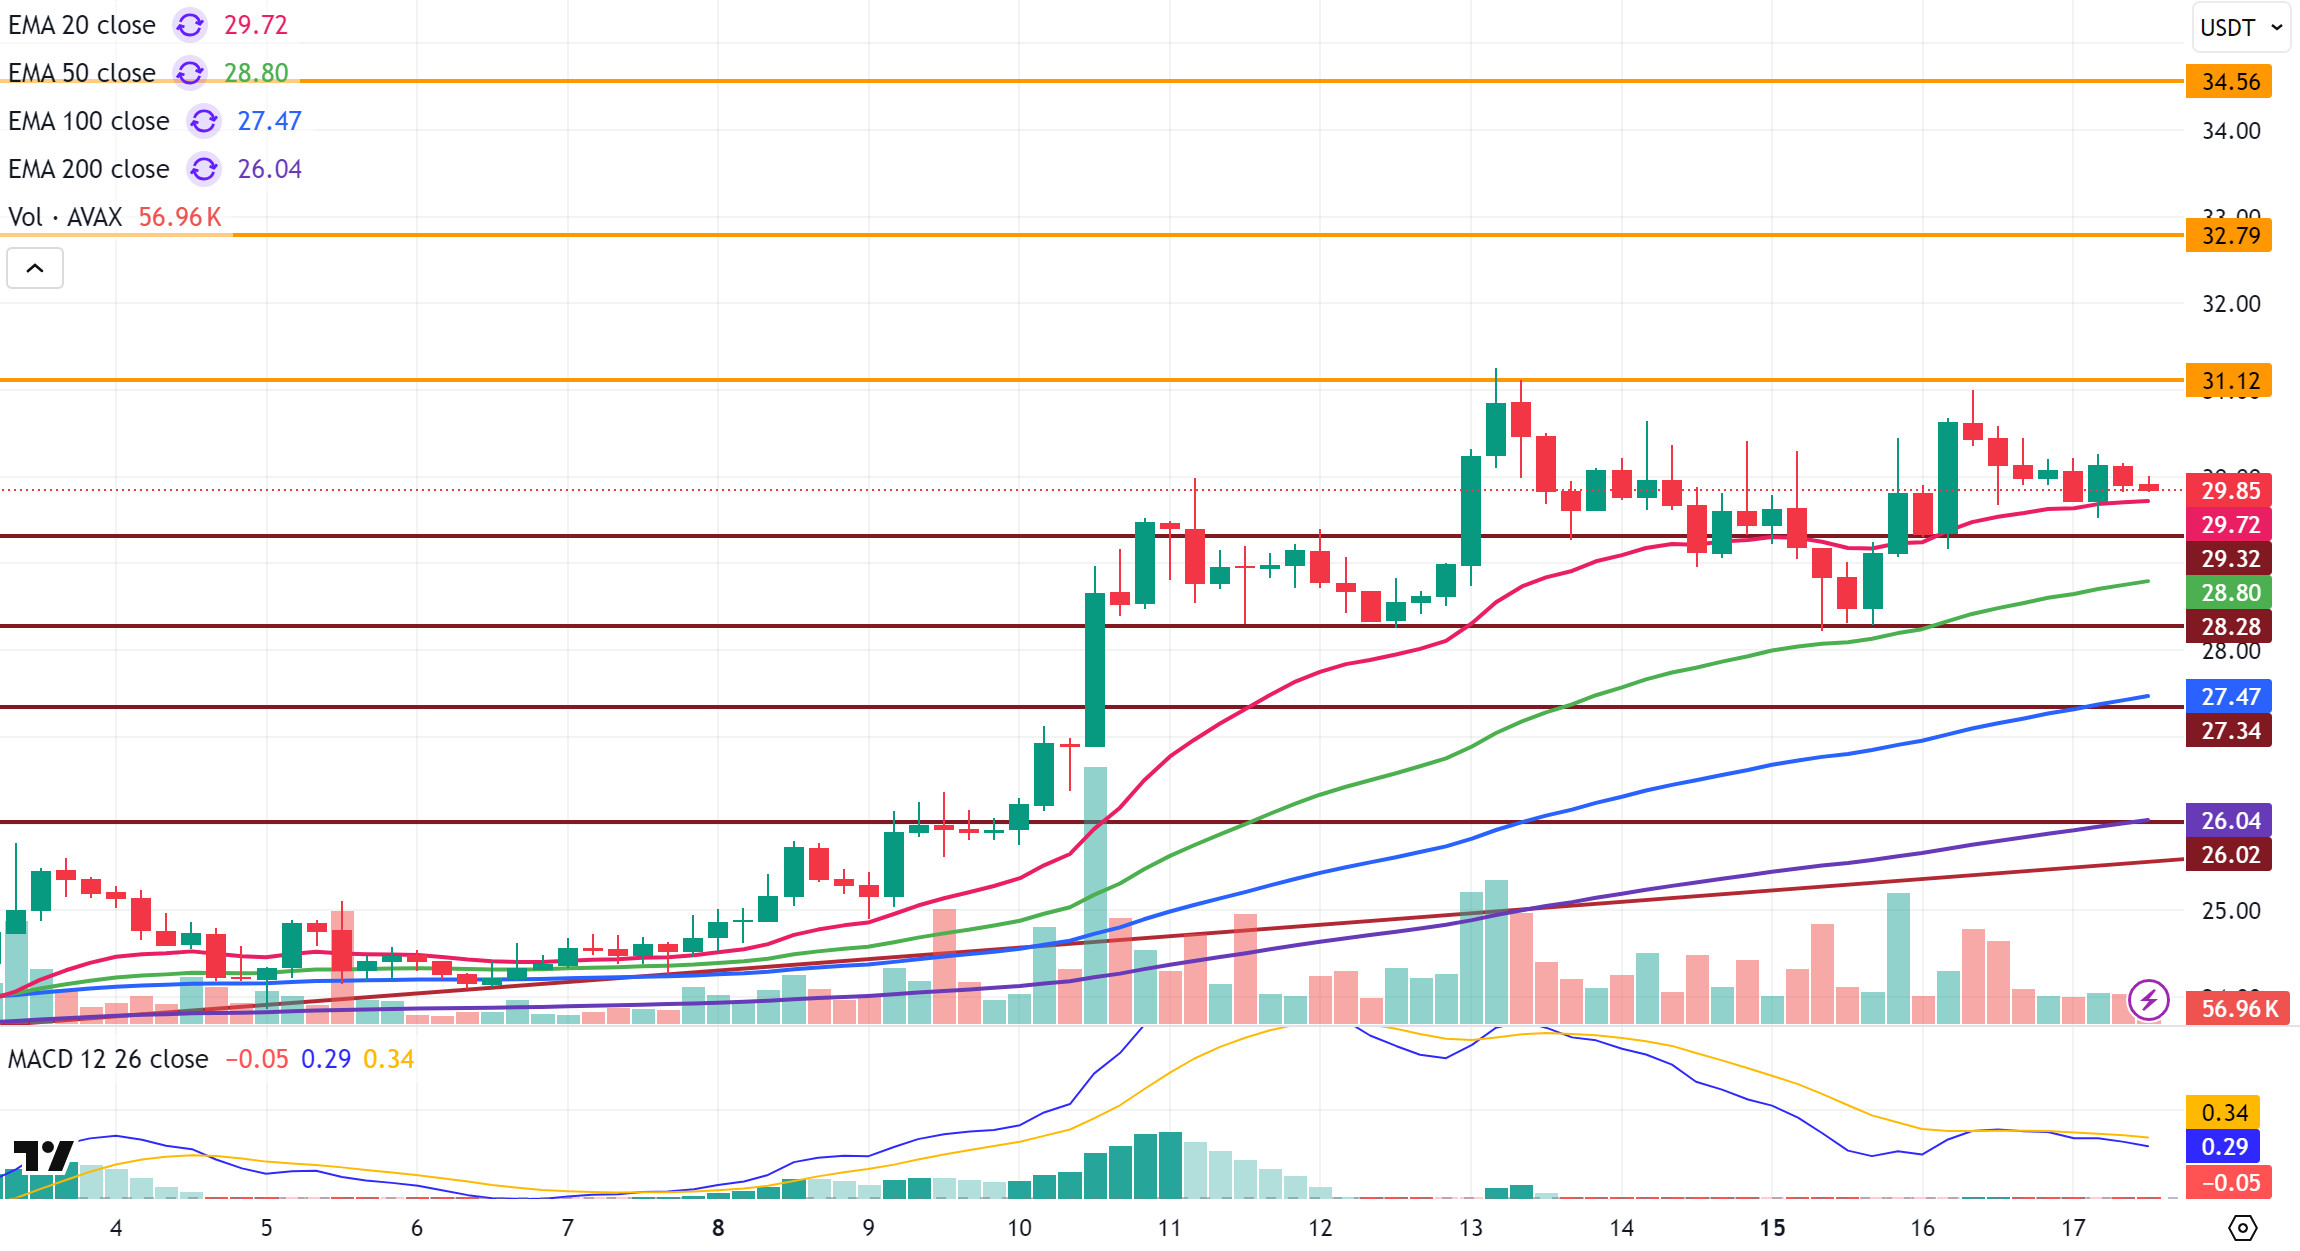
On the 4-hour chart, the Moving Average Convergence/Divergence (MACD) line is still below the signal line. This indicates that momentum is weak and the downward trend remains dominant. On the positive side, however, it is noteworthy that AVAX is still trading above critical Exponential Moving Average (EMA) levels. The EMA20 level, in particular, is the first support level to watch for a price recovery. Sustained trading above this level is important for an upward reversal.
In the short term, two scenarios stand out for AVAX, which is moving in a horizontal band ahead of the Fed meeting. In the negative scenario, i.e., if Powell speaks negatively and the rate cut pricing remains weak, AVAX may initially test the $29.32 support level. If it closes below this level, selling pressure could deepen, leading to a pullback towards the $28.28 and then $27.34 support zones. In a sharper decline, $26.02 is a critical support level, below which the $21 level could come into play. Conversely, in a positive scenario, if Powell speaks favorably and the market prices in additional rate cuts, momentum could increase, allowing AVAX to retest the $31.12 resistance level. If this level is broken, a gradual rise could target the $32.79 and then $34.56 resistance zones. If strong buying continues, a new move towards the $40 level is possible as the uptrend gains momentum. The overall outlook remains positive for AVAX as it stays above critical EMA levels. However, the continued weakness in momentum on the MACD clearly indicates that the direction will depend on the Fed’s decisions and Powell’s statements.
(EMA20: Pink Line, EMA50: Green Line, EMA100: Blue Line, EMA200: Purple Line)
Support Levels: 29.32 – 28.28 – 27.34
Resistances: 31.12 – 32.79 – 34.56
BNB/USDT
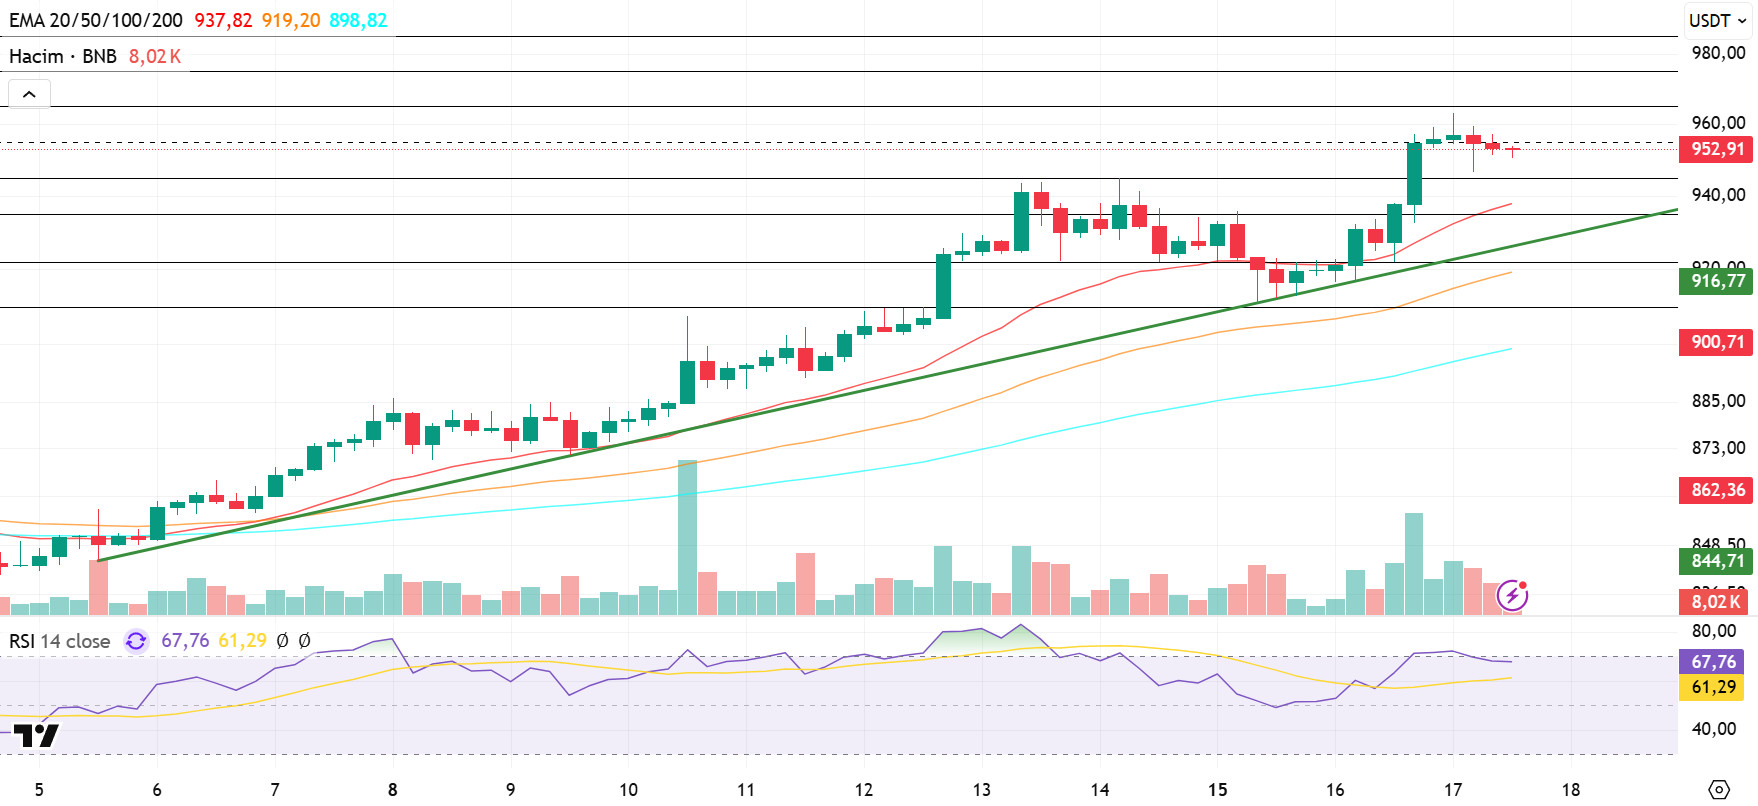
From a technical perspective, BNB/USDT entered an uptrend with strong support at the $840 level and recorded new historical highs. In this direction, BNB, which exceeded the $950 level, retreated due to selling pressure from that level.
After the pullback, the price experienced a correction towards the $945 level, and then showed a limited recovery from these levels. However, based on the newly opened candles, it is observed that selling pressure continues to have an effect, albeit partially.
Technical indicators for BNB/USDT, currently trading in the $945–965 range, suggest that the recent positive changes in trading volume point to the asset’s upward momentum continuing. Additionally, the Relative Strength Index (RSI) rose above the 70 level with the recent increases, but despite turning downward with the price correction, it is still hovering near these levels.
According to the current technical chart, if selling pressure increases, the price is likely to fall back to the $945 support level. If this level is broken downwards, the price is expected to retreat to the $935 and $920 levels. On the other hand, if buying appetite is maintained, BNB is expected to test the $965 resistance level in the first stage. If this level is exceeded, the price may move towards the $975 and $985 levels, respectively.
Supports: 945 – 935 – 920
Resistances: 965 – 975 – 985
ADA/USDT
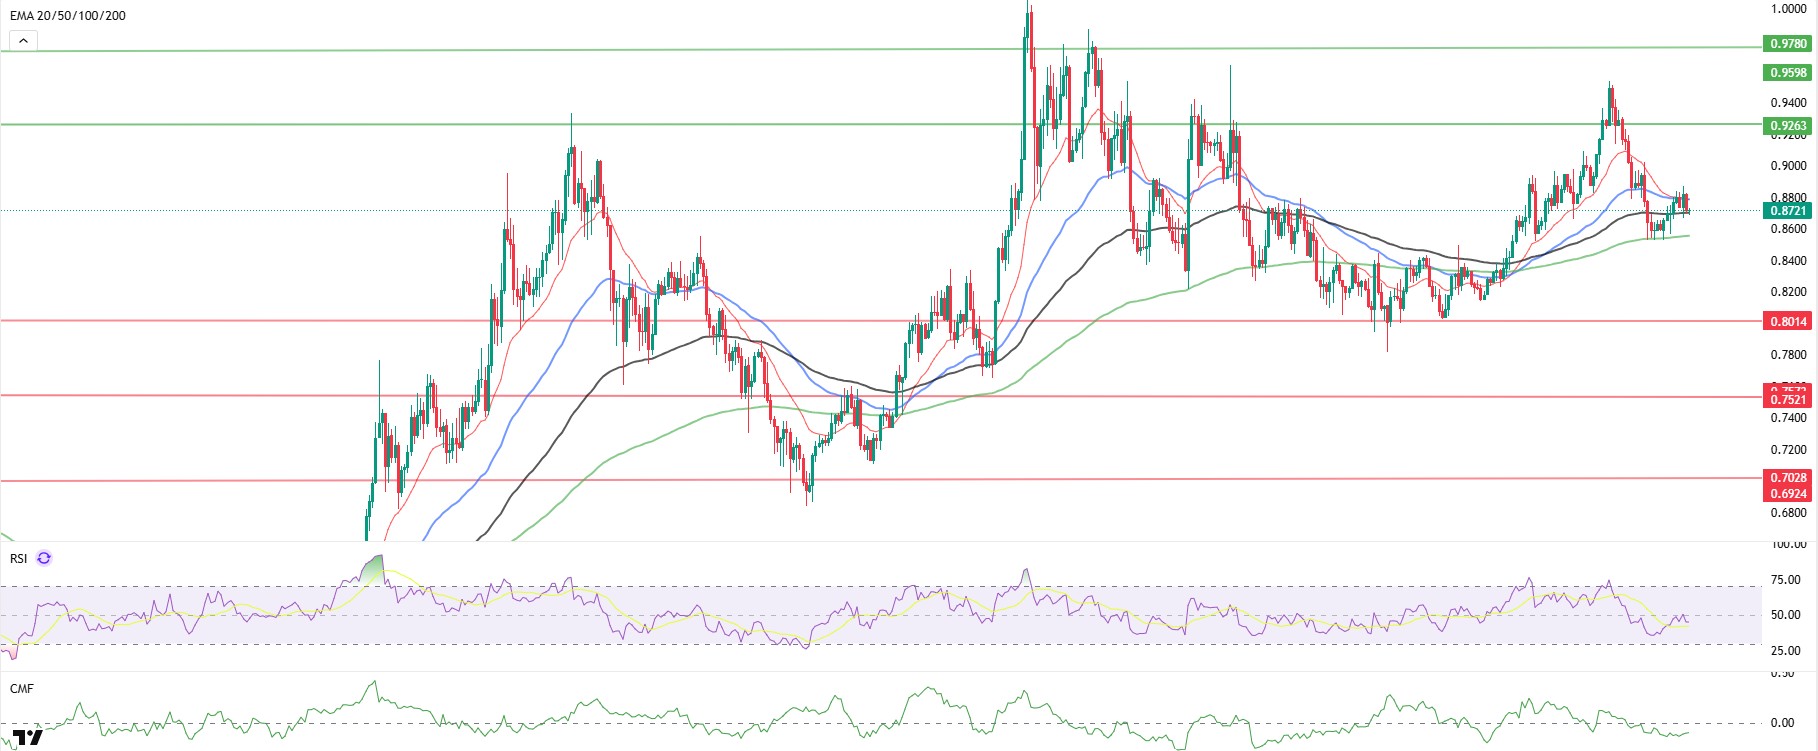
Cardano on-chain data shows an outflow of $6.7 million, indicating a cautious stance despite the uptrend. The ADA price rose to 0.8866 levels during the day before the Fed decision, liquidating long positions at 0.8800 levels. The 20-day Exponential Moving Average (EMA 20 – Red Line) and (EMA 50 – Blue Line) closing above the price is important for the continuation of the uptrend. While these two averages are preparing to intersect on the 4-hour chart, the price continues to move below the 100-day Exponential Moving Average (EMA 100 – Black Line).
Technically speaking, on the 4-hour chart, if the ADA price closes above $0.8900, it could first target $0.9500, and if the momentum continues, the $1.0245 level could be our first resistance level in the wide band range. The Relative Strength Index (RSI) has risen to 44 levels, starting to move away from the oversold zone, while the Chaikin Money Flow (CMF-20) has fallen to -0.10 levels, indicating that the selling potential continues. The decrease in cash inflows may keep the CMF in negative territory, and the negative signals from both indicators could herald a selling effect. Depending on the macroeconomic data to be released this week or positive news regarding the Cardano ecosystem, the $0.9500 level could emerge as our strong resistance point. If the decline begins, the $0.8075 level will be the key support level we monitor.
Supports: 0.8075 – 0.7380 – 0.7170
Resistances: 1.1943 – 1.0245 – 0.9500
Legal Notice
The investment information, comments, and recommendations contained herein do not constitute investment advice. Investment advisory services are provided individually by authorized institutions taking into account the risk and return preferences of individuals. The comments and recommendations contained herein are of a general nature. These recommendations may not be suitable for your financial situation and risk and return preferences. Therefore, making an investment decision based solely on the information contained herein may not produce results in line with your expectations.

