
Technical Analysis
BTC/USDT
As the US government shutdown enters its second week, differences in monetary policy are becoming more apparent. While New York Fed President John Williams and Vice Chair Michael Barr support cautious interest rate cuts, Treasury Secretary Bessent’s statements indicate that four strong candidates have emerged in the Fed chair interviews. Meanwhile, the U.S. Bureau of Labor Statistics is trying to get the delayed CPI report ready before the Fed meeting due to the shutdown. On the Chinese side, the Beijing administration has increased trade tensions by restricting exports of strategic minerals, including rare earth elements and lithium.
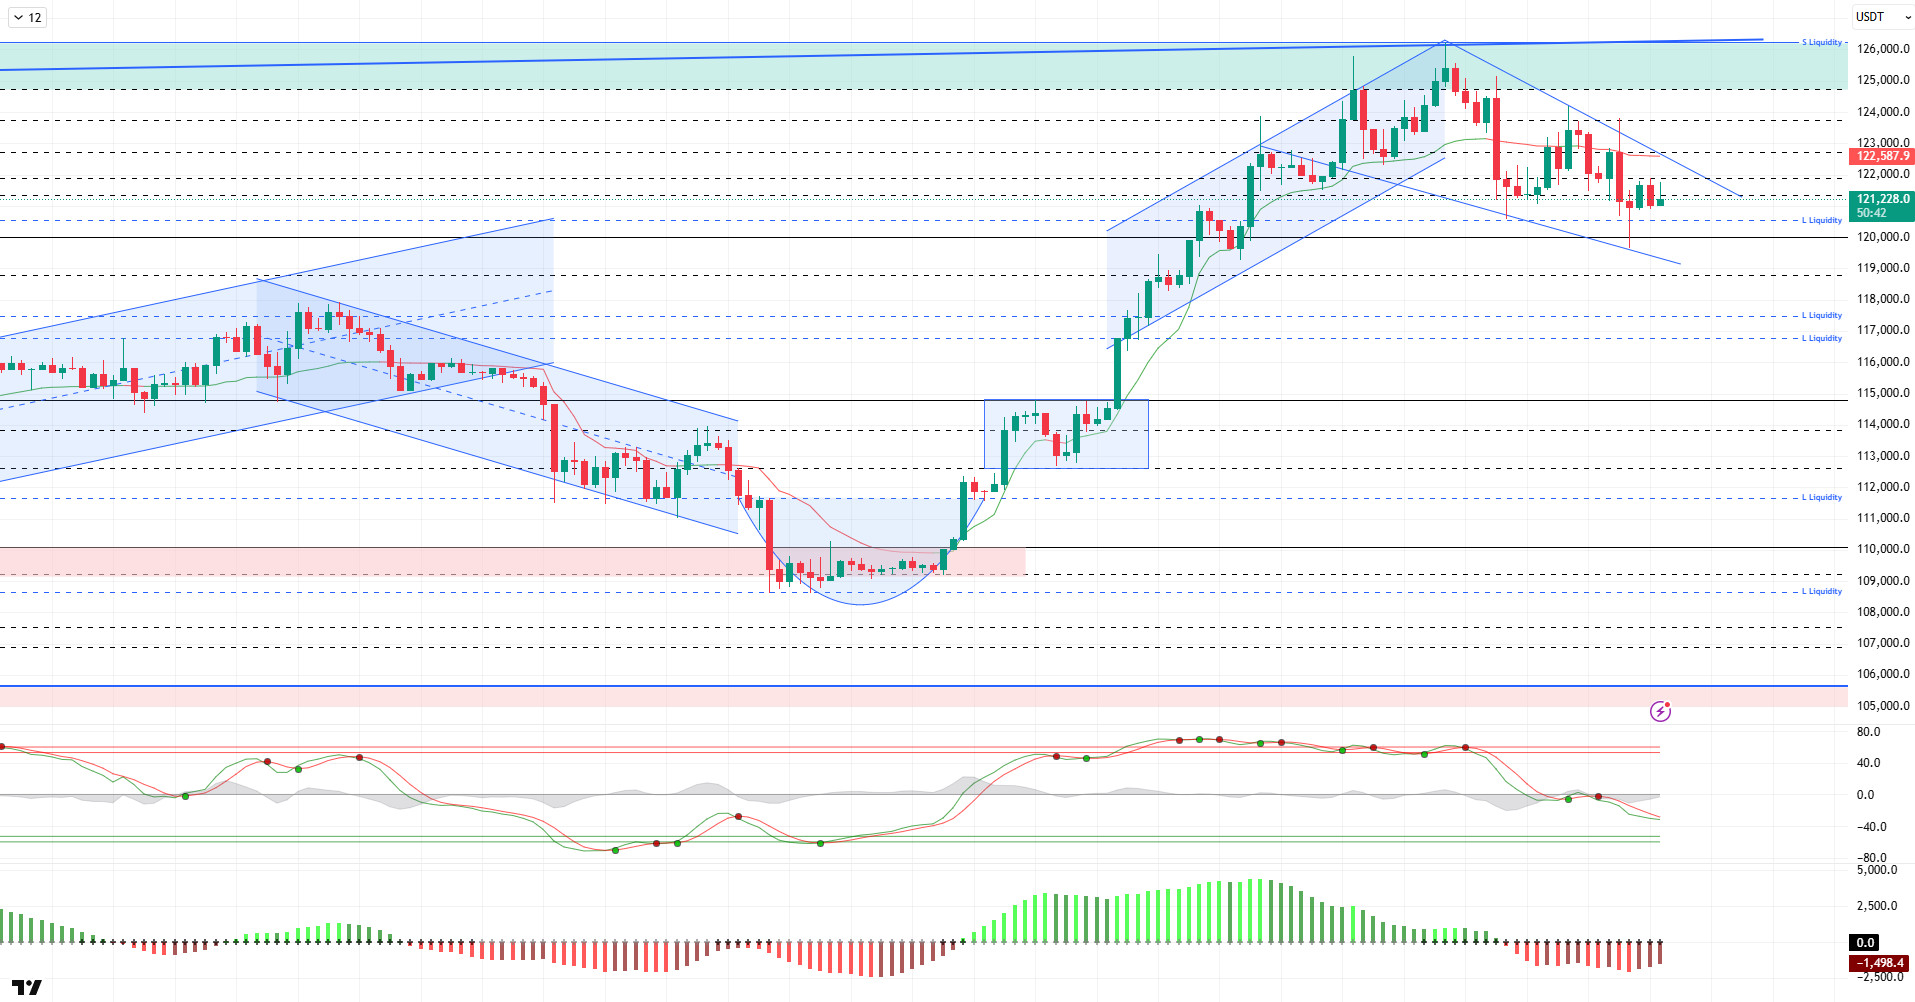
Looking at the technical picture, BTC broke its short-term uptrend by correcting after its second peak attempt at 126,198. While volatility has increased in BTC, which has formed a flag pattern close to its ATH level, it appears to be forcing futures positions to close. In the previous analysis, the price spiked to 123,800 levels and faced strong selling pressure, falling to 119,500 levels. The price, which rebounded from this level, continues to trade at 121,400 levels at the time of writing.
Technical indicators show that the Wave Trend oscillator (WT) has reversed its short-term buy signal given at the middle band of the channel back to a sell signal, continuing to paint a picture that supports the market’s indecisive structure in the short term. The Squeeze Momentum (SM) indicator’s histogram remains in negative territory. The Kaufman moving average is currently trading above the price at 122,500.
When examining liquidation data, with the recent decline, intensive buy-side transactions were liquidated at the 120,500 level, while the accumulation of illiquid buy orders below the 119,500 level was maintained. The sell level was liquidated around 122,000 in the short term, while the accumulation at the 126,400 level was maintained in the long term. According to the last 24 hours’ liquidity data, $103 million in long positions and $60 million in short positions were liquidated. The total liquidation amount across the market was recorded at $595 million.
In summary, on the fundamental side, the rise in BTC is supported by institutional demand for ETFs, expectations of Fed interest rate cuts, correlation with gold, and cyclical movements in October. The technical outlook reached saturation point as the price tested the 126,198 ATH level, while liquidity data pushed the price into a correction. Although the 120,500 support level was lost in the short term with the deepening of selling pressure, the bullish structure of the price allowed it to rise above this level again. After this stage, the deepening selling pressure will again be monitored as the critical reference area at 120,500. A break below this level could direct the price towards liquidity areas and deepen the selling pressure. In the event of a continued rise, the 122,700 resistance area comes into view.
Supports: 120,500 – 118,800 – 117,400
Resistances: 122,700 – 123,800 – 124,700
ETH/USDT
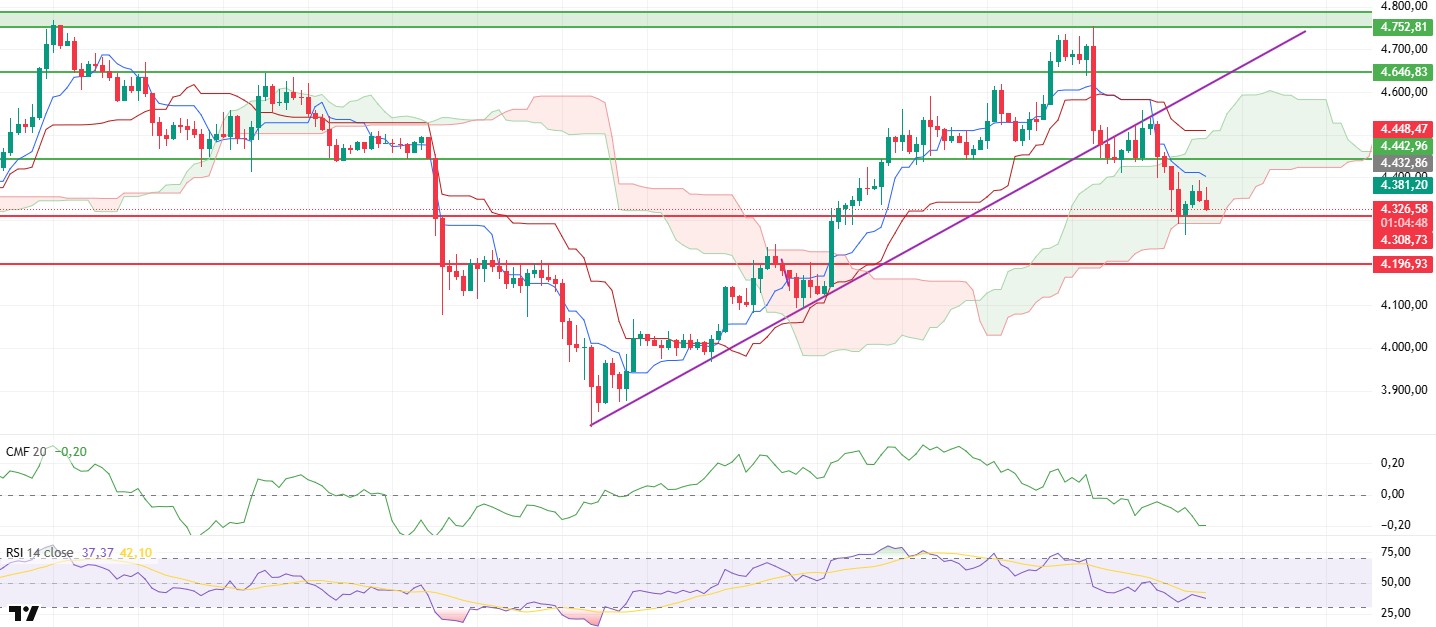
After losing the $4,442 level yesterday morning, the ETH price showed short-term recovery attempts. However, with the sharp sell-off in the evening, the market began to show signs of weakness again. In particular, insufficient liquidity flow and increased selling pressure caused the price to breach the Kumo cloud and the $4,308 support zone. With this decline, ETH fell to $4,267. Buyers re-entered at this level, causing the price to recover somewhat and return to within the kumo cloud, where it is currently trading around $4,330.
The Chaikin Money Flow (CMF) indicator remains in negative territory and continues its downward trend. This outlook indicates that capital outflows from the market are continuing and that buyers are currently cautious. The CMF’s deepening in negative territory confirms that the liquidity support necessary for sustained gains has not yet materialized.
The Relative Strength Index (RSI) indicator is showing a weak profile at the 37 level and continues its downward trend. The RSI’s position reveals that momentum-based buying pressure has weakened considerably and that the market is currently more open to selling movements. This picture shows that a clear recovery in momentum is needed for the price to gain strength in the short term.
In the technical outlook, the re-test following the break of the purple trend line on the chart has confirmed the downward pressure. The failure of this trend to break upward again indicates that short-term recoveries may be limited. For the bullish scenario to gain strength, the upper band of the kumo cloud must first be broken, followed by sustained movement above this purple trend line. Until these conditions are met, the price is likely to remain under pressure.
The downward trend of the Tenkan and Kijun lines in the Ichimoku indicator shows that market risk persists in the short term. However, the fact that the price has not yet broken below the kumo cloud indicates that the trend has not completely turned negative in the medium term. In other words, the current pullback can be considered a correction within the overall uptrend.
In the overall outlook, the $4.308 level is a critical support in the short term. Closings below this level could increase selling pressure and pull the price back to the $4.196 level. Buyers are expected to regain strength in this region, but a drop below $4.196 could lead to the trend entering a deeper correction phase. In an upward scenario, regaining the $4,442 level is critical for the market to regain confidence. Above this level, the $4,510 resistance stands out as an important threshold. If $4,510 is broken, the upward momentum could regain traction and the price could initiate a broadening move towards the $4,620 band.
Supports: 4,308 – 4,196 – 4,014
Resistances: 4,442 – 4,646 – 4,752
XRP/USDT
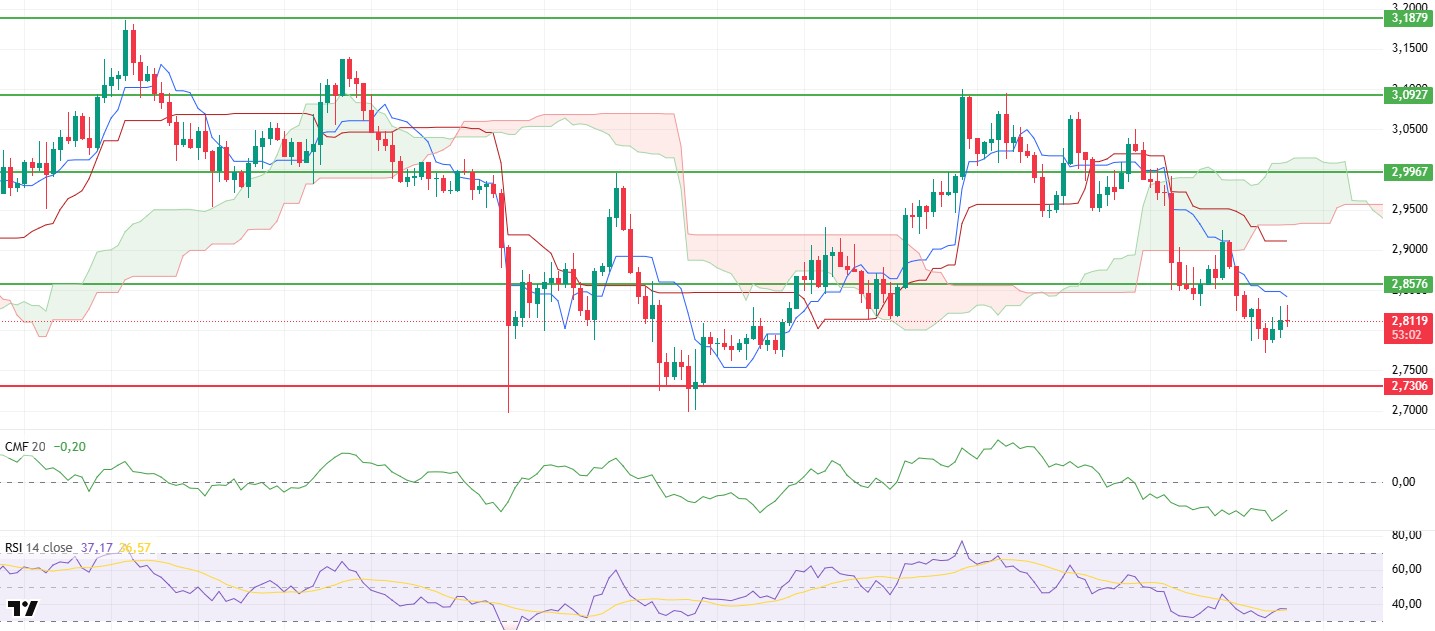
The XRP price fell to $2.77 during the day yesterday, then showed a limited recovery, rising to $2.83. However, this rise remained weak due to insufficient liquidity entering the market. The price continuing to remain below critical levels indicates that the risk of a decline in the short term persists.
The Chaikin Money Flow (CMF) indicator continues to move downward while remaining in negative territory. This outlook indicates that capital outflows from the market are continuing and that attempts to rise are struggling to find strong liquidity support. The CMF remaining in this zone confirms that sellers still maintain control over the market.
The Relative Strength Index (RSI) indicator is showing a weak picture near oversold levels. The continued low momentum reveals that buyers are reluctant to return to the market and that rebound buying may be limited. This scenario makes it difficult for the price to reverse its direction upward in the short term.
According to the Ichimoku indicator, the price remaining below the kumo cloud clearly shows that the overall trend remains negative. The price trading below the Tenkan and Kijun levels also confirms that short-term selling pressure persists.
In the overall outlook, as long as the XRP price remains below the $2.8576 level, the risk of a pullback towards the $2.73 region will continue. On the other hand, if the price regains the $2.8576 level, it could indicate that the downward momentum is weakening and a limited recovery trend may begin in the short term.
Supports: $2.7306 – $2.6513 – $2.4730
Resistances: 2.8576 – 2.9967 – 3.0927
SOL/USDT
DeFi Development Corp. announced a strategic partnership with Superteam Japan to launch DFDV Japan (DFDV JP), the country’s first Solana-focused treasury initiative.
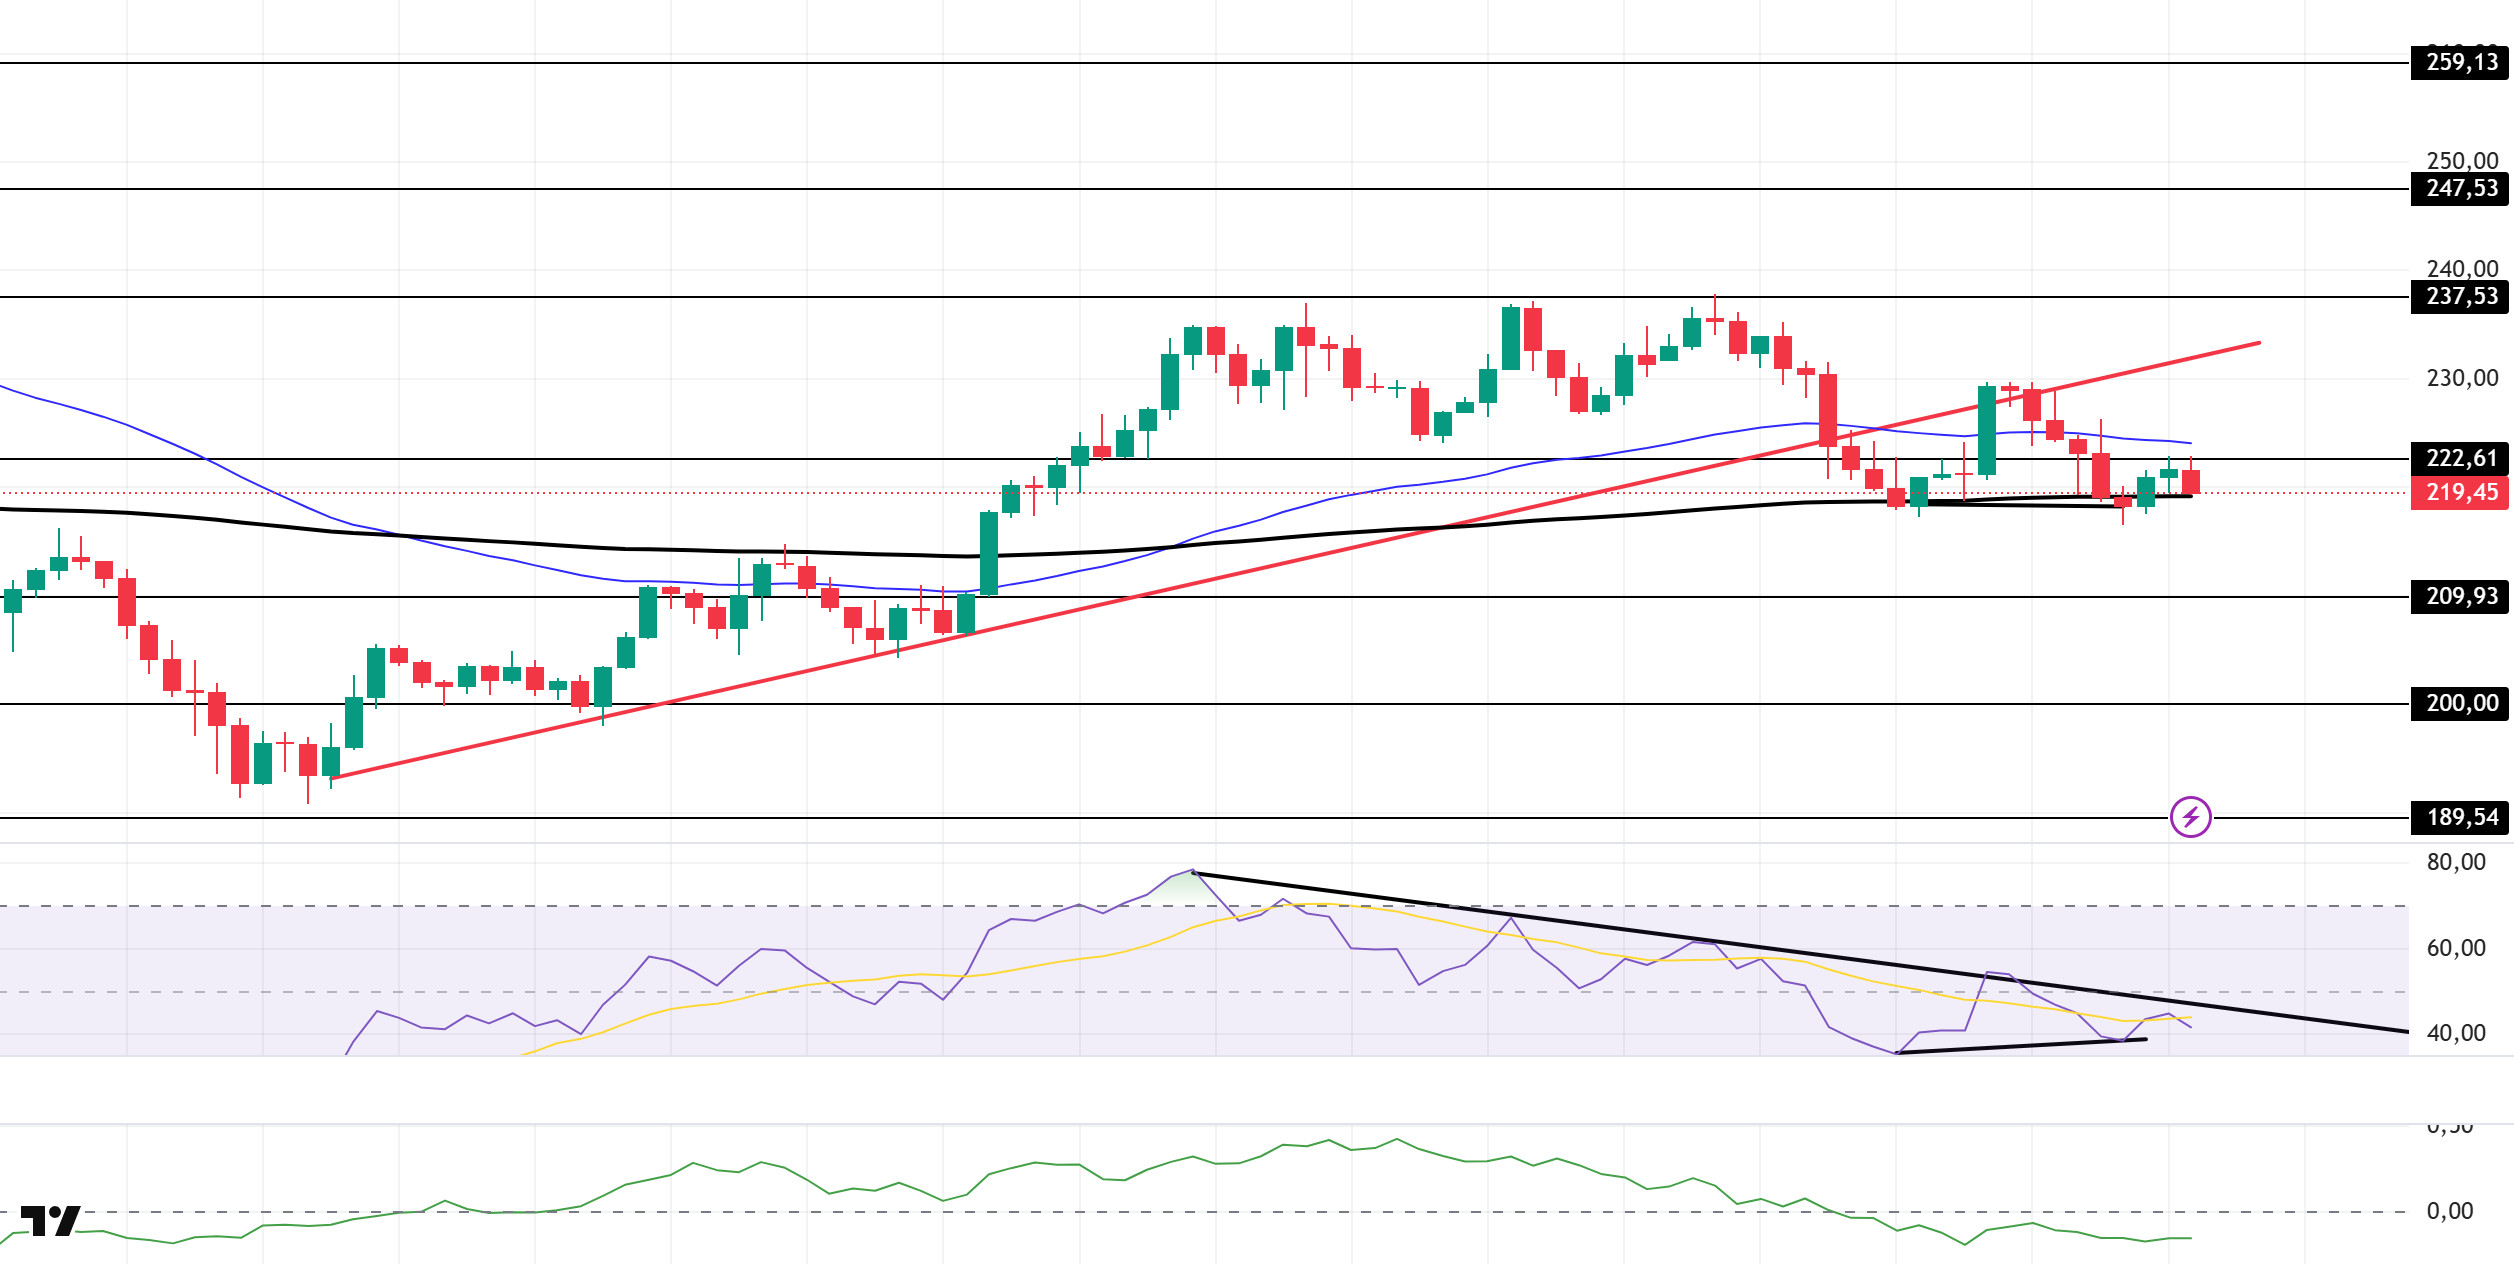
The SOL price has been moving sideways. The asset continues to trade in the lower region of the upward trend that began on September 26. This could increase selling pressure. The price, which continues to trade below the 50 EMA (Blue Line) moving average, is currently testing the 200 EMA (Black Line) moving average, which is a strong support level. If the uptrend begins, it could test the $237.53 level and the upward trend as resistance. If the downtrend begins, the $209.93 level could be monitored.
On the 4-hour chart, it remained above the 50 EMA (Exponential Moving Average – Blue Line) and 200 EMA (Black Line). This indicates a possible uptrend in the medium term. At the same time, the price being between the two moving averages shows us that the asset is in a decision phase in the short term. The Chaikin Money Flow (CMF-20) remained in negative territory. However, a decrease in money inflows could push the CMF deeper into negative territory. The Relative Strength Index (RSI-14) tested the resistance line that began on October 2 and failed to break through, retreating into negative territory. This could increase selling pressure. At the same time, there is a positive divergence. This could trigger an uptrend. If an uptrend occurs due to macroeconomic data or positive news related to the Solana ecosystem, the $237.53 level stands out as a strong resistance point. If this level is broken upwards, the uptrend is expected to continue. If there are pullbacks due to developments in the opposite direction or profit-taking, the $209.93 level could be tested. A decline to these support levels could increase buying momentum, presenting a potential opportunity for an uptrend.
Supports: 209.93 – 200.00 – 189.54
Resistances: 222.61 – 237.53 – 247.53
DOGE/USDT
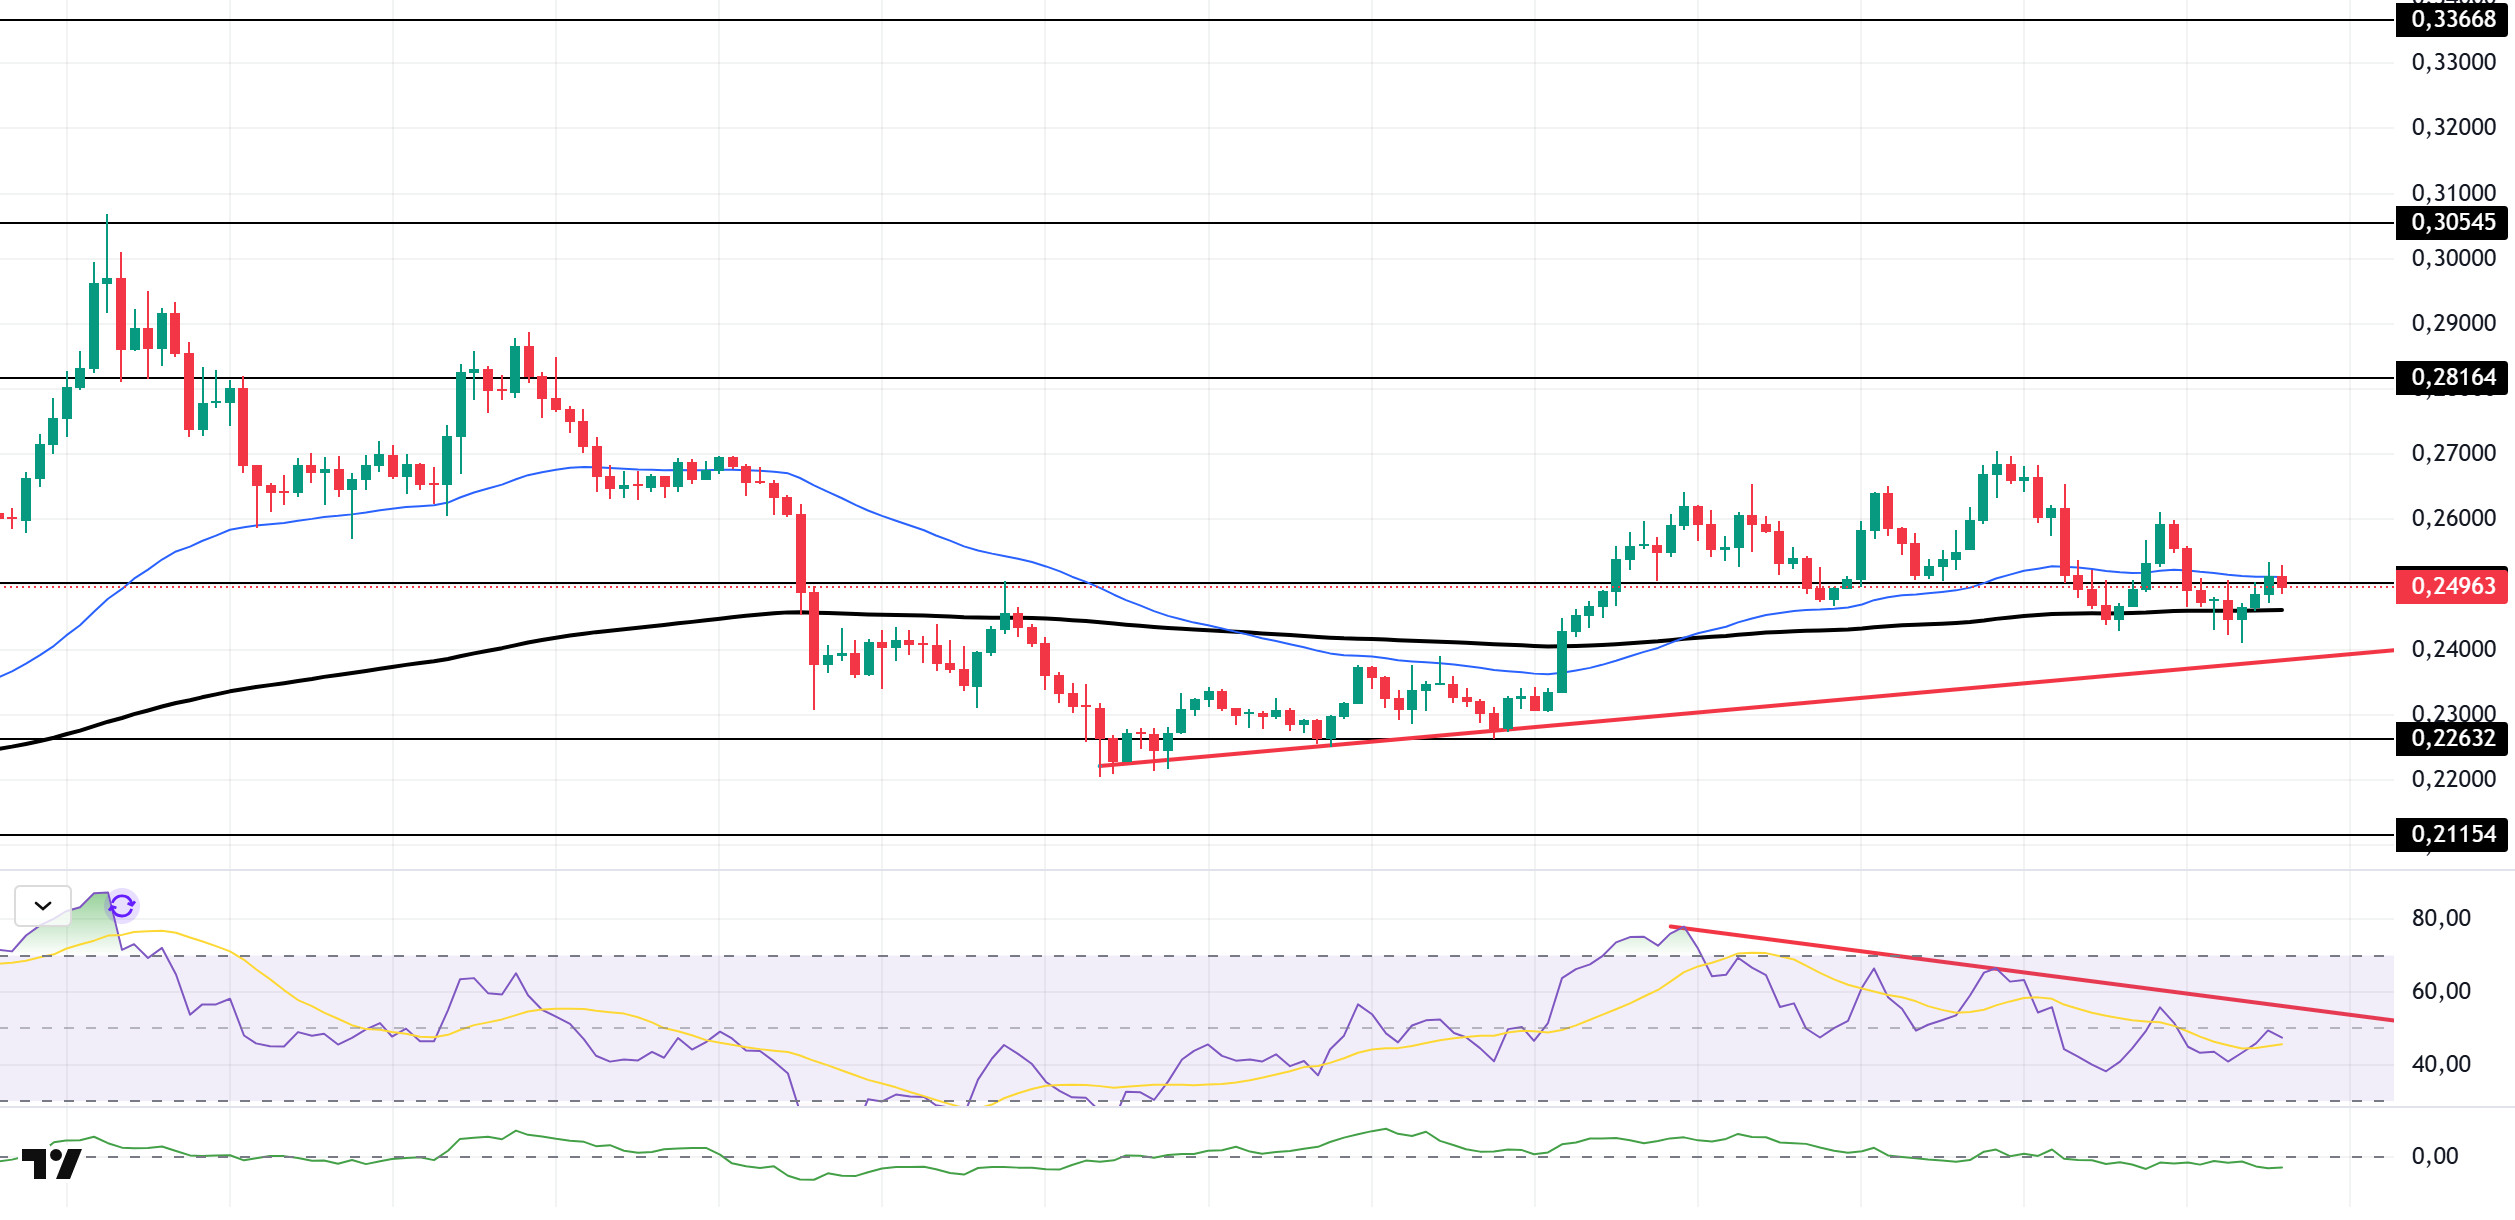
The DOGE price experienced a slight increase. The asset continues to trade above the upward trend that began on September 25. The price, supported by the 200 EMA (Black Line) moving average, broke through the strong resistance level of $0.25025 and continued its upward movement. As of now, the price has also broken above the 50 EMA (Blue Line) moving average and could test the $0.28164 level if the uptrend continues. In case of a pullback, the rising trend level should be monitored.
On the 4-hour chart, the 50 EMA (Exponential Moving Average – Blue Line) remained above the 200 EMA (Black Line). This indicates that an uptrend may begin in the medium term. The price being between the two moving averages shows that the price is in a decision-making phase in the short term. The Chaikin Money Flow (CMF-20) experienced a slight rise towards the neutral level. Additionally, a decrease in money inflows could push the CMF deeper into negative territory. The Relative Strength Index (RSI-14) remained below the downward trend that began on October 2, continuing to stay in negative territory. This signaled that selling pressure was continuing. In the event of a rise due to political developments, macroeconomic data, or positive news flow in the DOGE ecosystem, the $0.28164 level stands out as a strong resistance zone. Conversely, in the event of a bearish trend ( ) or potential negative news flow, the $0.22632 level could be triggered. A decline to these levels could increase momentum and potentially initiate a new upward wave.
Supports: 0.25025 – 0.22632 – 0.21154
Resistances: 0.28164 – 0.30545 – 0.33668
SUI/USDT
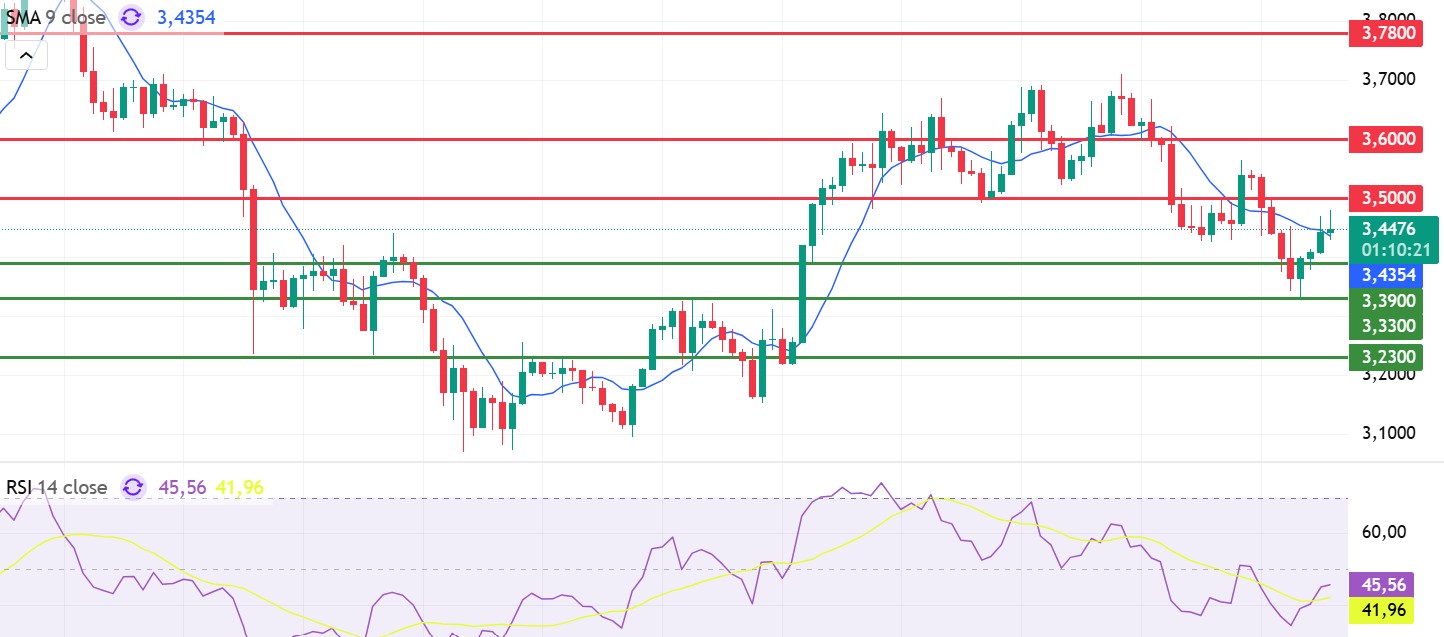
Looking at Sui’s technical outlook, we see that the price has fallen to the $3.44 level on the 4-hour chart, influenced by fundamental developments. The Relative Strength Index (RSI) is currently in the 45.56 – 41.96 range. This range indicates that the market is trading close to the buy zone; a drop in the RSI to the 35.00 – 45.00 range could signal a potential buying point. If the price moves upward, the $3.50 – $3.60 – $3.78 levels can be monitored as resistance points. However, if the price falls to new lows, it may indicate that selling pressure could deepen. In this case, the $3.39 and $3.33 levels stand out as strong support zones. In particular, in the event of a sharp sell-off, a pullback to $3.23 appears technically possible.
According to Simple Moving Averages (SMA) data, Sui’s average price is currently at the $3.43 level. The price remaining above this level indicates that the current uptrend could technically continue.
Supports: 3.23 – 3.33 – 3.39
Resistances: 3.50 – 3.60 – 3.78
Legal Notice
The investment information, comments, and recommendations contained herein do not constitute investment advice. Investment advisory services are provided individually by authorized institutions taking into account the risk and return preferences of individuals. The comments and recommendations contained herein are of a general nature. These recommendations may not be suitable for your financial situation and risk and return preferences. Therefore, making an investment decision based solely on the information contained herein may not produce results in line with your expectations.


