
Technical Analysis
BTC/USDT
As tensions between Iran and the United States moved to a new threshold, harsh statements from Iran and the decision to close the Strait of Hormuz increased global tensions. While the US Secretary of State announced on June 23rd that they are ready for negotiations, President Trump’s special envoy called on Elon Musk to launch Starlink in Iran. On the other hand, institutional Bitcoin investments continue unabated; Michael Saylor signaled new purchases, while Japanese company Metaplanet increased its BTC reserve to 11,111.
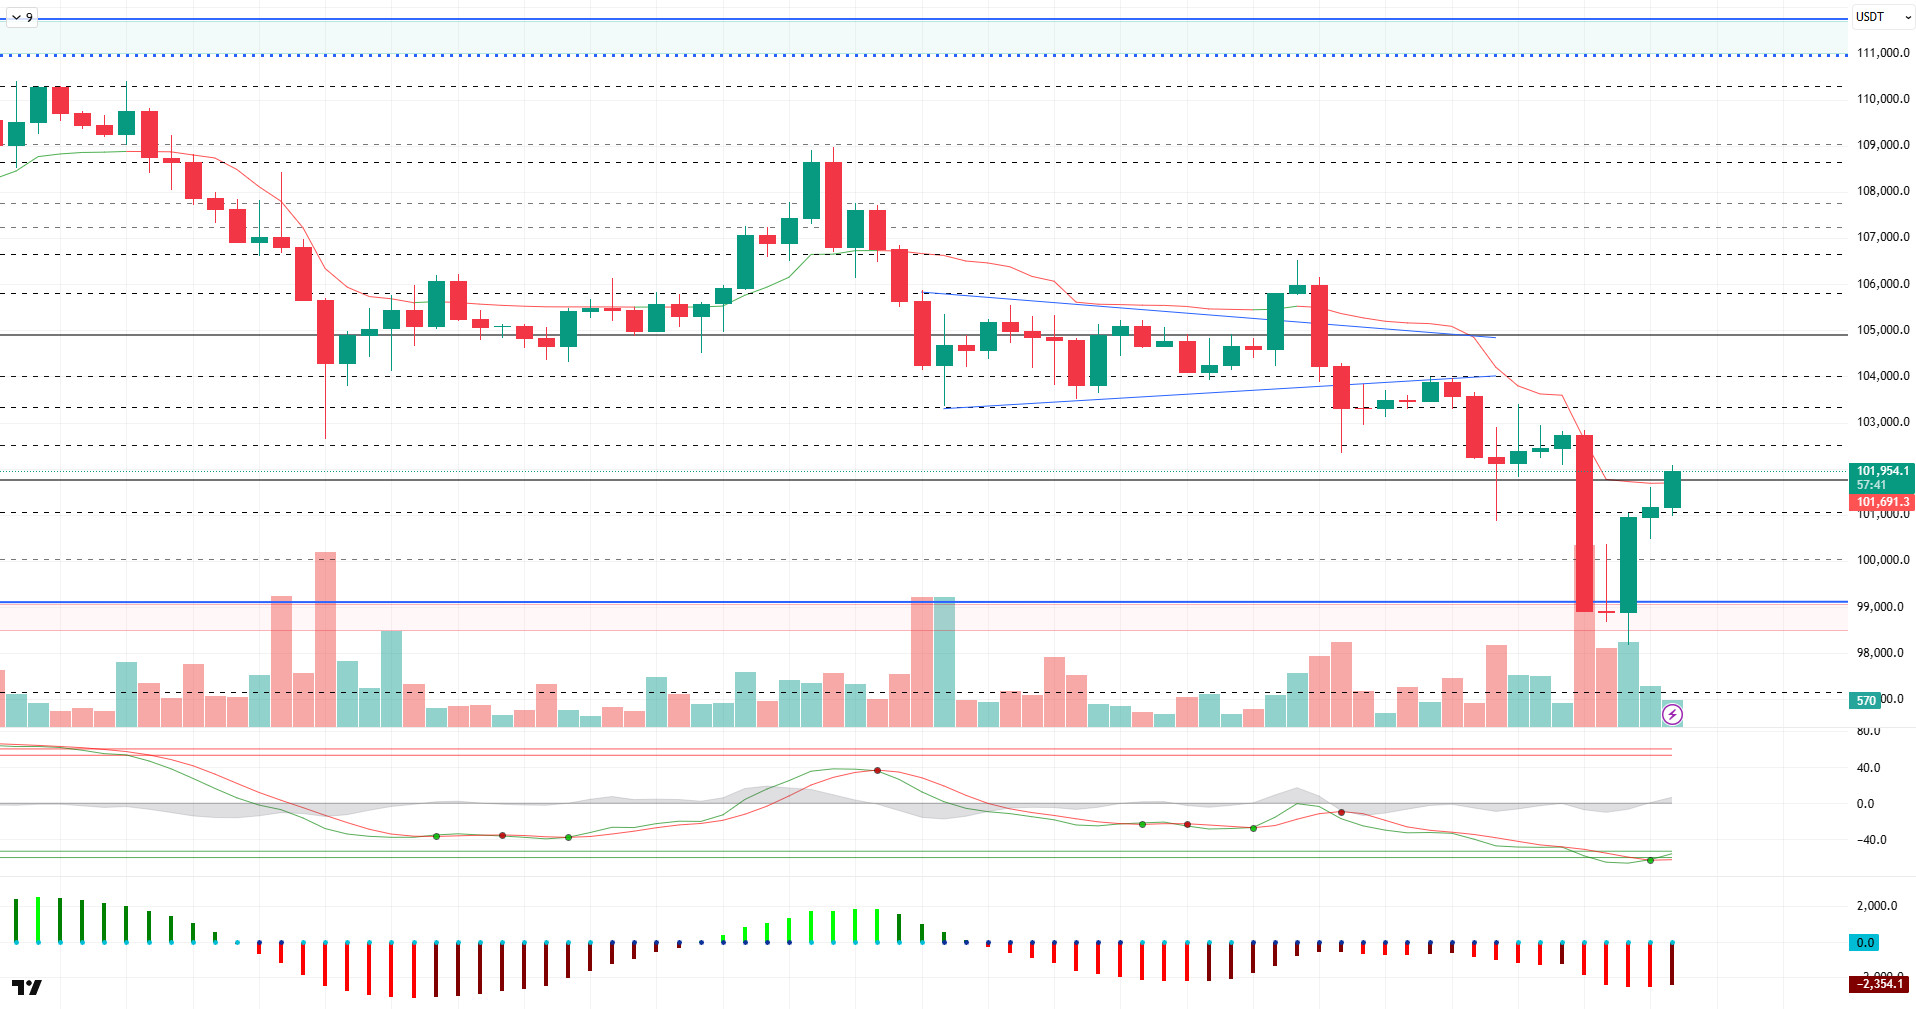
Looking at the technical outlook, BTC price fell sharply to 98,200 last week, losing support levels of 104,000 and then 103,000. At the time of writing, BTC has recovered somewhat and is trading above six-digit levels again at 101,800.
On the technical indicators front, the Wave Trend (WT) oscillator is preparing for a trend reversal in the ovelsold area, while the Squeeze Momentum (SM) indicator is moving in negative territory. Kaufman moving average is positioned at 101,800, just above the price.
When the liquidity data is analyzed, almost all of the buying direction is liquidated, while with the recent decline, the 104,000- 105,000 band appears as the levels where selling positions are accumulated.
As a result, BTC continues to price in a downtrend. The price, which does not give a clear image for technical recovery, draws attention to the sparseness of buying positions in liquidity data. The positive scenario created by fundamental developments and a possible compromise is a critical point for the price to recover again. On the other hand, if bearish movements and selling pressure continue, the 98,000 – 99,000 band will be followed as a reference support area.
Supports 101,400 – 100,000 – 99,000
Resistances 102,400 – 103,300 – 104,000
ETH/USDT
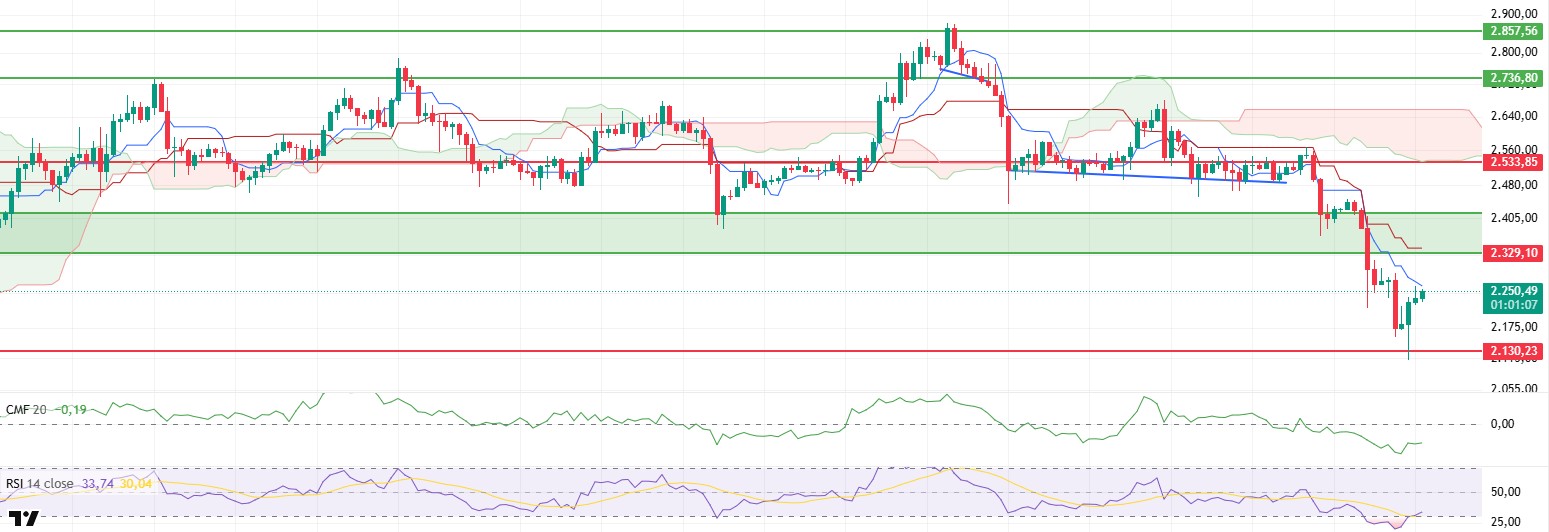
As the war between Israel and Iran entered its 11th day, the direct involvement of the US in the process by targeting critical nuclear facilities such as Natanz, Isfahan and Fordo in Iran further increased the perception of geopolitical risk. The impact of rising tensions on global markets has started to be felt especially on the cryptocurrency side. With the impact of these developments, the ETH price has declined since Friday, first to the support range defined as the green zone on the chart, and then to the levels of $2,130. With the purchases coming from this level, the price managed to make a short-term recovery and managed to rise above the $2,200 level again.
On the technical indicators side, important breaks and changes are observed with this price movement. The transition of the Chaikin Money Flow (CMF) indicator into the negative zone and the continuation of its movement in this area clearly reveals that the selling pressure has increased and a large amount of liquidity has left the market. This data indicates that the bearish process is supported not only technically but also volumetrically and that the buy side has not yet been able to respond adequately.
Relative Strength Index (RSI), on the other hand, has fallen to the oversold zone with the effect of the retracement. However, with the slight recovery that started from this region, the RSI seems to have started an upward trend again and started to signal a gradual recovery in momentum.
On the Ichimoku indicator, the technical structure remains negative. The fact that pricing remains below both the tenkan and kijun levels and moves below the kumo cloud confirms that the trend is still downward in the short term. In particular, the failure to overcome the tenkan resistance at $ 2,261 constitutes a significant obstacle for positive scenarios in terms of ichimoku. Unless pricing above this level is realized, it seems difficult for the short-term upward structure to gain technical validity.
Considering the current indicators and technical structure, ETH price is likely to move sideways between $2,261 and $2,130 in the short term. If the $2,130 level is retested, caution should be exercised against breaking this support level, while in case of persistence above $2,261, it may be possible for the price to trigger rises up to the lower band of the green zone.
Top of Form
Below the Form
Supports 2,130 – 2,029 – 1,802
Resistances 2,329 – 2,533 – 2,736
XRP/USDT
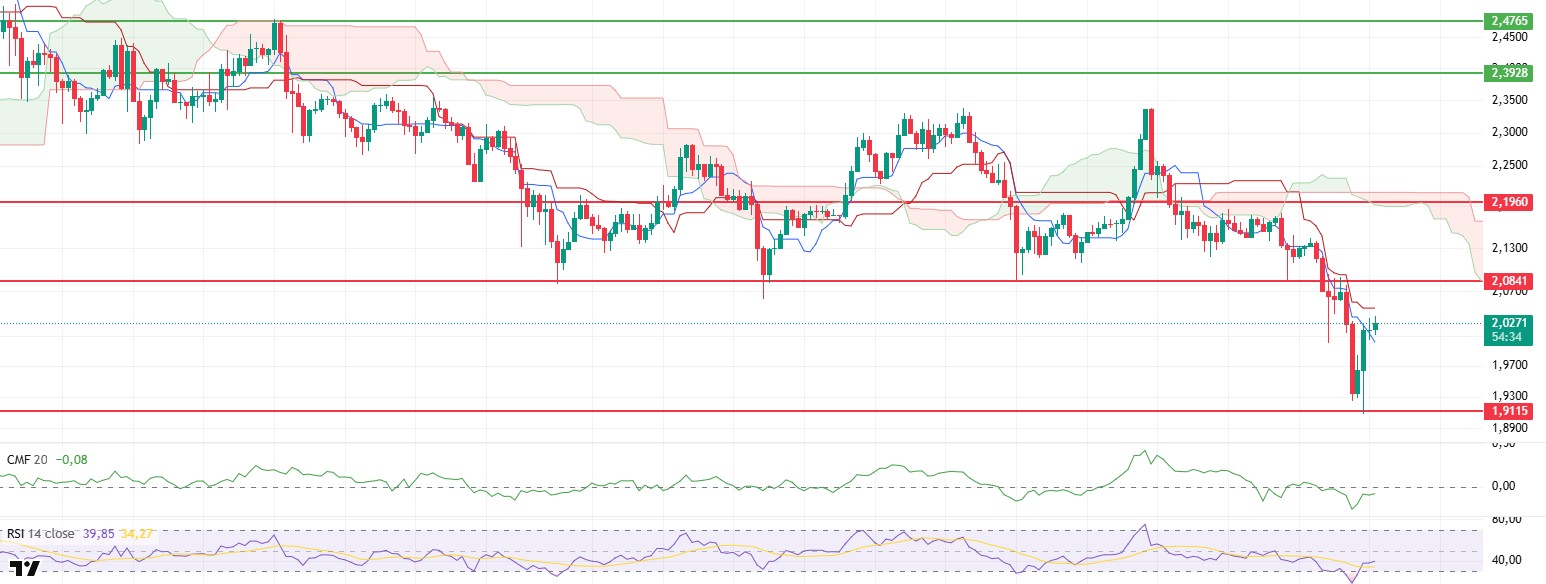
XRP depreciated sharply in line with the general downtrend seen in the cryptocurrency market as the recent geopolitical developments in the Israel-Iran line reduced the global risk appetite. In this process, the price first retreated to the important support zone at the level of $2.08 and then to the level of $1.91. However, with the reaction purchases as of yesterday, the price managed to rise above the $2 level, which can be considered as the psychological threshold, and exhibited a short-term recovery trend.
Looking at the technical indicators, the Relative Strength Index (RSI) indicator fell to the oversold zone during the downtrend, revealing the severity of the selling pressure in the market. With the recovery from this area, the RSI regained an upward momentum and managed to rise above the oversold zone. However, the negative divergence observed on the RSI, although it shows that the momentum is strengthening, is a risk factor that may put pressure on the price again. This suggests that the upside may remain limited and selling reactions may re-emerge.
In terms of liquidity flow, the Chaikin Money Flow (CMF) indicator briefly crossed into negative territory with the price decline, but recovered with the recent bullish move and headed back to positive territory. This recovery indicates that liquidity inflows to the market have resumed and the buy side is mobilizing. CMF’s positive outlook indicates a structure where bullish scenarios are technically supported.
On the Ichimoku indicator, the outlook is still negative. The price hovering under the kumo cloud indicates that the short-term trend is downward. However, with the recent rise, the price retested the tenkan level and tried to gain this level, technically supporting the possibility of a short-term recovery. In particular, if the price maintains above the tenkan level, the possibility of positive scenarios coming into play in the short term may increase.
In the light of all these data, with the general positive trend of the indicators, the price has the potential to test the $2.08 level again. However, if the negative divergence on the RSI works technically, the possibility that the price may face selling pressure again and test the $1.91 support level should not be ignored. Therefore, it would be beneficial to adopt a cautious approach by evaluating both the potential for recovery and the risk of retracement together.
Supports 1.9115 – 1.7226 – 1.6309
Resistances 2.0841 – 2.1960- 2.3928
SOL/USDT
Upexi CEO and CSO Solana announces treasury strategies. Pump.fun token auction postponed to mid-July. Byreal, the ultimate onchain liquidity layer for real assets, officially announced its brand launch today. The Solana Foundation has partnered with Kazakhstan to launch a Solana Economic Zone targeting tokenized capital markets and talent development.
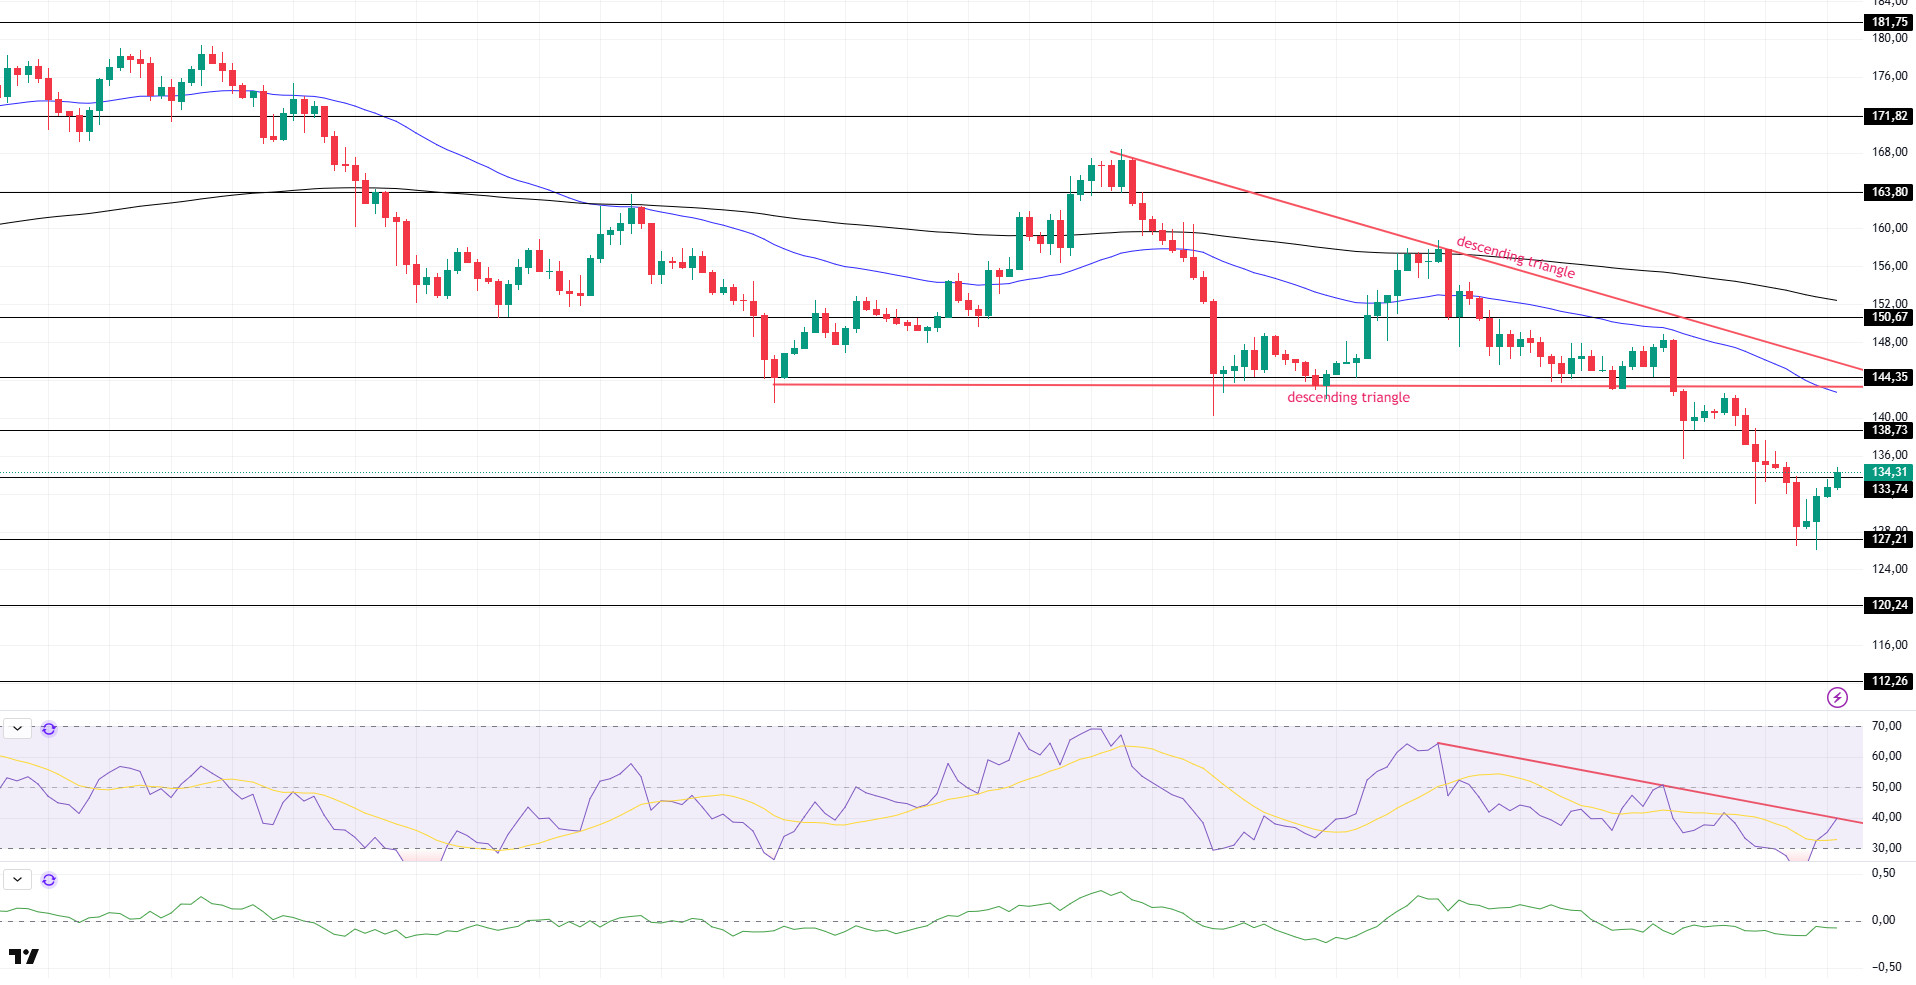
SOL price plunged deeply, dropping by around 11%. The asset tested the base level of the descending triangle pattern with strong support and broke it to the downside with a strong candle and retreated to the strong support level of $127.21. The price, which is experiencing acceleration supported from here, is currently testing the strong resistance level of $ 133.74. If the upward movement continues, it may test the $ 138.73 level and the 50 EMA (Blue Line) moving average as resistance.
On the 4-hour chart, the 50 EMA continued to be below the 200 EMA. This suggests that the bearish trend may continue in the medium term. At the same time, the fact that the price is below both moving averages suggests that the market may continue to retreat in the short term. On the other hand, the large distance between the price and both moving averages may allow the price to rebound. Chaikin Money Flow (CMF-20) continued to be in the negative territory; in addition, the decrease in daily inflows may push CMF deeper into the negative zone. Relative Strength Index (RSI-14), on the other hand, rose from oversold territory to the mid-level of the negative zone. On the other hand, it remains below the downtrend that started on June 16. In case of an uptrend due to macroeconomic data or positive news on the Solana ecosystem, the $138.73 level stands out as a strong resistance point. If this level is broken upwards, the rise can be expected to continue. If there are pullbacks due to contrary developments or profit realizations, the $ 127.21 level can be tested. In case of a decline to these support levels, the increase in buying momentum may offer a potential bullish opportunity.
Supports 127.21 – 120.24 – 112.26
Resistances 133.74 – 138.73 – 144.35
DOGE/USDT
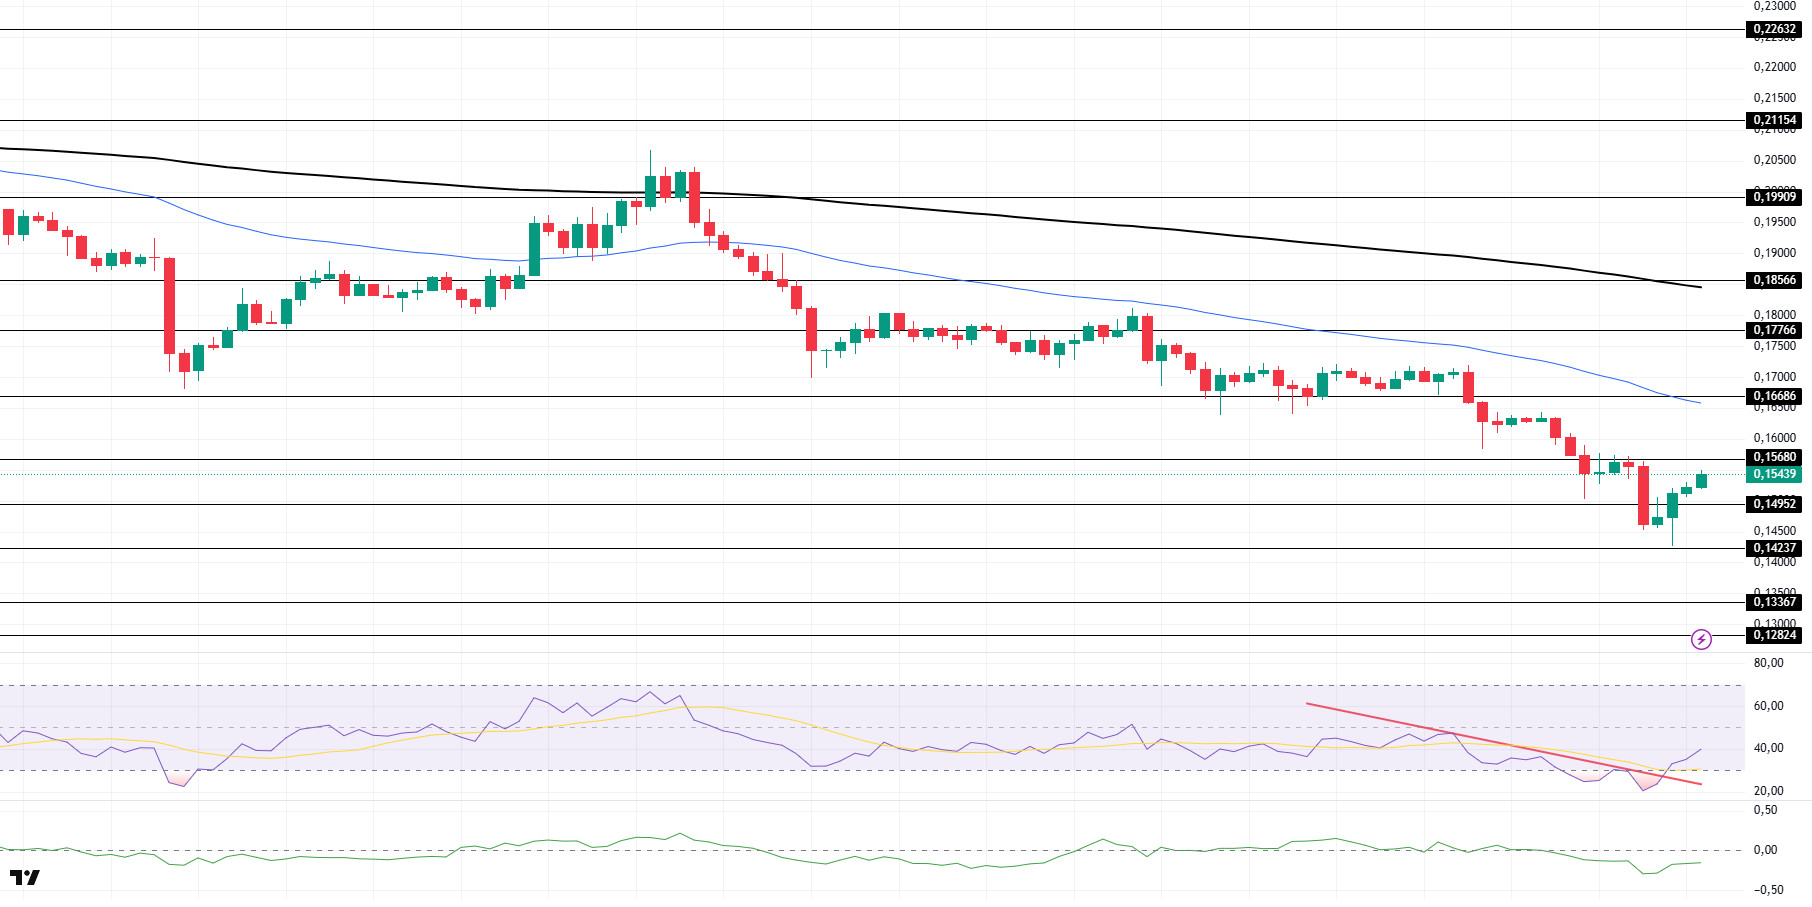
DOGE price kept pace with the crypto market and deepened the pullback . The price broke the strong support at $0.16686 with a strong candle to the downside and lost about 14% from there. The asset, which accelerated from the strong support at $0.14237, may test the $0.16686 level if it continues to accelerate. Otherwise, the strong support level of $ 0.14237 should be followed.
On the 4-hour chart, the 50 EMA (Blue Line) continues to be below the 200 EMA (Black Line). This suggests that the asset is bearish in the medium term. The fact that the price is below the two moving averages signals a continuation of the asset’s bearish trend in the short term. Chaikin Money Flow (CMF-20) crossed into negative territory. In addition, negative money inflows may push CMF deeper into negative territory. Relative Strength Index (RSI-14) remained in the negative territory. However, it managed to break the downtrend that has formed since June 20 to the upside. This could be bullish. The $0.16686 level stands out as a strong resistance zone in the case of possible rises in line with political developments, macroeconomic data or positive news flow in the DOGE ecosystem. In the opposite case or possible negative news flow, the 0.14237 dollar level may be triggered. In case of a decline to these levels, the momentum may increase and a new bullish wave may start.
Supports 0.14952 – 0.14237 – 0.13367
Resistances 0.15680 – 0.16686 – 0.17766
Legal Notice
The investment information, comments and recommendations contained herein do not constitute investment advice. Investment advisory services are provided individually by authorized institutions taking into account the risk and return preferences of individuals. The comments and recommendations contained herein are of a general nature. These recommendations may not be suitable for your financial situation and risk and return preferences. Therefore, making an investment decision based solely on the information contained herein may not produce results in line with your expectations.