
Technical Analysis
BTC/USDT
Gold’s total market value has surpassed $28 trillion, ranking first in the global asset rankings. BlackRock’s CEO announced that there are over $4.5 trillion in assets held in digital wallets worldwide. The company transferred approximately $440 million (703.74 BTC and 93,158 ETH) to a centralized exchange on the same day. Meanwhile, the US government transferred 667.67 BTC seized in the crypto fraud case against Estonians Potapenko and Turogin.
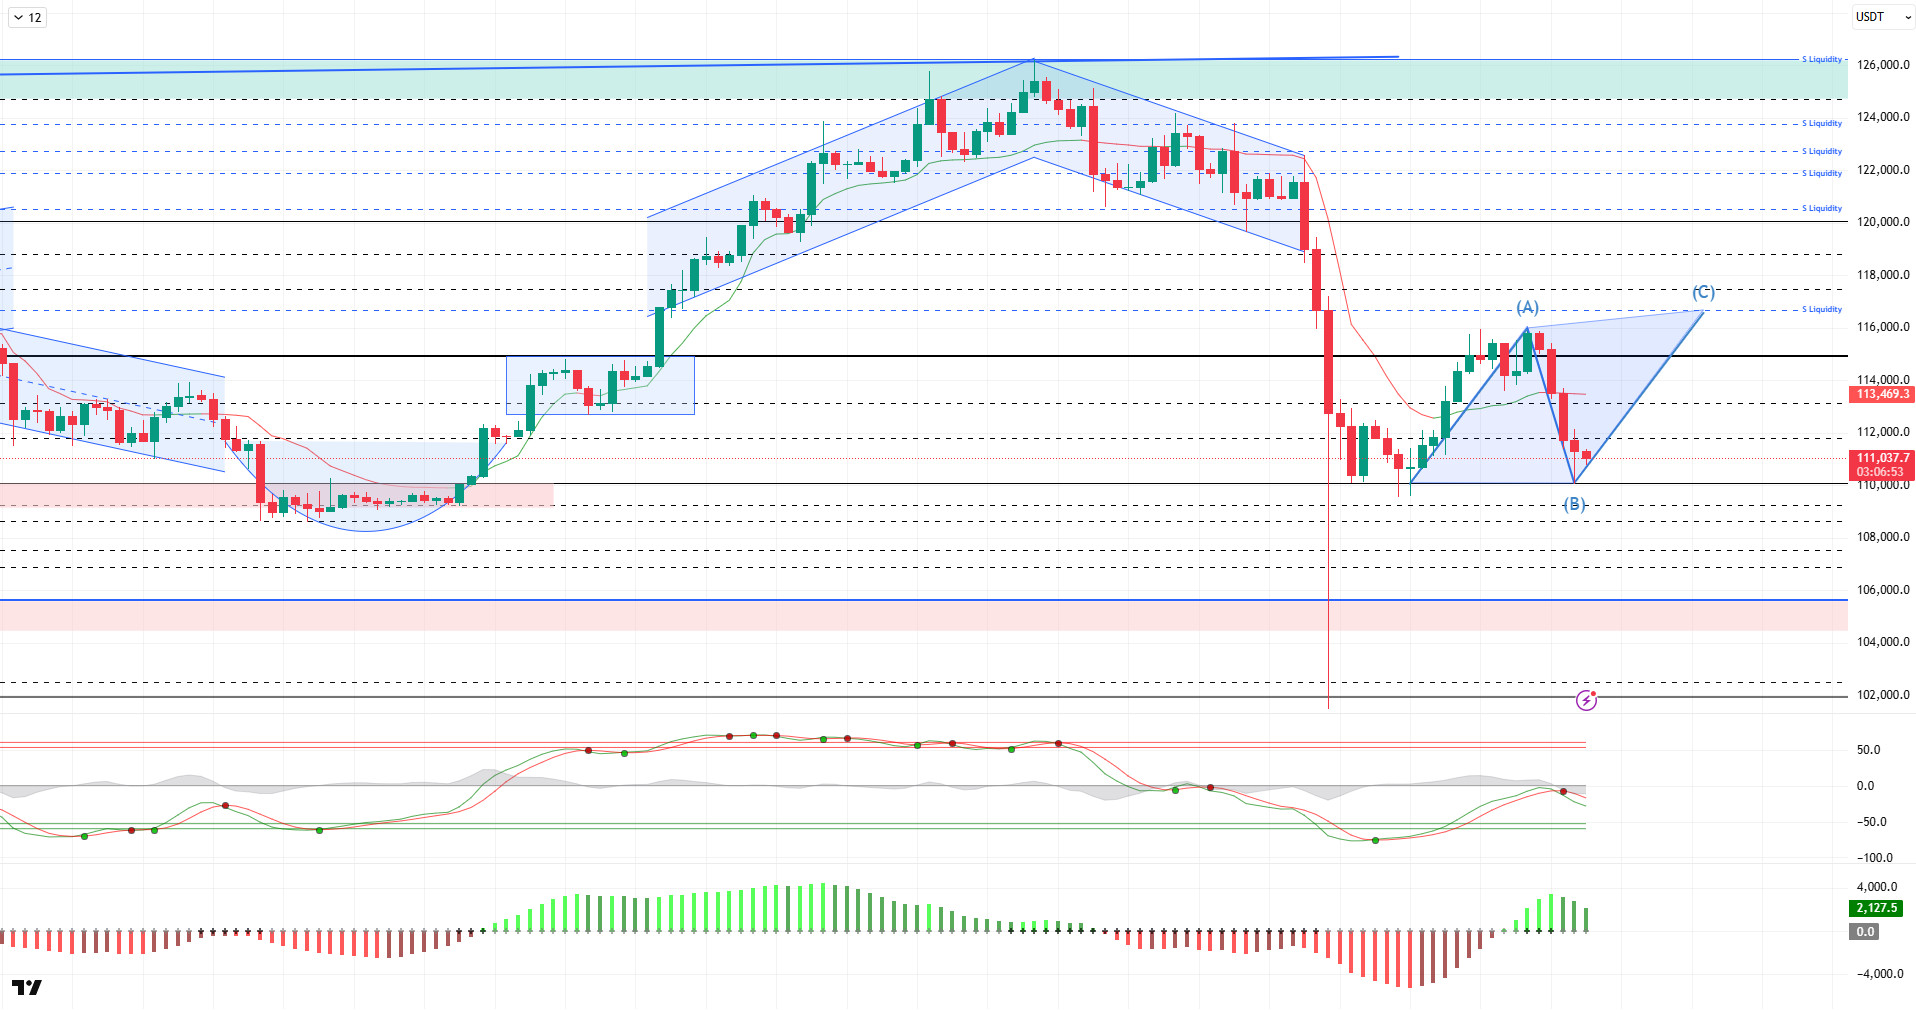
From a technical perspective, BTC continued its bearish trend during the day, forming a bottom at the 110,000 level. After the movement seen in the previous candle remained a spike, the price recovered to the 111,300 level. The cup formation observed in the price structure became invalid with the second bottom, while the ABC structure that formed is noteworthy. Within this structure, if the price peaks again, point C will be the critical tracking level. At the time of writing, BTC continues to trade at the 110,800 level.
Technical indicators, the Wave Trend (WT) oscillator, continue to maintain a sell signal in the middle band of the channel following a short-term trend reversal. In the Squeeze Momentum (SM) indicator, the histogram is seen to be weakening after short-term momentum support. The Kaufman Moving Average (KAMA) is currently at $113,400, confirming the decline by positioning above the price.
Looking at liquidation data, trades opened at the 110,500 level resulted in liquidation following the recent decline. The next buy level is open at $109,500. Sell-side trades are concentrated at the short-term level of $116,300, while long-term trades continue to increase above the $120,000 level.
In summary, the rise in BTC on the fundamental side is supported by increased institutional demand driven by ETFs, expectations of Fed interest rate cuts, a growing positive correlation with gold, and October’s historically strong cyclical structure. However, Trump’s new tariff threat against China weakened global risk appetite, creating selling pressure on markets in the short term. Technically, BTC reached saturation point by testing its all-time high (ATH) at $126,198. After this level, liquidity data became the main factor triggering a price correction. After a sharp sell-off, BTC recovered somewhat but failed to hold above the $115,000 level and faced renewed selling pressure, falling back to the $110,000 level. After this stage, it is critically important for the price not to lose the 110,000 level for a new upward movement. In this regard, we will monitor the 111,500 resistance support level, and if demand arises from here, we will follow the 115,000 reference zone and then the liquidity area.
Supports: 110,000 – 109,000 –107,600
Resistances: 111,500 –113,000 –115,000
ETH/USDT
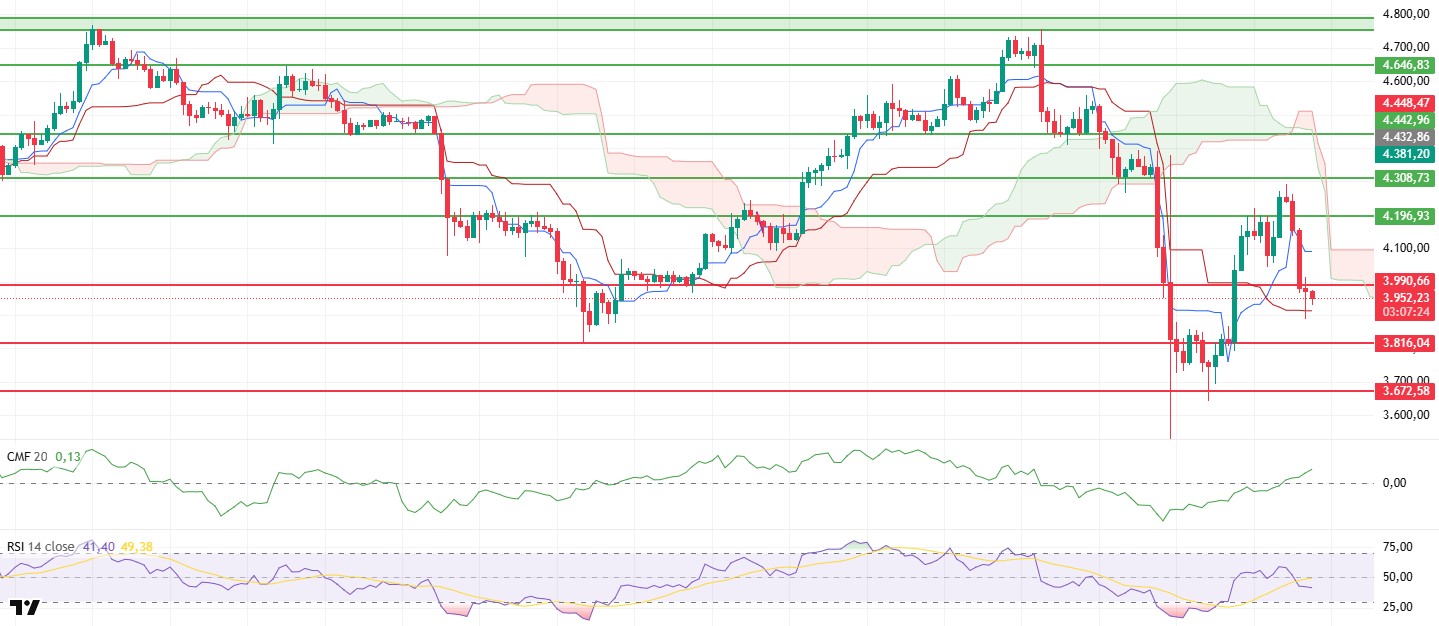
After losing its support at $3,990, the ETH price fell to $3,888 amid increased selling pressure during the day. A limited recovery was observed as buyers re-entered the market in this region. However, the price’s weak performance in the short term indicates that buying momentum has not yet gained strength. This movement throughout the day reveals that the market is struggling to hold above the $3,990 level and that selling pressure persists.
The Chaikin Money Flow (CMF) indicator remains in positive territory. This suggests that capital outflows are limited and active buyers are still present in the market. The preservation of liquidity stands out as one of the key factors preventing the decline from deepening at this stage.
The Relative Strength Index (RSI) indicator continues its decline, settling below the 50 level. This pattern indicates that the price is gaining downward momentum and that short-term recovery attempts may remain weak.
Looking at the Ichimoku indicator, the price still trading above the Kijun level and the Tenkan level remaining above the Kijun indicates that the positive structure in the overall outlook is maintained. However, the price continuing to stay below $3,990 could cause this positive structure to weaken.
Consequently, if the price fails to regain the $3,990 level, the decline may continue, testing the $3,816 level. A return above the $3,990 level, on the other hand, could strengthen buyers and support positive momentum.
Supports: 3,816 – 3,672 – 3,441
Resistances: 3,990 – 4,196 – 4,308
XRP/USDT
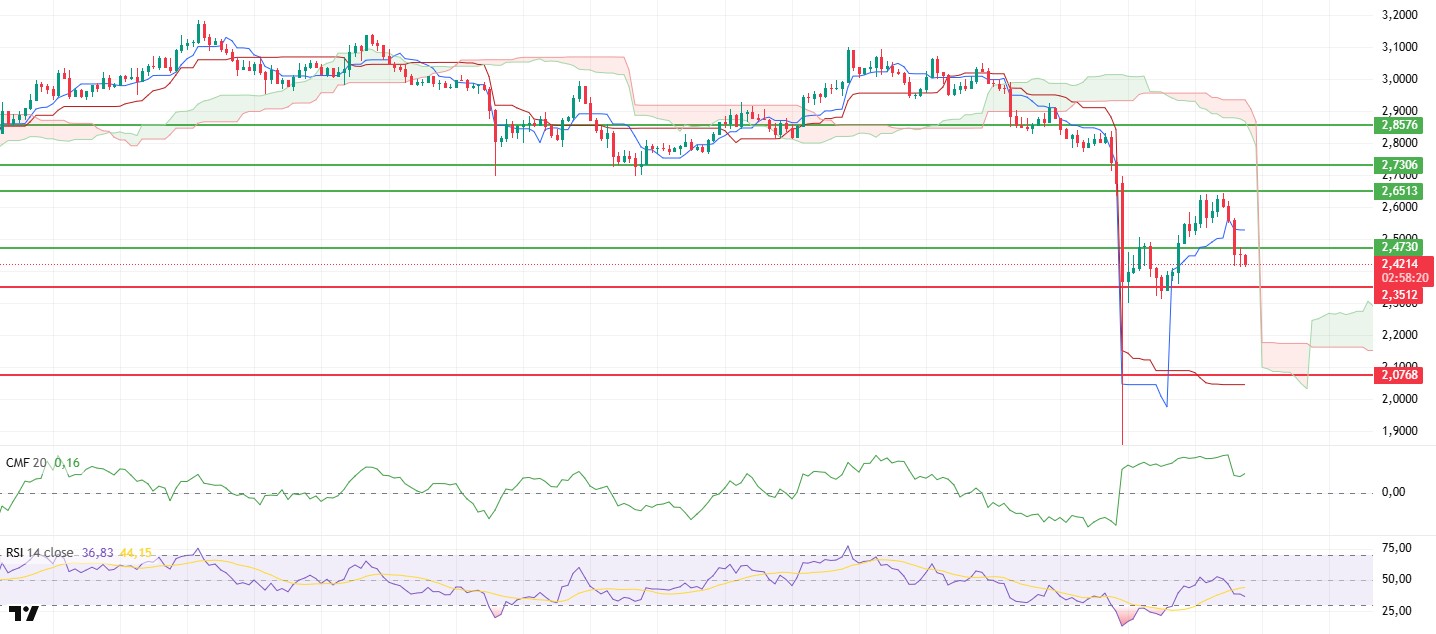
After losing its support at $2.47, the XRP price continued to decline throughout the day, falling to the $2.42 level. This weak performance during the day indicates that the market has lost its buying momentum and that selling pressure has come to the fore in the short term. The price remaining below the $2.47 level reveals that buyers have weakened and that the market has become more fragile.
The Chaikin Money Flow (CMF) indicator remains in positive territory but has turned downward. This suggests that liquidity outflows have begun in the market and capital inflows have weakened. The loss of buyer strength may make it difficult for upward attempts to sustain themselves.
The Relative Strength Index (RSI) indicator remains below the 50 level, confirming the continuation of weak momentum. This loss of strength in momentum indicators signals a reduced likelihood of a short-term recovery.
In the Ichimoku indicator, the price is still above the Kijun level, and the Tenkan level also remains above the Kijun. This structure indicates that the overall positive outlook is maintained, but the decline in momentum has begun to threaten this outlook.
Consequently, if the XRP price fails to rise above the $2.47 level again, the possibility of a deeper decline and a pullback towards the $2.40 region may increase. Regaining the $2.47 level, on the other hand, could pave the way for a short-term recovery.
Supports: 2.3512 – 2.2100 – 2.0768
Resistances: 2.7306 – 2.6513 – 2.7306
SOL/USDT
The Solana Foundation partnered with Korean blockchain infrastructure company Wavebridge to collaborate on creating a “compliance-ready” KRW-pegged stablecoin.
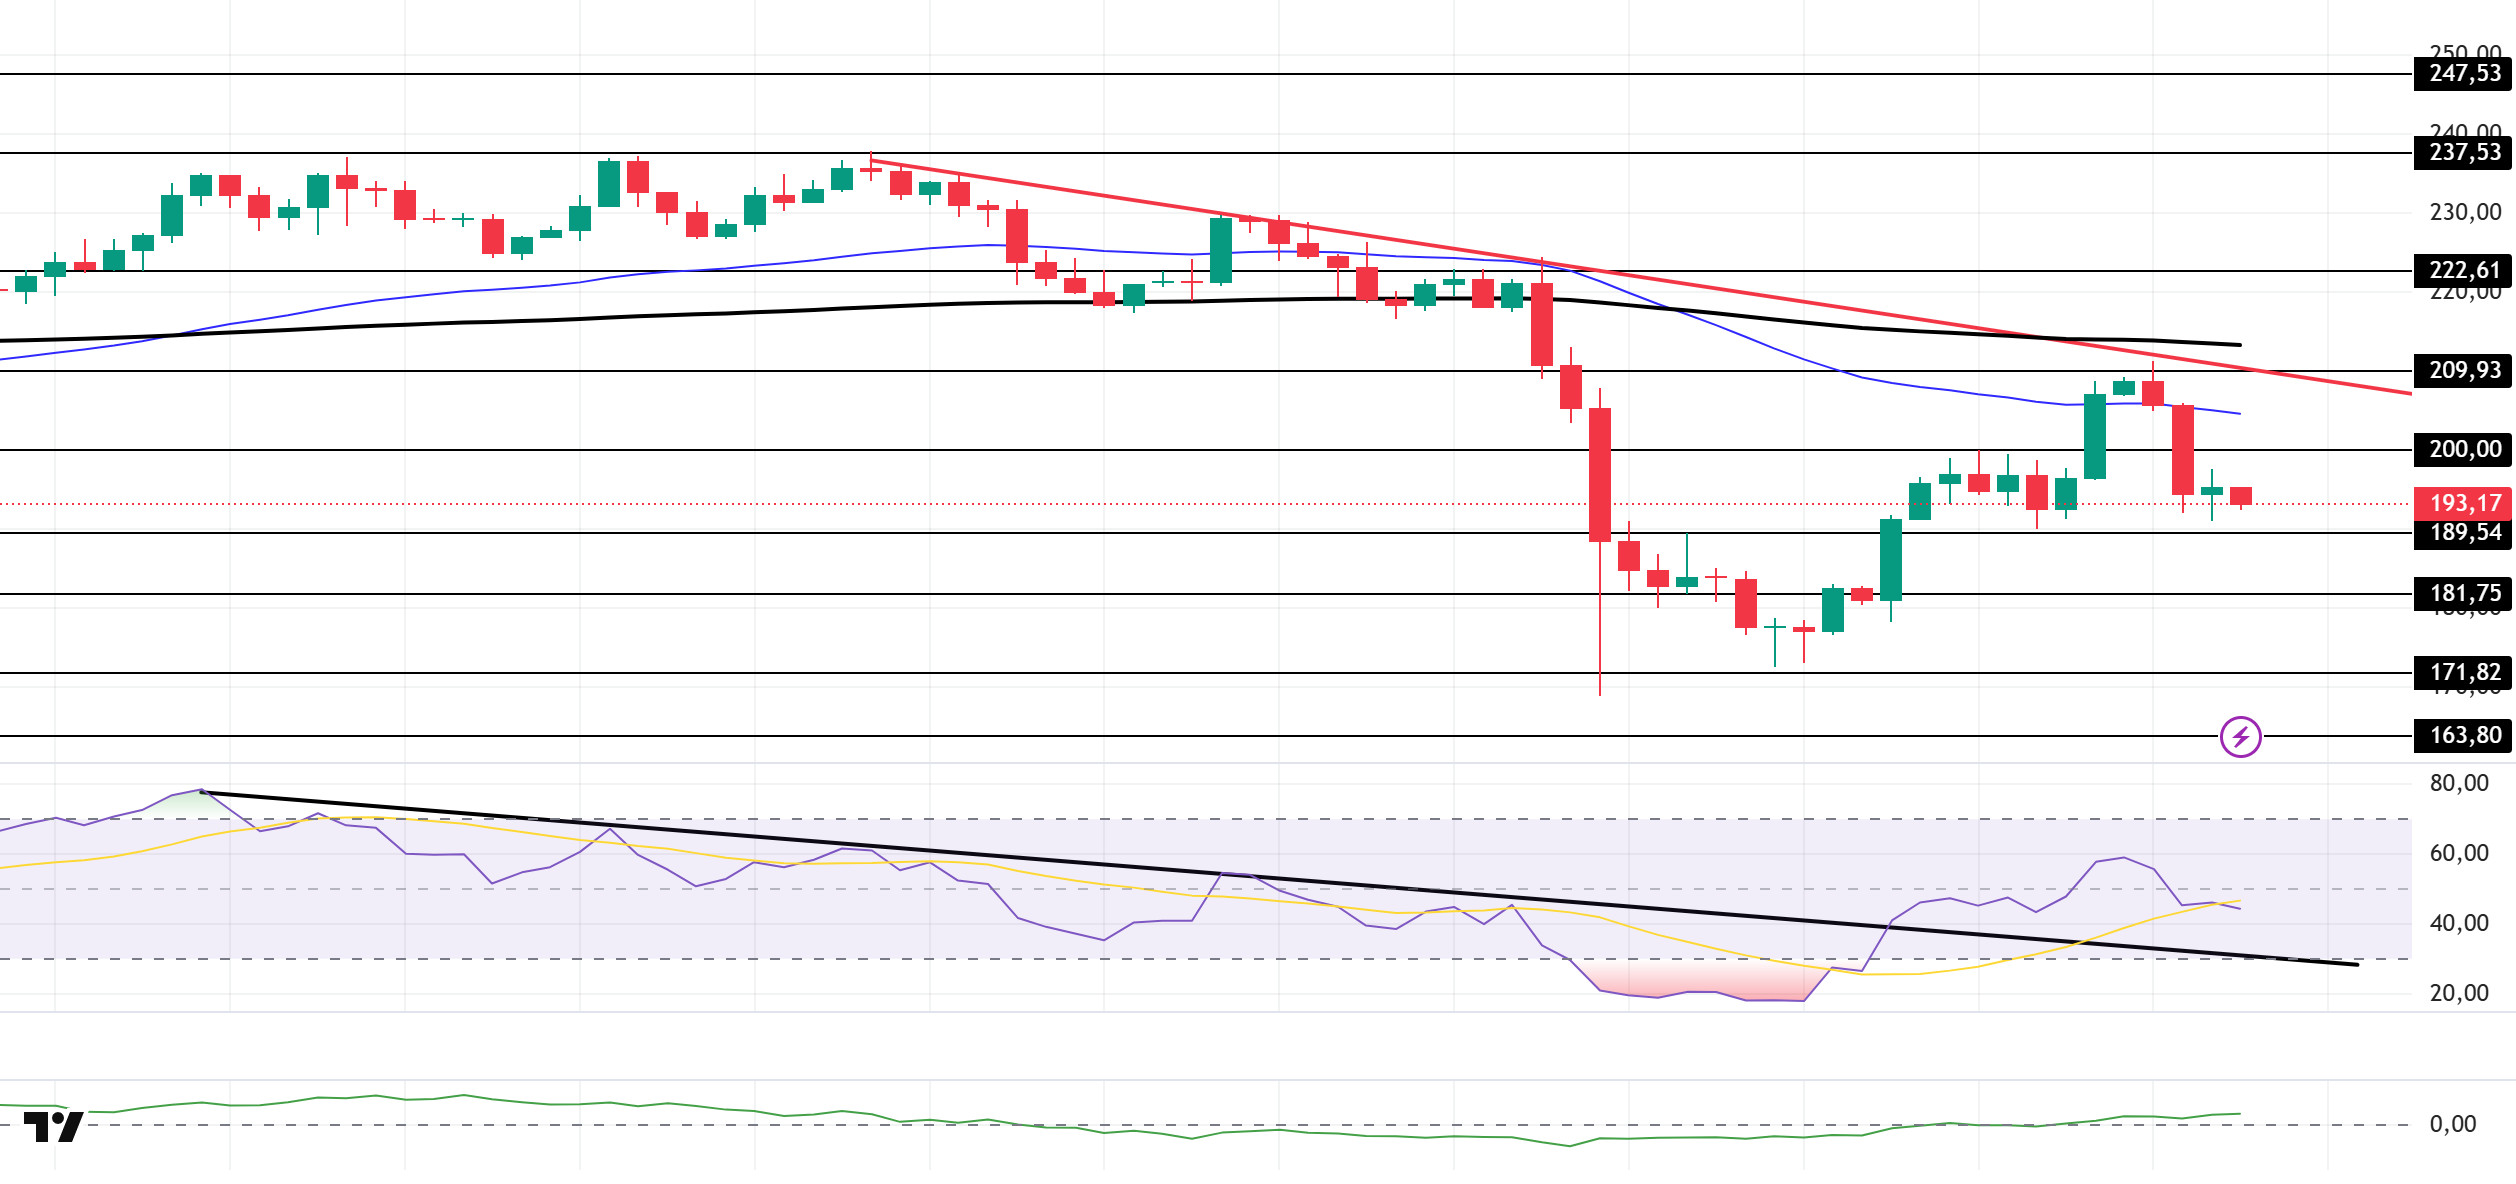
The SOL price showed a slight decline during the day. The asset continues to be in the lower region of the downward trend that began on October 6. Testing the downward trend as resistance, the price failed to break through and experienced a pullback, breaking through the strong support level of $200.00 and deepening its decline. Above the $200.00 level, it could test the downward trend line and the 200 EMA (Black Line) moving average on candle closes. If the pullback continues, it could test the $189.54 level as support.
On the 4-hour chart, it remained below the 50 EMA (Exponential Moving Average – Blue Line) and 200 EMA (Black Line). This indicates that it may be in a downtrend in the medium term. At the same time, the price being below both moving averages shows us that the asset is in a downtrend in the short term. The Chaikin Money Flow (CMF-20) has moved into positive territory. However, a decrease in money inflows could push the CMF into negative territory. The Relative Strength Index (RSI-14) broke above the downward trend that began on October 2. This upward breakout could create upward pressure. In the event of an uptrend driven by macroeconomic data or positive news related to the Solana ecosystem, the $209.93 level stands out as a strong resistance point. If this level is broken upward, the uptrend is expected to continue. In the event of pullbacks due to developments in the opposite direction or profit-taking, the $181.75 level may be tested. A decline to these support levels could increase buying momentum, presenting a potential opportunity for an upward move.
Supports: 189.54 – 181.75 – 171.82
Resistances: 200.00 – 209.93 – 222.61
DOGE/USDT
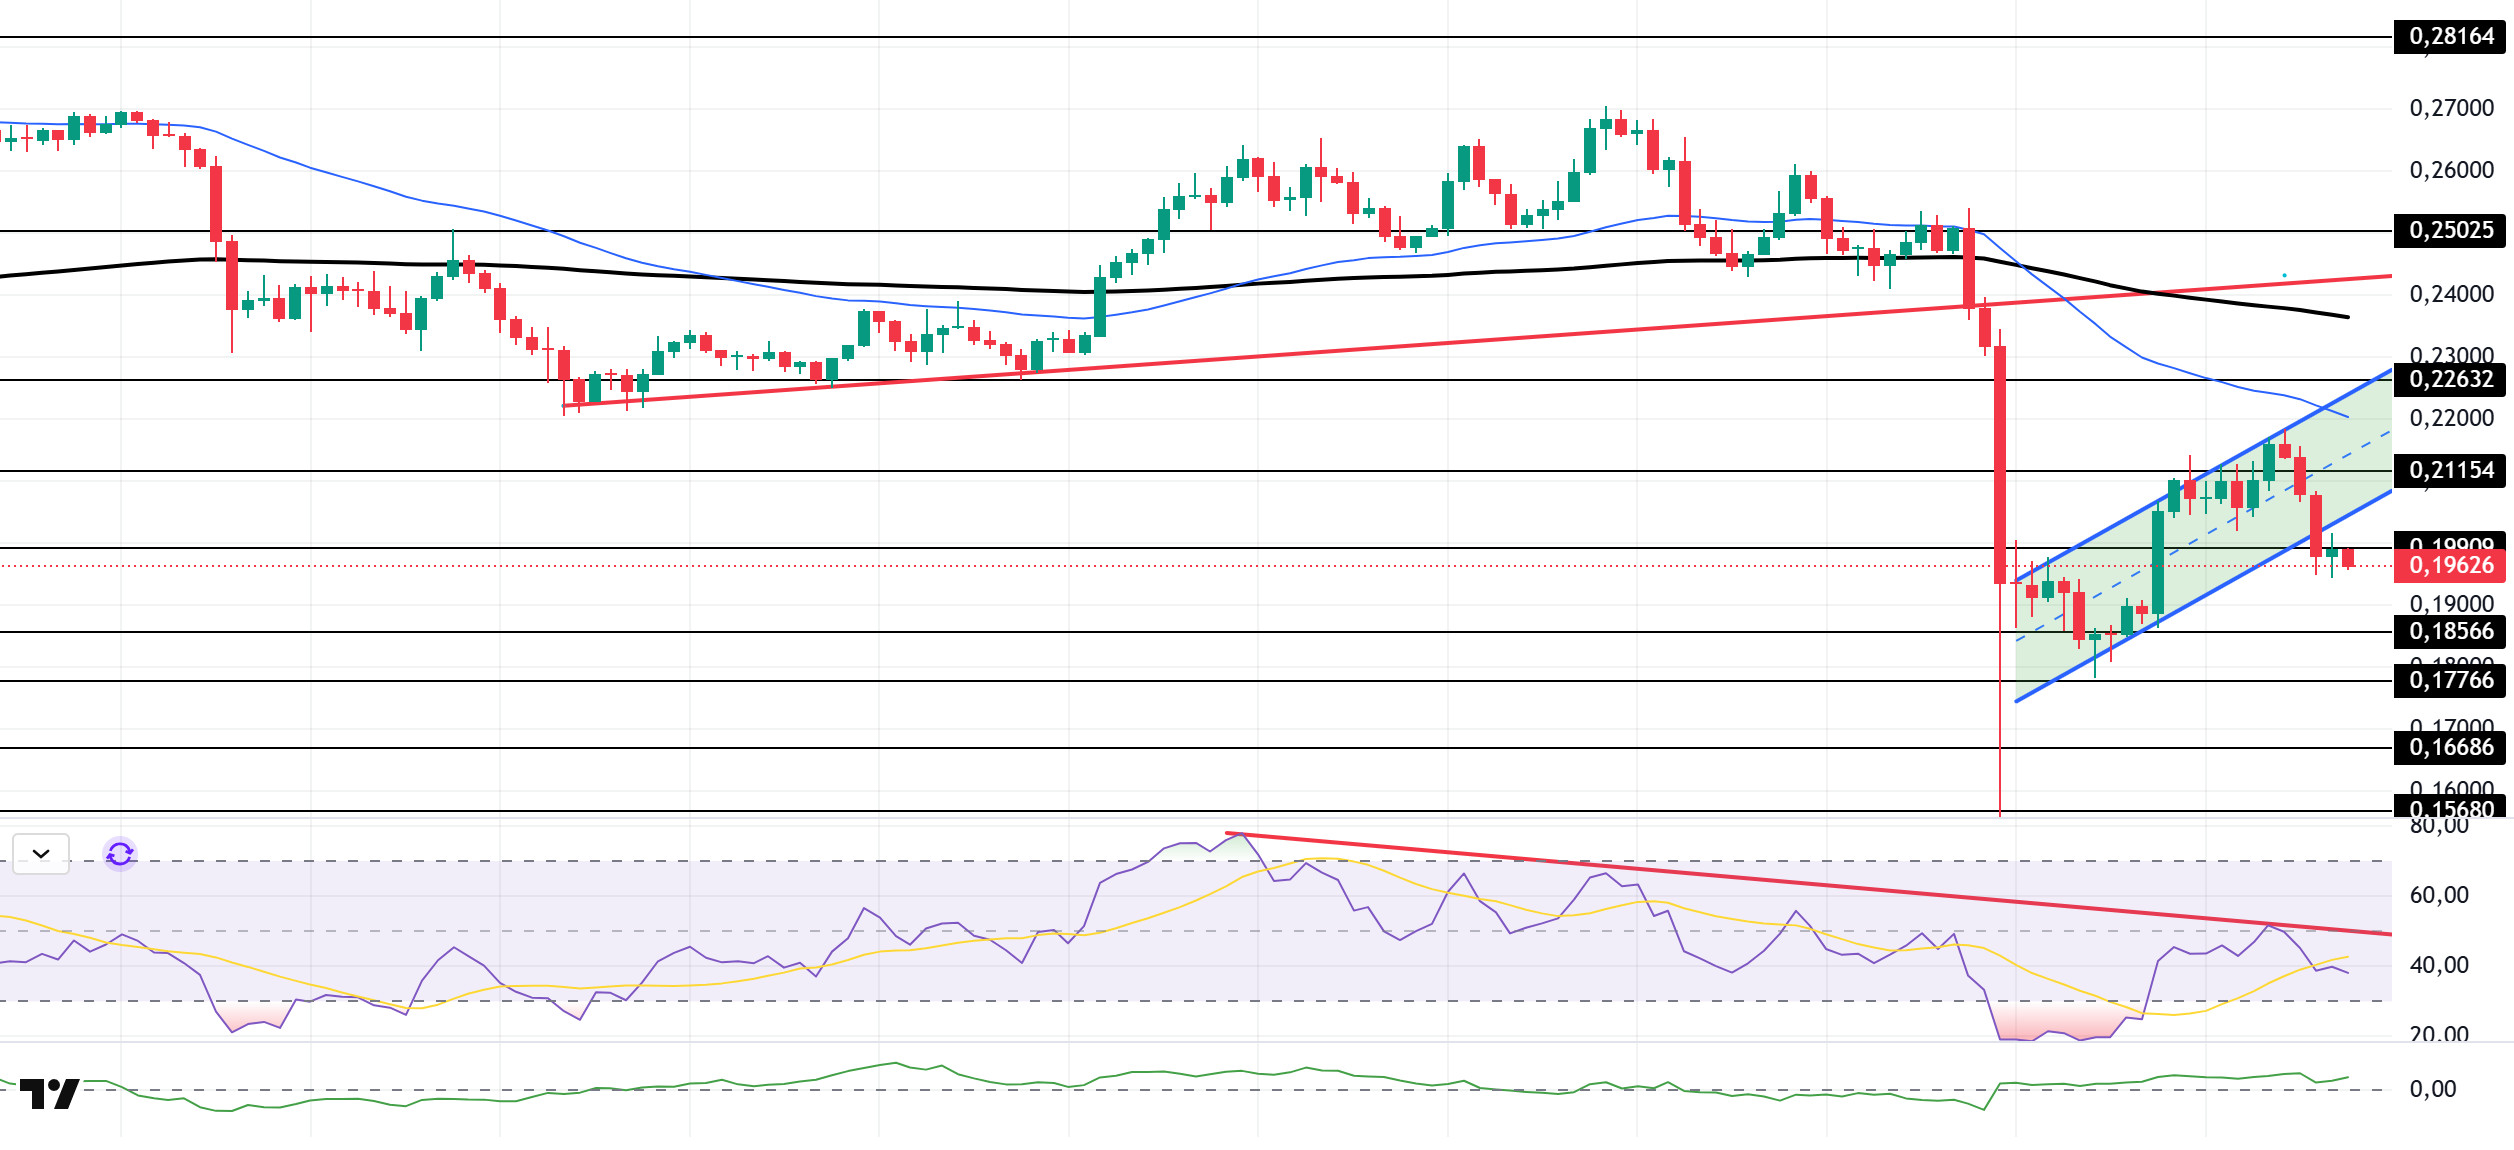
The DOGE price experienced a pullback during the day. The asset continues to trade in the lower region of the upward trend that began on September 25. Currently testing the strong resistance level of $0.19909, the price broke down from the falling flag formation. This could deepen the pullback. If it rallies, the flag formation’s ceiling level should be monitored.
On the 4-hour chart, the 50 EMA (Exponential Moving Average – Blue Line) remained below the 200 EMA (Black Line). This indicates that a downtrend may begin in the medium term. The price being below both moving averages shows that the price is trending downward in the short term. The Chaikin Money Flow (CMF-20) experienced a slight rise towards the positive zone. Additionally, a decrease in money inflows could push the CMF into negative territory. The Relative Strength Index (RSI-14) tested the resistance line that began on October 2 but failed to break through, remaining below the line and in the middle of the negative zone. This signaled that selling pressure continues. In the event of a potential uptrend driven by political developments, macroeconomic data, or positive news flow within the DOGE ecosystem, the $0.21154 level stands out as a strong resistance zone. Conversely, in the event of negative news flow, the $0.18566 level could be triggered. A decline to these levels could increase momentum and initiate a new wave of growth.
Supports: 0.18566 – 0.17766 – 0.16686
Resistances: 0.19909 – 0.21154 – 0.22632
LTC/USDT
LTC ended the day down 7.33% against USDT and lost 4.05% against Bitcoin. On the futures side, the long/short position ratio of 0.84 opened in the last 24 hours indicates that the downward trend in the expectations of derivatives market participants continues. Funding rates remain negative-neutral. This picture shows that the decline seen in the derivatives markets in the first half of the day is expected to continue in the second half.
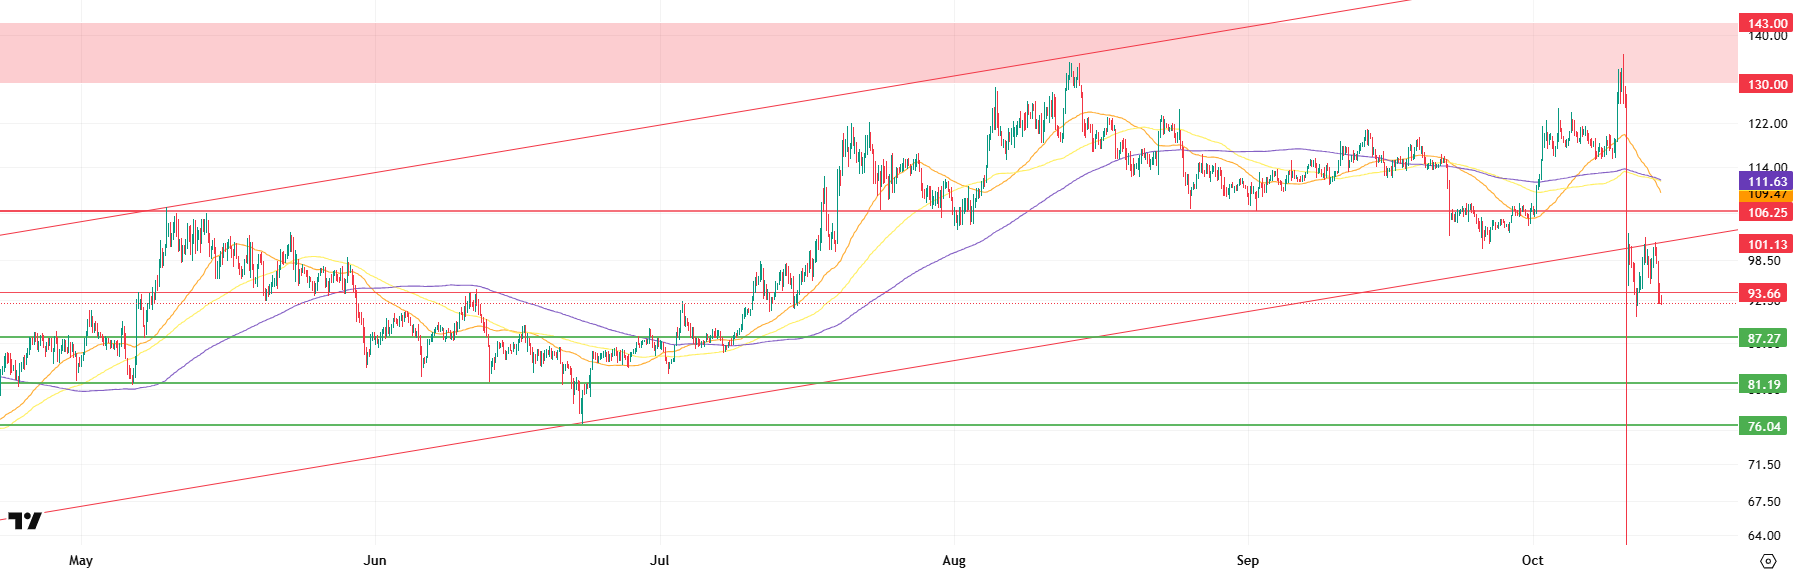
From a technical perspective, pricing continuing below all moving averages and the rising trend, along with the prevalence of short positions in the derivatives market, continues to support expectations of a decline, although upside potential certainly exists. If the unlikely scenario of an upturn occurs, the first point where selling pressure could be encountered is our old horizontal support level, currently at 93.66. Next, the rising channel’s lower band at 102.16 has the potential to act as a barrier that could halt the rise. Following that, the horizontal resistance at 106.25, reinforced by the moving averages (orange, yellow, and purple lines) approaching it, emerges as a level that continues to strengthen during this process.
In pullback movements that meet the general expectations of derivatives market investors, it may be possible to close or reduce short positions at the 87.27 price level, which could serve as an initial support point. If the price falls below this level, the decline is likely to accelerate, and the probability of the price retreating to 81.19 will increase. A move below 81.19 could be a threshold that brings thoughts of the market beginning to shape its medium-term trend in favor of bears, rather than a correction. In the event of a possible lack of reaction or insufficient reaction, the decline continues, and the 76.04 level can be used as a support zone.
Supports: 87.27 – 81.19 – 76.04
Resistances: 93.66 – 102.16 – 106.25
SUI/USDT
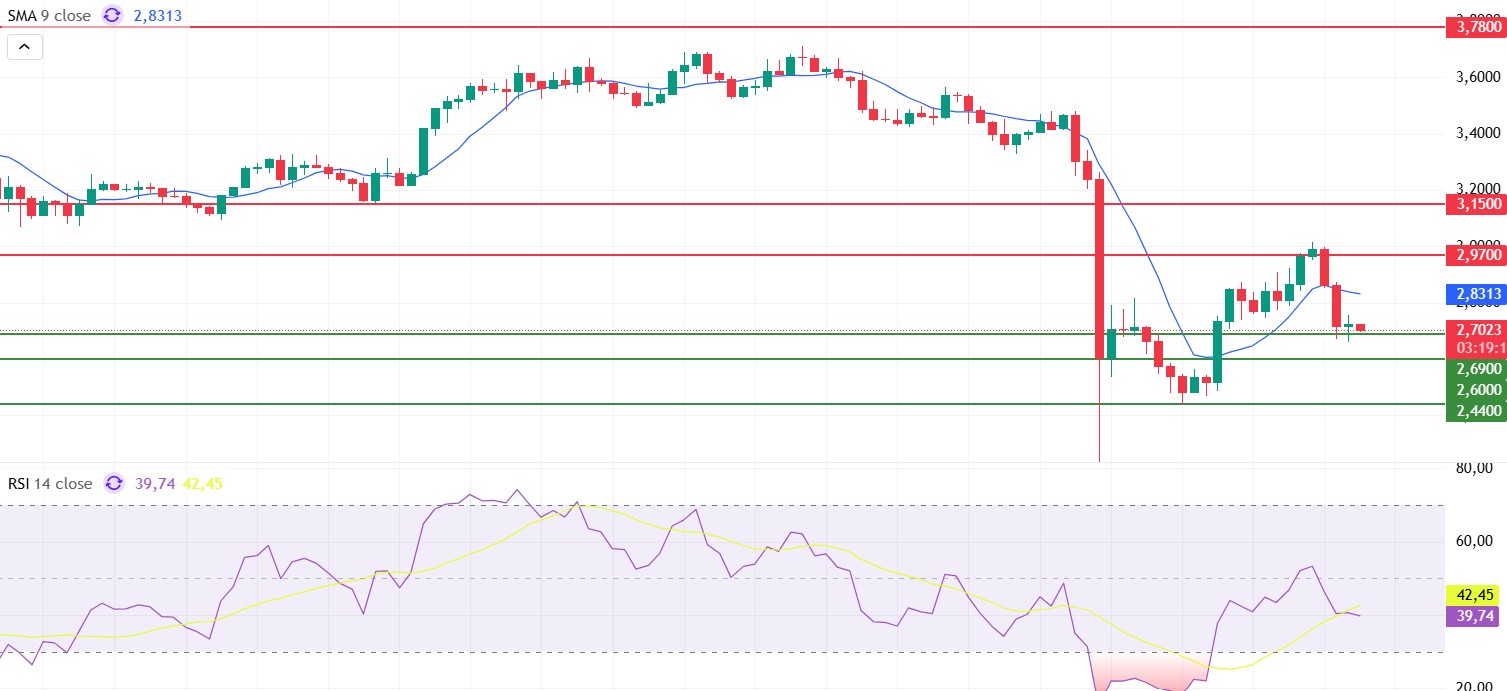
Looking at Sui’s technical outlook, we see that the price has declined to around $2.70 on the 4-hour chart, influenced by fundamental developments. The Relative Strength Index (RSI) is currently in the 39.74 – 42.45 range. This range indicates that the market is trending in the buying zone; however, if the RSI falls to the 35.00 – 45.00 range or below, it could signal a potential buying point. If the price moves upward, the $2.97 – $3.15 – $3.78 levels can be monitored as resistance points. However, if the price falls to new lows, it may indicate that selling pressure could deepen. In this case, the $2.69 and $2.60 levels stand out as strong support zones. In particular, in the event of a sharp sell-off, a pullback to $2.44 appears technically possible.
According to Simple Moving Averages (SMA) data, Sui’s average price is currently at the $2.83 level. The price remaining below this level indicates that the current uptrend may not continue technically.
Supports: 2.44 – 2.60 – 2.69
Resistances: 2.97 – 3.15 – 3.78
Legal Notice
The investment information, comments, and recommendations contained herein do not constitute investment advice. Investment advisory services are provided individually by authorized institutions taking into account the risk and return preferences of individuals. The comments and recommendations contained herein are of a general nature. These recommendations may not be suitable for your financial situation and risk and return preferences. Therefore, making an investment decision based solely on the information contained herein may not produce results in line with your expectations.

