
Technical Analysis
BTC/USDT
US monetary policy and Bitcoin are dominating the agenda. New York Fed President John Williams stated that the weakening labor market creates room for further interest rate cuts, while noting that the Trump administration’s new tariffs will have a temporary effect on inflation. A U.S. senator said the federal government’s Bitcoin reserve plan could be launched “at any moment” and that this step could push the price higher. On the institutional side, Japan’s Remixpoint’s BTC holdings reached 1,374.68, while the U.S.-based Exodus Movement’s Bitcoin reserves reached 2,123 BTC.
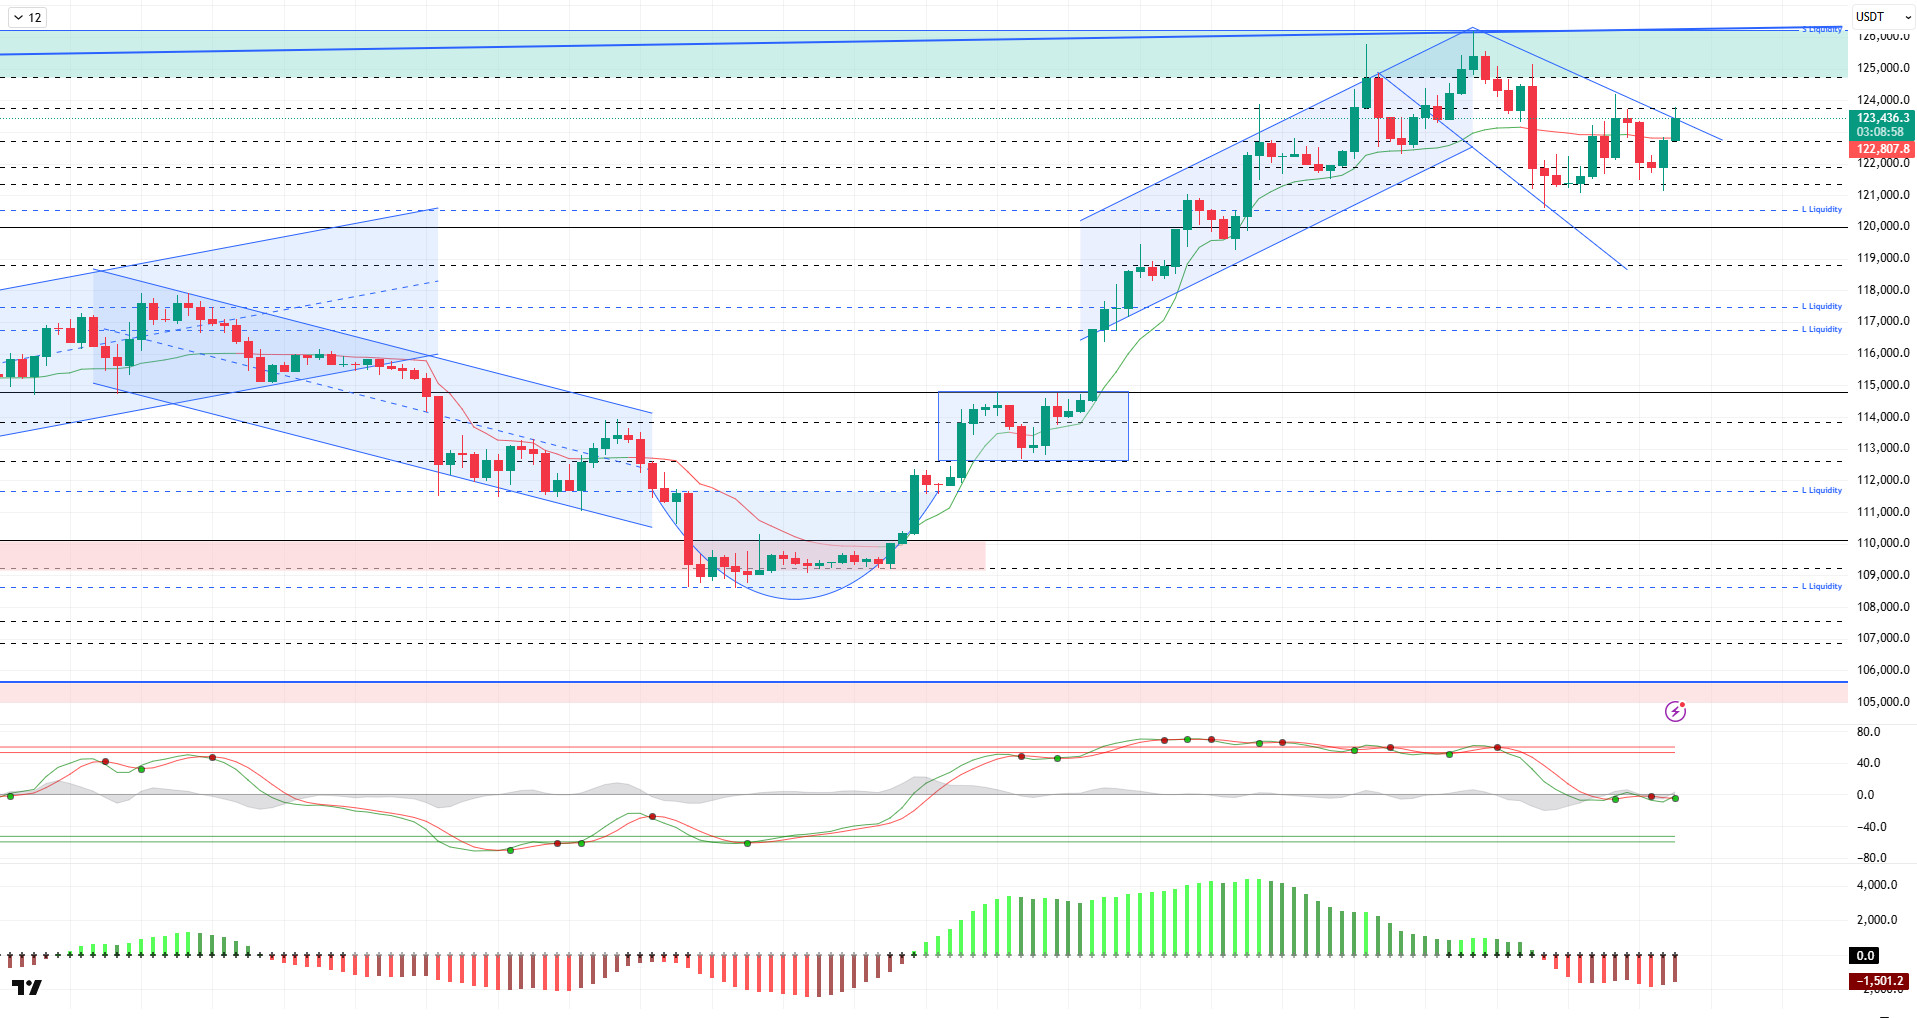
Looking at the technical picture, BTC broke its short-term uptrend after correcting following its second peak attempt at 126,198. While volatility has increased in BTC, which has formed a flag pattern close to its ATH level, it appears to be forcing futures positions to close. The price, which had fallen to the 121,100 level in the previous analysis, tested the 123,800 level. At the time of writing, it continues to trade at the 123,400 level.
Technical indicators show that the Wave Trend oscillator (WT) converted its short-term sell signal in the middle band of the channel into a buy signal. The Squeeze Momentum (SM) indicator’s histogram moved into negative territory with the latest decline. The Kaufman moving average is currently trading below the price at the 122,800 level.
Looking at liquidation data, the sell-off has started to reappear with the recent upward movement, and there has been heavy accumulation at the 126,400 level in the long term. Positions at the 122,500 – 122,900 levels in the short term were liquidated. In contrast, increased intensity at the 120,500 level, which is the buying level, is observed. Additionally, buying intensity continues at the 117,800 and 116,600 levels.
In summary, the rise in BTC on the fundamental side is supported by institutional demand for ETFs, the impact of expectations for Fed interest rate cuts, correlation with gold, and cyclical movements in October. The technical outlook reached saturation point with the price testing the 126,198 ATH level, while liquidity data was the factor driving the price correction. After this stage, if selling pressure deepens, 120,500 will be monitored as a critical reference area. A break below this level could push the price towards liquidity areas and deepen selling pressure. If the rise continues, 122,700 will be the resistance area.
Supports: 122,700 – 121,400 – 120,500
Resistances: 123,800 – 124,300 – 125,700
ETH/USDT
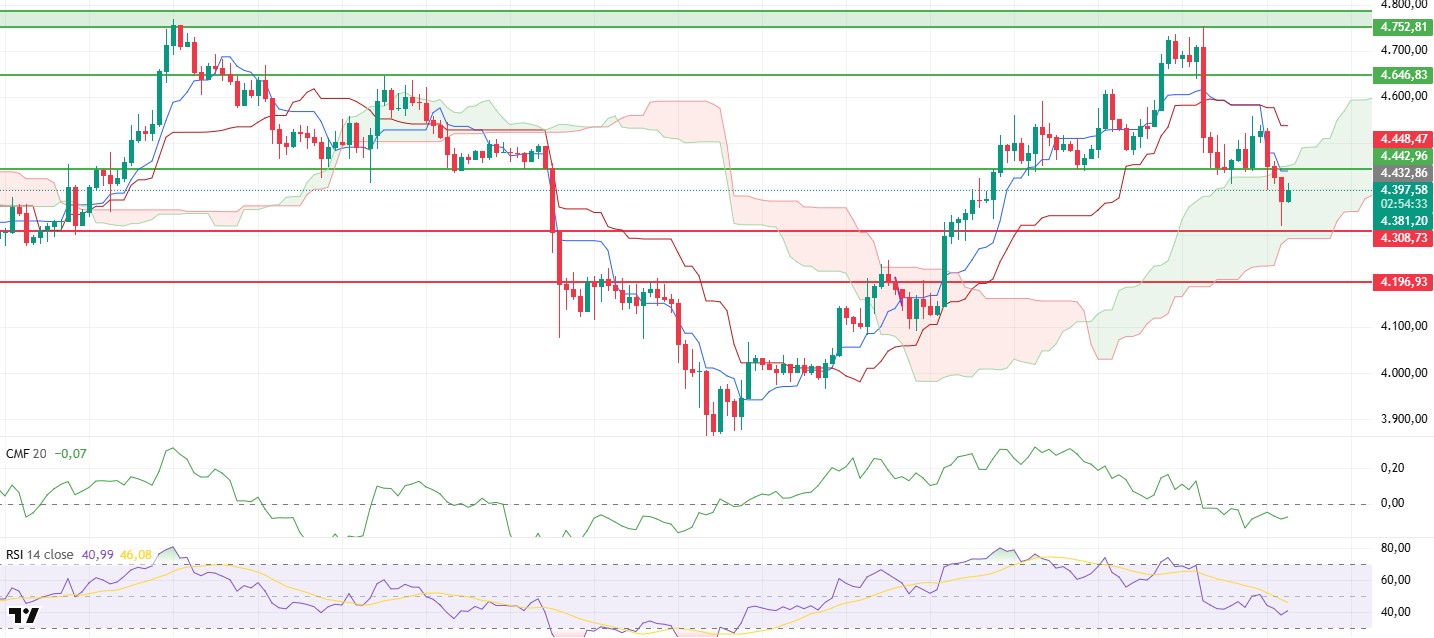
After losing the $4,442 level in the morning, the ETH price fell to the $4,308 support zone amid heavy selling. Buying pressure at this level pushed the price back up to the $4,400 level, creating a strong short-term rebound.
The Relative Strength Index (RSI) indicator entered a rapid upward trend with a rebound from the 39 level, indicating that buyers have regained control. Momentum gaining strength signals that a technically healthy ground has been laid for a new upward movement.
Although the Chaikin Money Flow (CMF) indicator showed a slight recovery, it remains in negative territory. This outlook reveals that sufficient liquidity inflows into the market have not yet begun, despite the price increase.
According to the Ichimoku indicator, the price continues to trade below the Tenkan and Kijun levels. Tenkan remaining below Kijun indicates that the short-term negative outlook may continue. However, the price being above the kumo cloud confirms that the overall trend still maintains its positive structure.
In the overall outlook, regaining the $4,442 level could increase the upward momentum. The $4,308 region is the main support level, and maintaining this level is critical for the continuation of the upward momentum.
Supports: 4,308 – 4,196 – 4,014
Resistances: 4,442 – 4,646 – 4,752
XRP/USDT
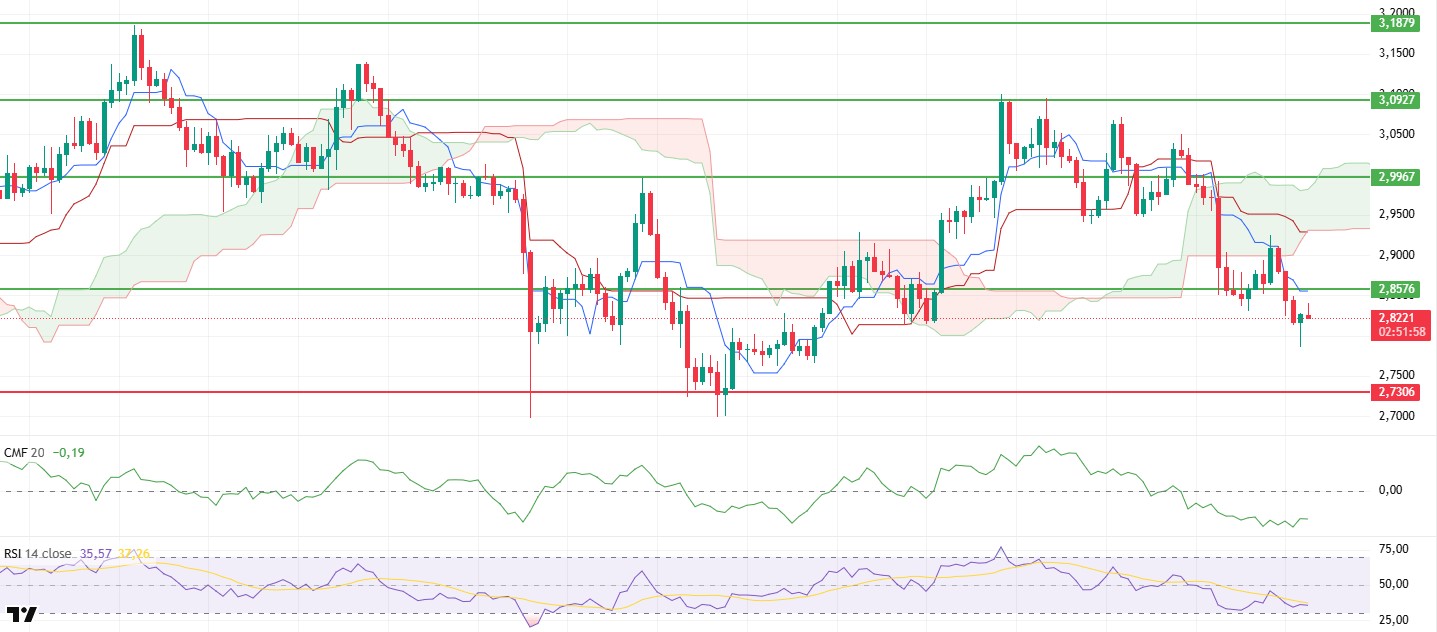
The XRP price fell to $2.78 during the day due to selling pressure. With limited buying at this point, the price rebounded slightly to $2.82. However, the weakness of this rise shows that buyers are still not effective in the market.
The Chaikin Money Flow (CMF) indicator continues to decline in negative territory, confirming that capital outflows from the market are continuing. The CMF’s persistence in this area suggests that upward recovery attempts will struggle to find support and that sellers still hold control.
The Relative Strength Index (RSI) indicator is showing weakness as it approaches oversold territory. Momentum remaining at such low levels indicates that buyers are reluctant to return to the market and that any potential reactions may be limited.
According to the Ichimoku indicator, the price remaining below the kumo cloud clearly shows that the overall trend has turned negative and sellers remain in control. The price trading below the Tenkan and Kijun levels also confirms that downward pressure will continue in the short term.
The overall outlook indicates that as long as the price fails to rise above the $2.8576 level, the risk of a pullback towards the $2.73 region remains. Conversely, if the price regains the $2.8576 level, it could signal a weakening of the downward momentum and the start of a limited recovery in the short term.
Supports: 2.7306 – 2.6513 – 2.4730
Resistances: 2.8576 – 2.9967 – 3.0927
SOL/USDT
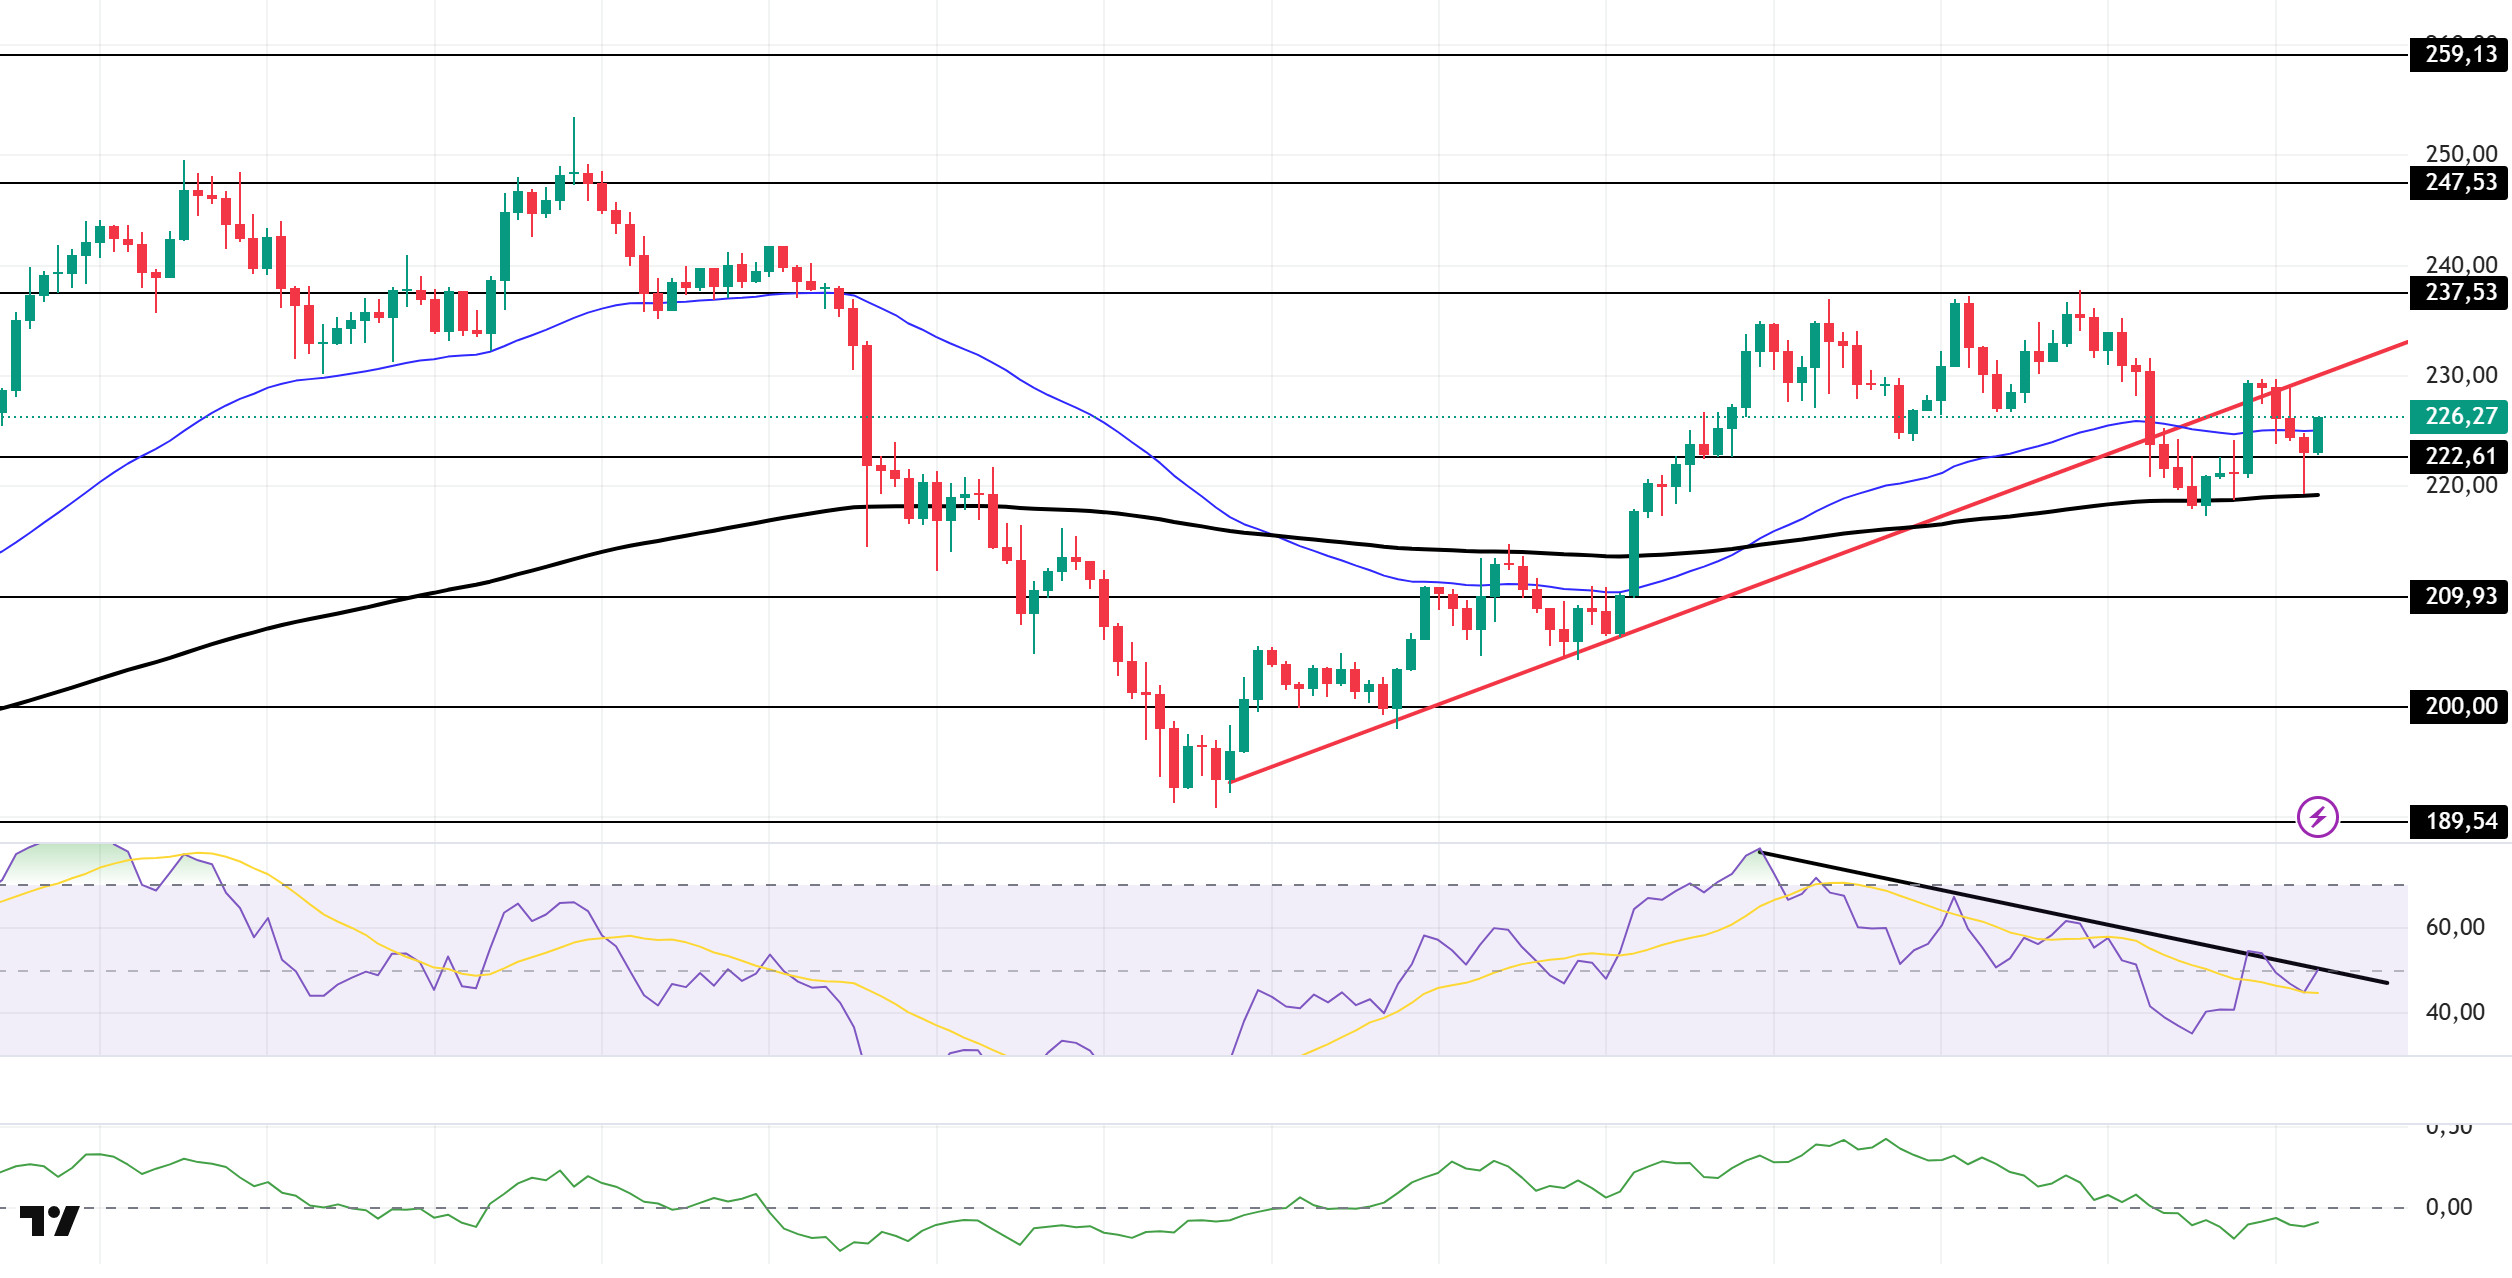
The SOL price experienced a slight decline. The asset continues to trade in the lower region of the upward trend that began on September 26. This could increase selling pressure. The price, which moved below the 50 EMA (Blue Line) moving average, rose slightly, supported by the strong support level of $222.61. If the rise continues, it may test the $237.53 level and the upward trend as resistance. If a pullback begins, the $209.93 level or the 200 EMA (Black Line) can be monitored.
On the 4-hour chart, it remained above the 50 EMA (Exponential Moving Average – Blue Line) and 200 EMA (Black Line). This indicates that it may be in an uptrend in the medium term. At the same time, the price being between the two moving averages shows us that the asset is in a decision phase in the short term. The Chaikin Money Flow (CMF-20) remained in negative territory. However, a decrease in money inflows could push the CMF deeper into negative territory. The Relative Strength Index (RSI-14) tested the resistance line that began on October 2 and failed to break through, retreating into negative territory. This could increase selling pressure. In the event of an uptrend driven by macroeconomic data or positive news related to the Solana ecosystem, the $237.53 level stands out as a strong resistance point. If this level is broken upwards, the uptrend is expected to continue. In the event of pullbacks due to developments in the opposite direction or profit-taking, the $209.93 level could be tested. A decline to these support levels could increase buying momentum, presenting a potential opportunity for an upward move.
Supports: 222.61 – 209.93 – 200.00
Resistances: 237.53 – 247.53 – 259.13
DOGE/USDT
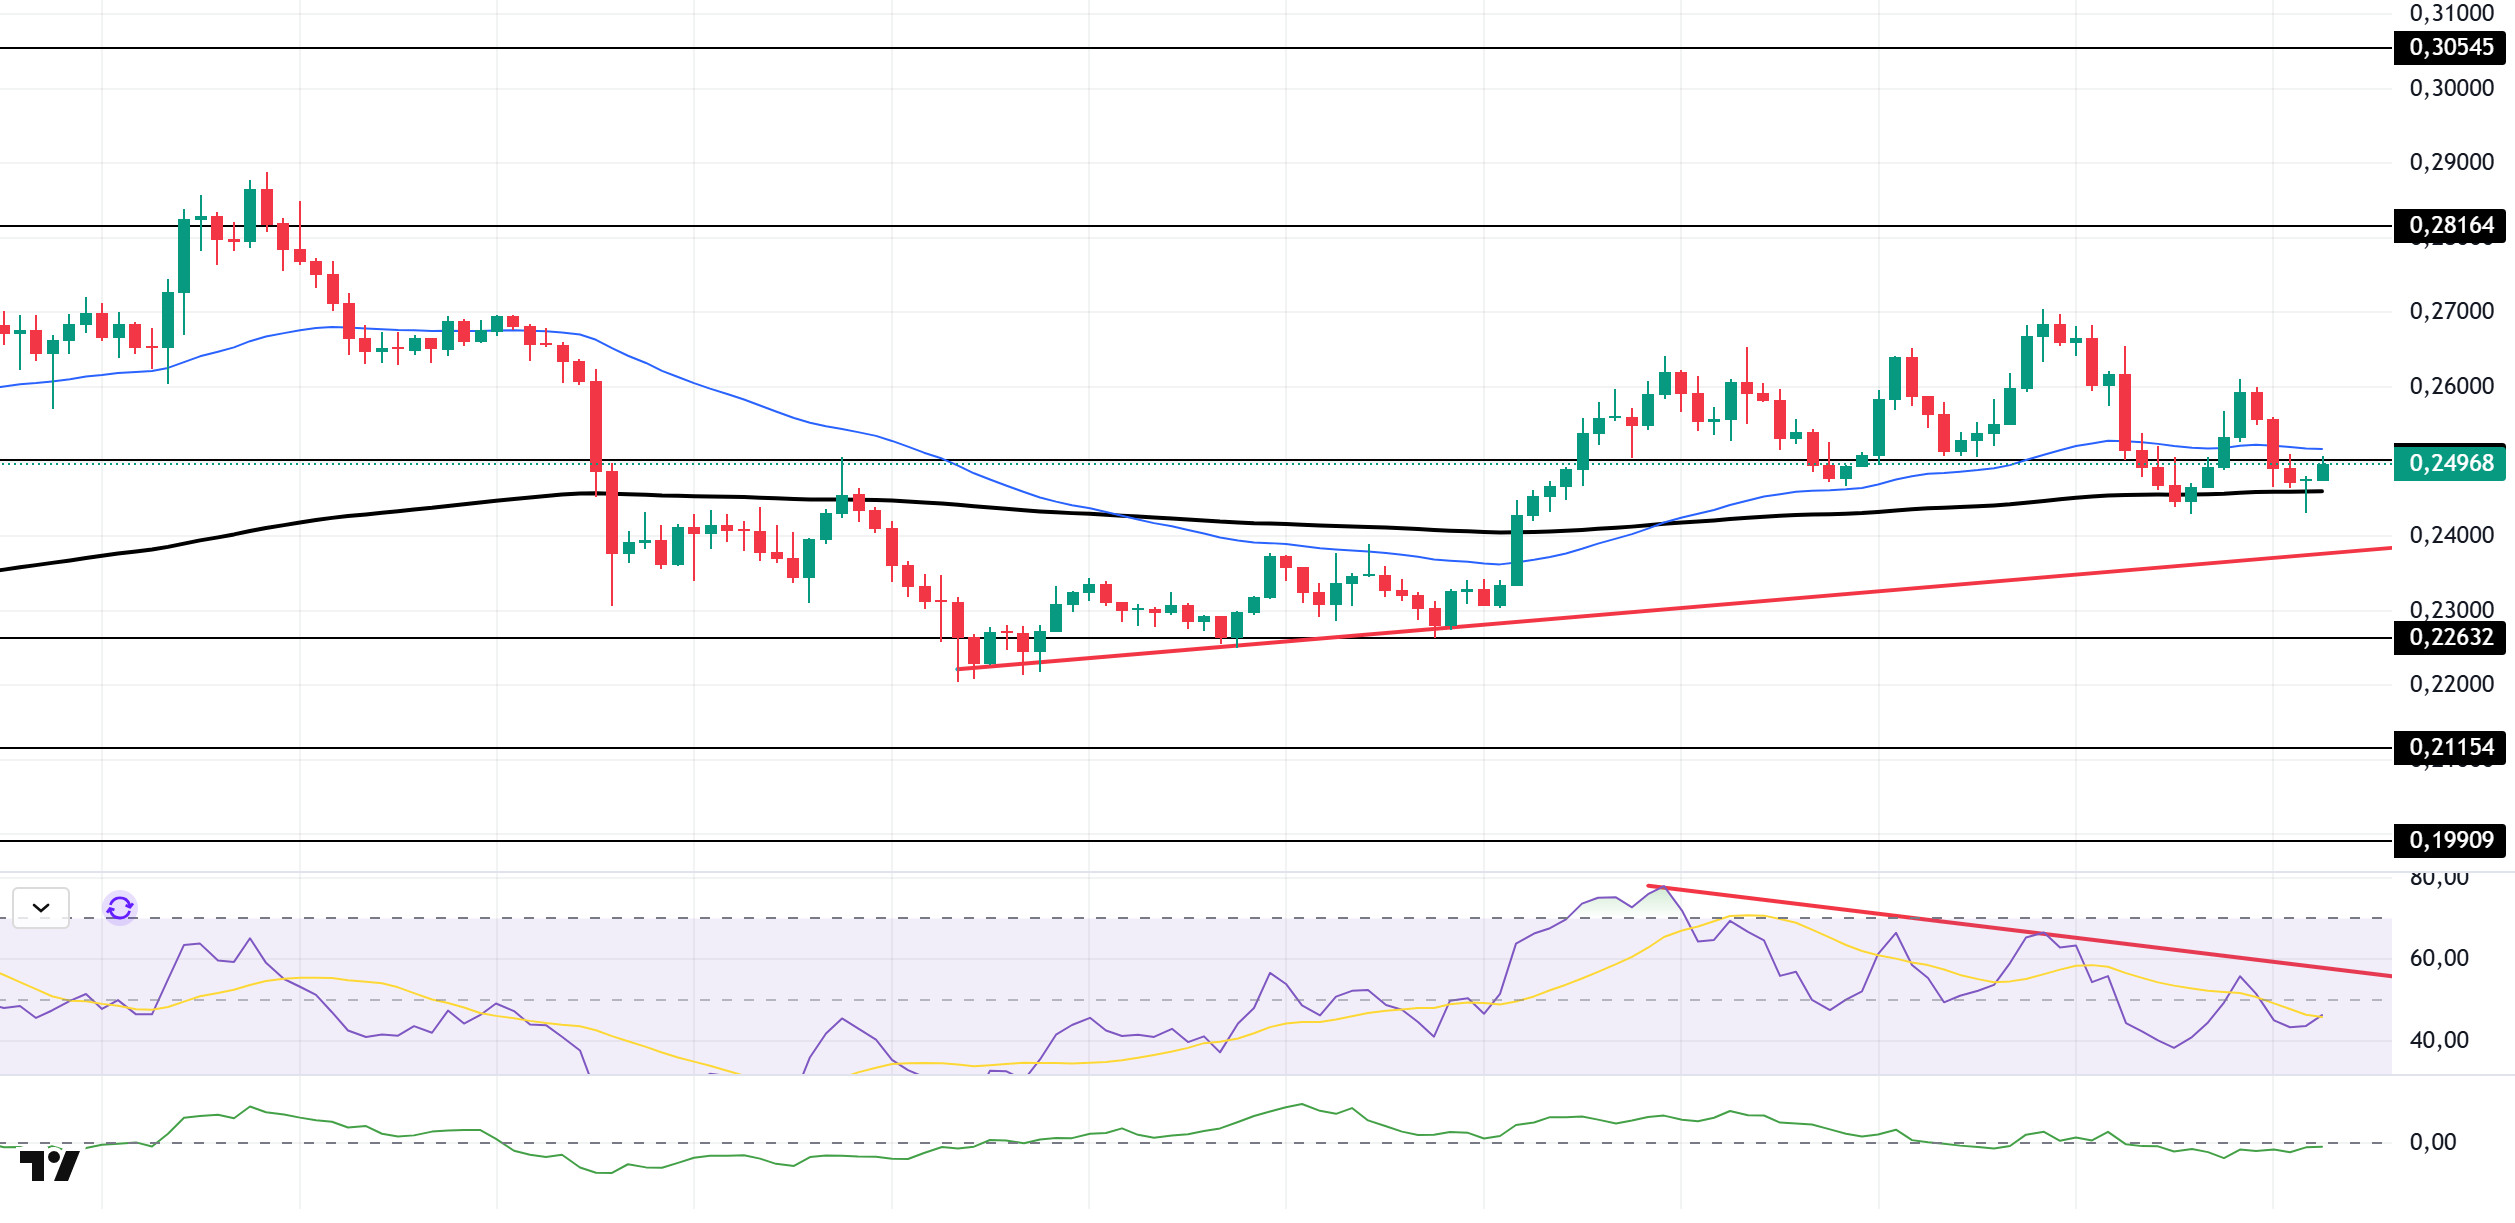
The DOGE price experienced a slight increase. The asset continues to trade above the upward trend that began on September 25. The price, supported by the 200 EMA (Black Line) moving average, is currently testing the strong resistance level of $0.25025. If the pullback continues and the candle closes below the moving average, it may test the $0.22632 level as support. If it experiences an uptrend, the $0.28164 level should be monitored.
On the 4-hour chart, the 50 EMA (Exponential Moving Average – Blue Line) remained above the 200 EMA (Black Line). This indicates that an uptrend may begin in the medium term. The price being between the two moving averages shows that the price is in a decision-making phase in the short term. The Chaikin Money Flow (CMF-20) experienced a slight rise towards the neutral level. Additionally, an increase in money inflows could push the CMF into positive territory. The Relative Strength Index (RSI-14) remained below the downward trend that began on October 2, continuing to stay in negative territory. This signaled that selling pressure persists. In the event of a rise due to political developments, macroeconomic data, or positive news flow in the DOGE ecosystem, the $0.28164 level stands out as a strong resistance zone. Conversely, in the event of negative news flow, the $0.22632 level could be triggered. A decline to these levels could increase momentum and potentially initiate a new upward wave.
Supports: $0.22632 – $0.21154 – $0.19909
Resistances: 0.25025 – 0.28164 – 0.30545
SUI/USDT
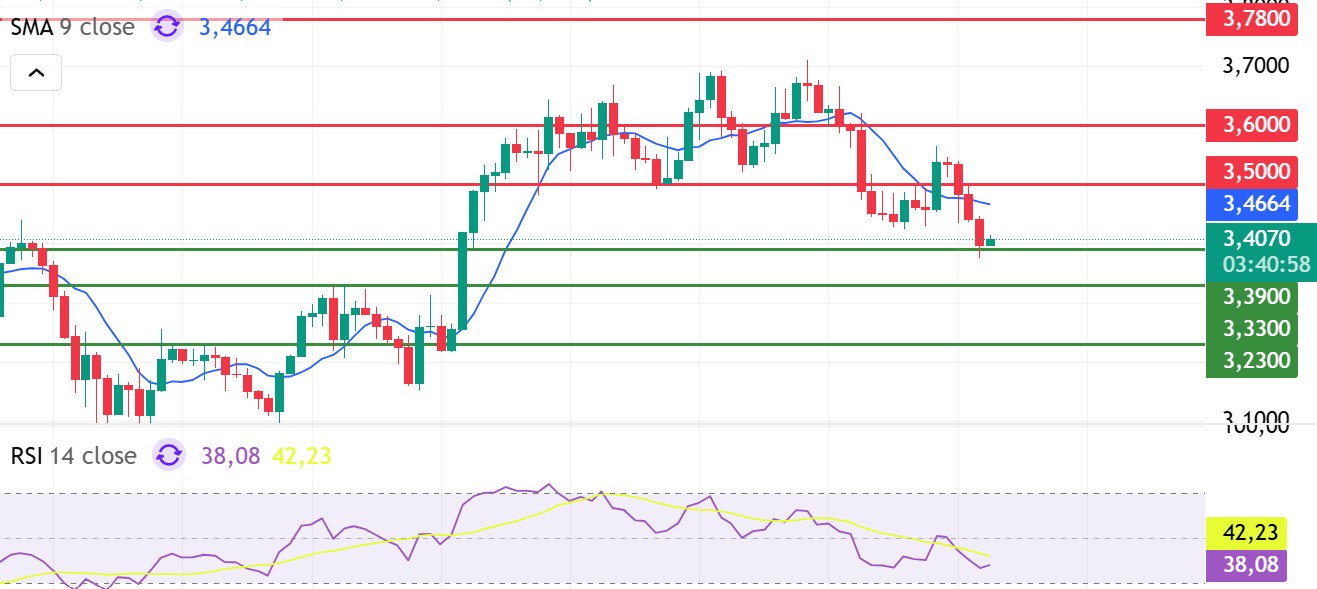
Looking at Sui’s technical outlook, we see that the price has fallen to the $3.40 level on the 4-hour chart, influenced by fundamental developments. The Relative Strength Index (RSI) is currently in the 42.23 – 38.08 range. This range indicates that the market is trading close to the buy zone; if the RSI falls to the 35.00 – 45.00 range, it could signal a potential buying point. If the price moves upward, the $3.50 – $3.60 – $3.78 levels can be monitored as resistance points. However, if the price falls to new lows, it may indicate that selling pressure could deepen. In this case, the $3.39 and $3.33 levels stand out as strong support zones. In particular, in the event of a sharp sell-off, a pullback to $3.23 appears technically possible.
According to Simple Moving Averages (SMA) data, Sui’s average price is currently at the $3.46 level. The price remaining below this level indicates that the current downtrend could technically continue.
Support levels: 3.23 – 3.33 – 3.39
Resistances: 3.50 – 3.60 – 3.78
Legal Notice
The investment information, comments, and recommendations contained herein do not constitute investment advice. Investment advisory services are provided individually by authorized institutions taking into account the risk and return preferences of individuals. The comments and recommendations contained herein are of a general nature. These recommendations may not be suitable for your financial situation and risk and return preferences. Therefore, making an investment decision based solely on the information contained herein may not produce results in line with your expectations.


