
Technical Analysis
BTC/USDT
Strategy, on July 29, 2025, purchased 21,021 BTC using the net proceeds from the initial public offering (IPO) of STRC shares, which raised 2.52 billion dollars. The company’s total Bitcoin holdings reached 628,791 units. The Smarter Web Company acquired an additional 225 BTC, bringing its total holdings to 2,050 BTC. Twenty One Capital became the world’s third-largest institutional Bitcoin holder with 43,514 BTC. Federal Reserve Member Adriana Kugler will not attend the July interest rate meeting for personal reasons. The White House has postponed the vote on the CFTC chair nomination due to potential conflicts of interest with Kalshi. While today brings a busy agenda for the markets, the Fed interest rates, which are expected to remain unchanged following the first crypto report, and Chairman Powell’s messages on the economy will be closely monitored.
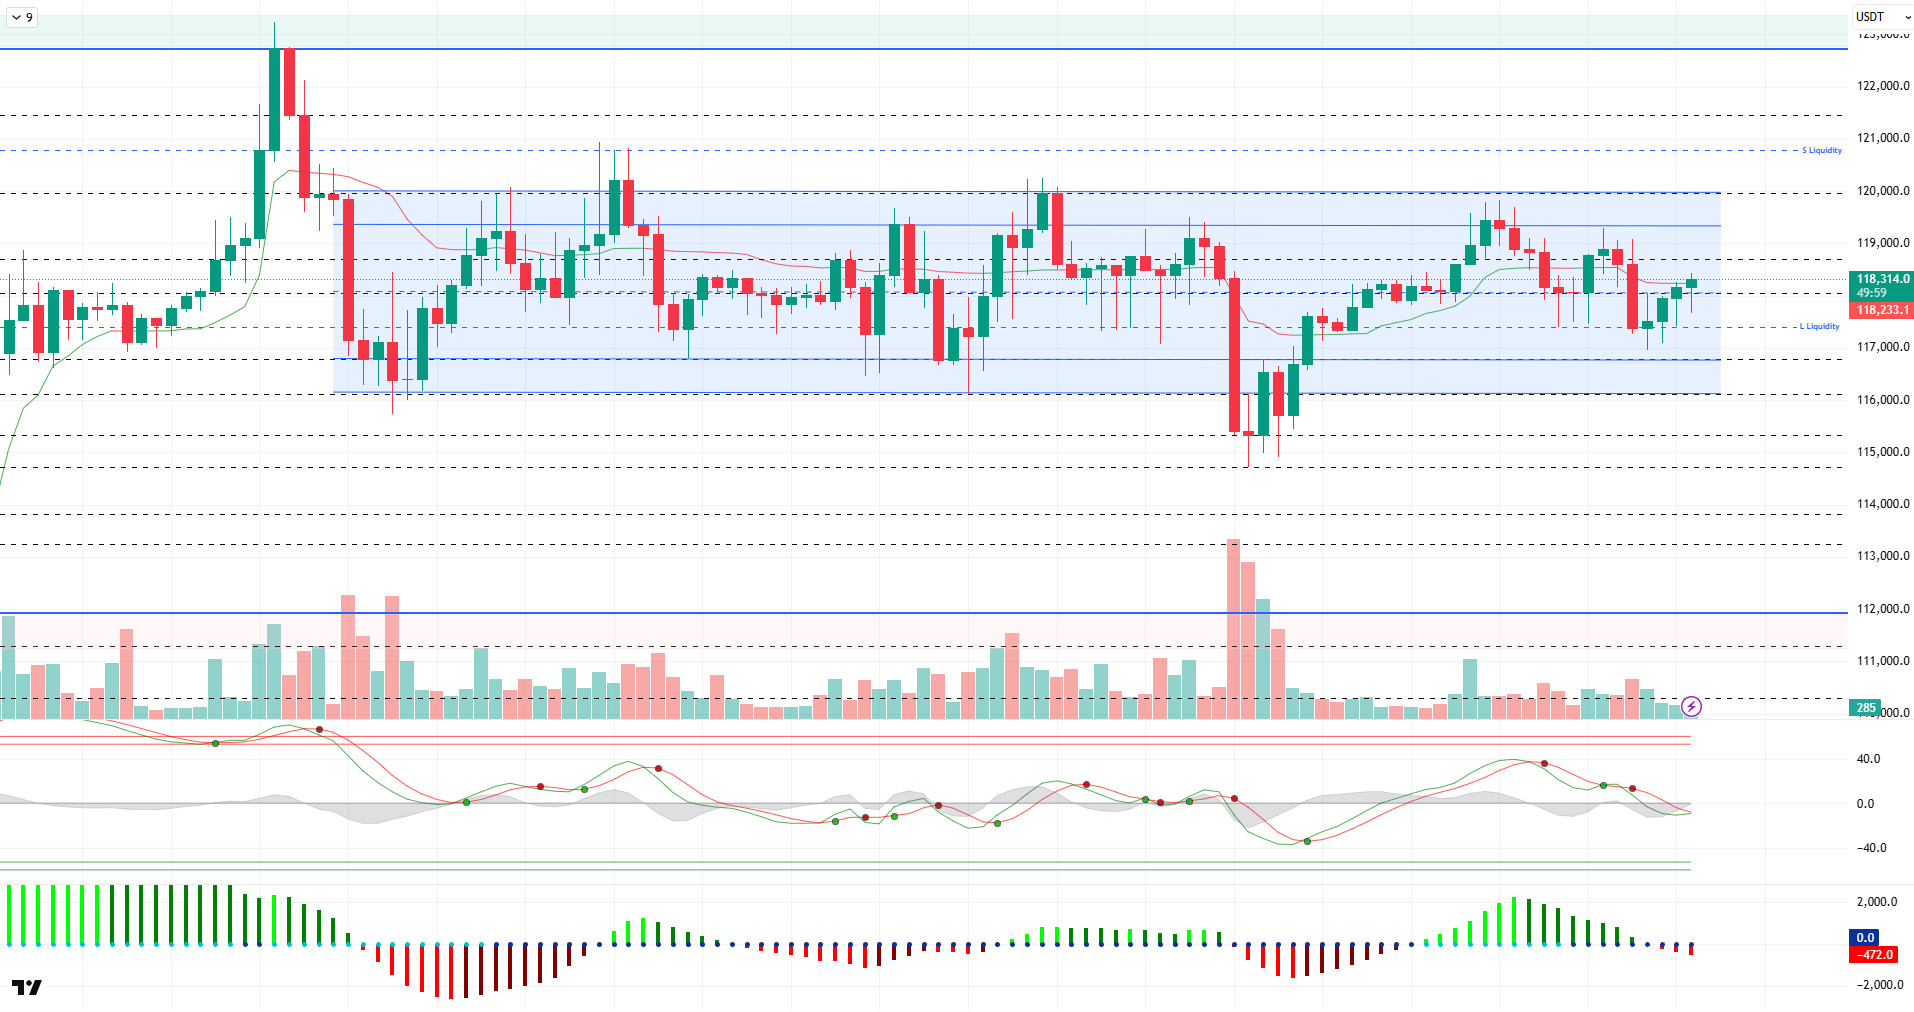
Looking at the technical picture, BTC, which has formed a minor downward trend channel within a horizontal band, has retreated to the 117,000 level. After rebounding from this level once again, the price continues to trade around the 118,300 level.
On the technical indicators front, the Wave Trend (WT) oscillator has been showing indecision in the middle band of the channel for a long time, while continuing to give divergent signals. The Squeeze Momentum (SM) indicator has moved back into negative territory, confirming the downtrend. The Kaufman moving average is just below the price at 118,200.
Looking at liquidity data, liquidation occurred at the 117,000 level, where short-term buy orders have accumulated. Meanwhile, increasing selling activity above the 120,000 level is noteworthy.
In summary, along with fundamental developments, the BTC price continues to remain in a band close to its ATH level, while the consolidation process has been ongoing since July 14. The technical outlook shows inconsistent results along with indecisive price movements. Liquidity data, on the other hand, shows us the price’s reversals from its reaction areas. In this context, the developments mentioned at the beginning could bring about a price breakout. If the price shows signs of liquidity absorption, it is expected to test above the 120,000 level, while the 117,500 support level should be monitored in the event of potential selling pressure. In the event of a breakout, the 115,000 reference zone comes into focus.
Support levels: 118,000 – 117,500 – 116,800
Resistance levels: 118,600 – 120,000 – 120,600
ETH/USDT
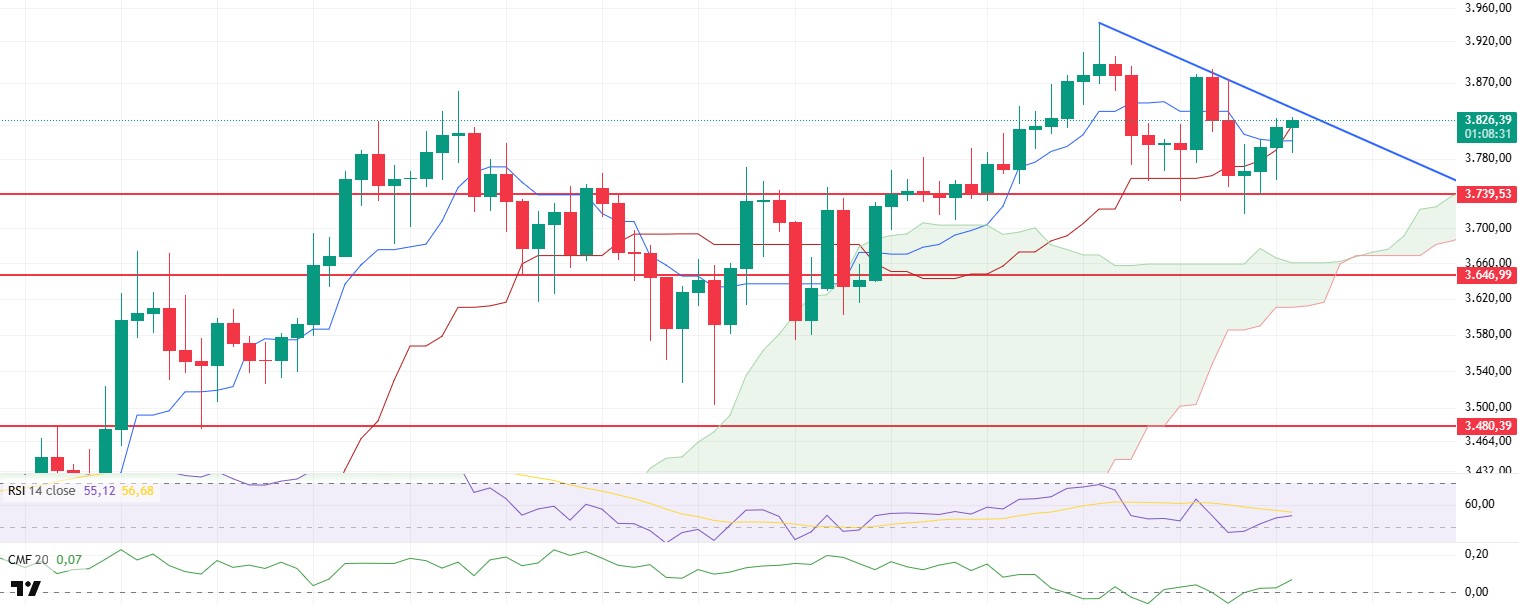
ETH moved negatively in line with expectations yesterday, retreating to the $3,739 level. This area has previously served as a support zone where buyers stepped in, and indeed, the price rebounded from here to above $3,800. However, today’s Fed interest rate decision and subsequent statements by Chairman Powell are likely to cause significant volatility in the markets. This increases the likelihood of both sharp upward movements and sudden pullbacks.
On the technical indicators side, the Ichimoku indicator is giving some interesting signals. While the price has regained both the Tenkan and Kijun levels, indicating a short-term recovery signal, the fact that the Tenkan level remains below the Kijun level suggests that the structure has not yet fully turned positive. This crossover indicates that selling pressure may continue in the short term and that the market may move forward in an indecisive structure.
The Chaikin Money Flow (CMF) indicator has entered positive territory, indicating that liquidity is returning to the market, albeit at a limited pace. This supports a partial increase in buy positions and suggests that buyers are beginning to show interest at bottom levels. However, it should be noted that this liquidity flow is not strong at this stage.
On the Relative Strength Index (RSI) front, declining peaks are noteworthy. The RSI forming parallel downward peaks alongside price movements increases the risk of negative divergence. If this structure holds, the likelihood of price testing new lower levels is quite high.
Finally, the downward trend line shown by the blue line on the chart is critical. If this trend is not broken during the day, the price may retreat back to the 3,739 dollar level. However, if the trend breaks upward, buying interest may increase, potentially driving the price up to the 3,900 dollar level. Overall, the structure indicates that the price’s reaction to this downward trend line will be decisive in determining the direction in the short term.
Top of Form
Below the Form
Supports 3,739 – 3,646 – 3,480
Resistances: 4,084 – 4,381 – 4,857
XRP/USDT
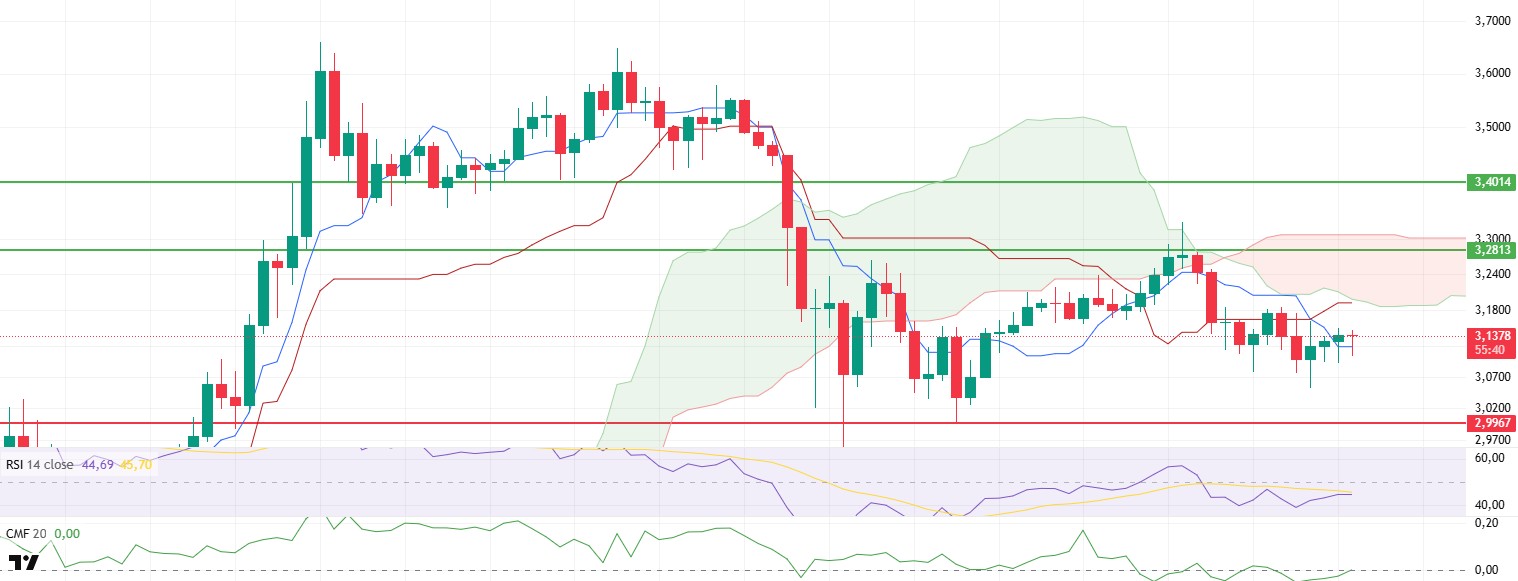
XRP fell back to the $3.05 level yesterday evening. With buyers stepping in at this level, the price rebounded and rose to the $3.15 level. However, despite the current rebound, technical indicators continue to show a generally weak outlook, suggesting that upward movements may remain limited in the short term.
The Chaikin Money Flow (CMF) indicator continues to move horizontally near the zero line, indicating that no significant capital inflow into the market has yet occurred. This suggests that the current uptrend is not being driven by strong buyer support, but rather by short-term reactions. This stagnation in liquidity flow supports the notion that buying appetite remains weak.
The Ichimoku indicator paints a clearer picture. Although the price has regained the Tenkan level, indicating that the short-term resistance zone has been broken, this level is still below the Kijun level. This intersection shows that the market has not entered a strong recovery trend and that the current movement is limited. On the other hand, the price continues to trade below the Ichimoku cloud, an important component of the Ichimoku indicator. This structure indicates that the overall trend is moving in a negative direction and that the current price is under significant downward pressure.
In this context, if XRP continues to remain below the kumo cloud during the day, the negative scenario is likely to continue. In the opposite scenario, i.e., if the price breaks above the lower band of the kumo cloud at the $3.19 level, it could strengthen short-term buy scenarios and bring higher targets to the fore. However, for this breakout to occur, both volume support and technical indicators showing signs of recovery are required. In general, it is advisable to remain cautious as long as the price continues to move below the cloud.
Supports: 2.9967 – 2.8471 – 2.6513
Resistances: 3.2813 – 3.4014 – 3.8615
SOL/USDT
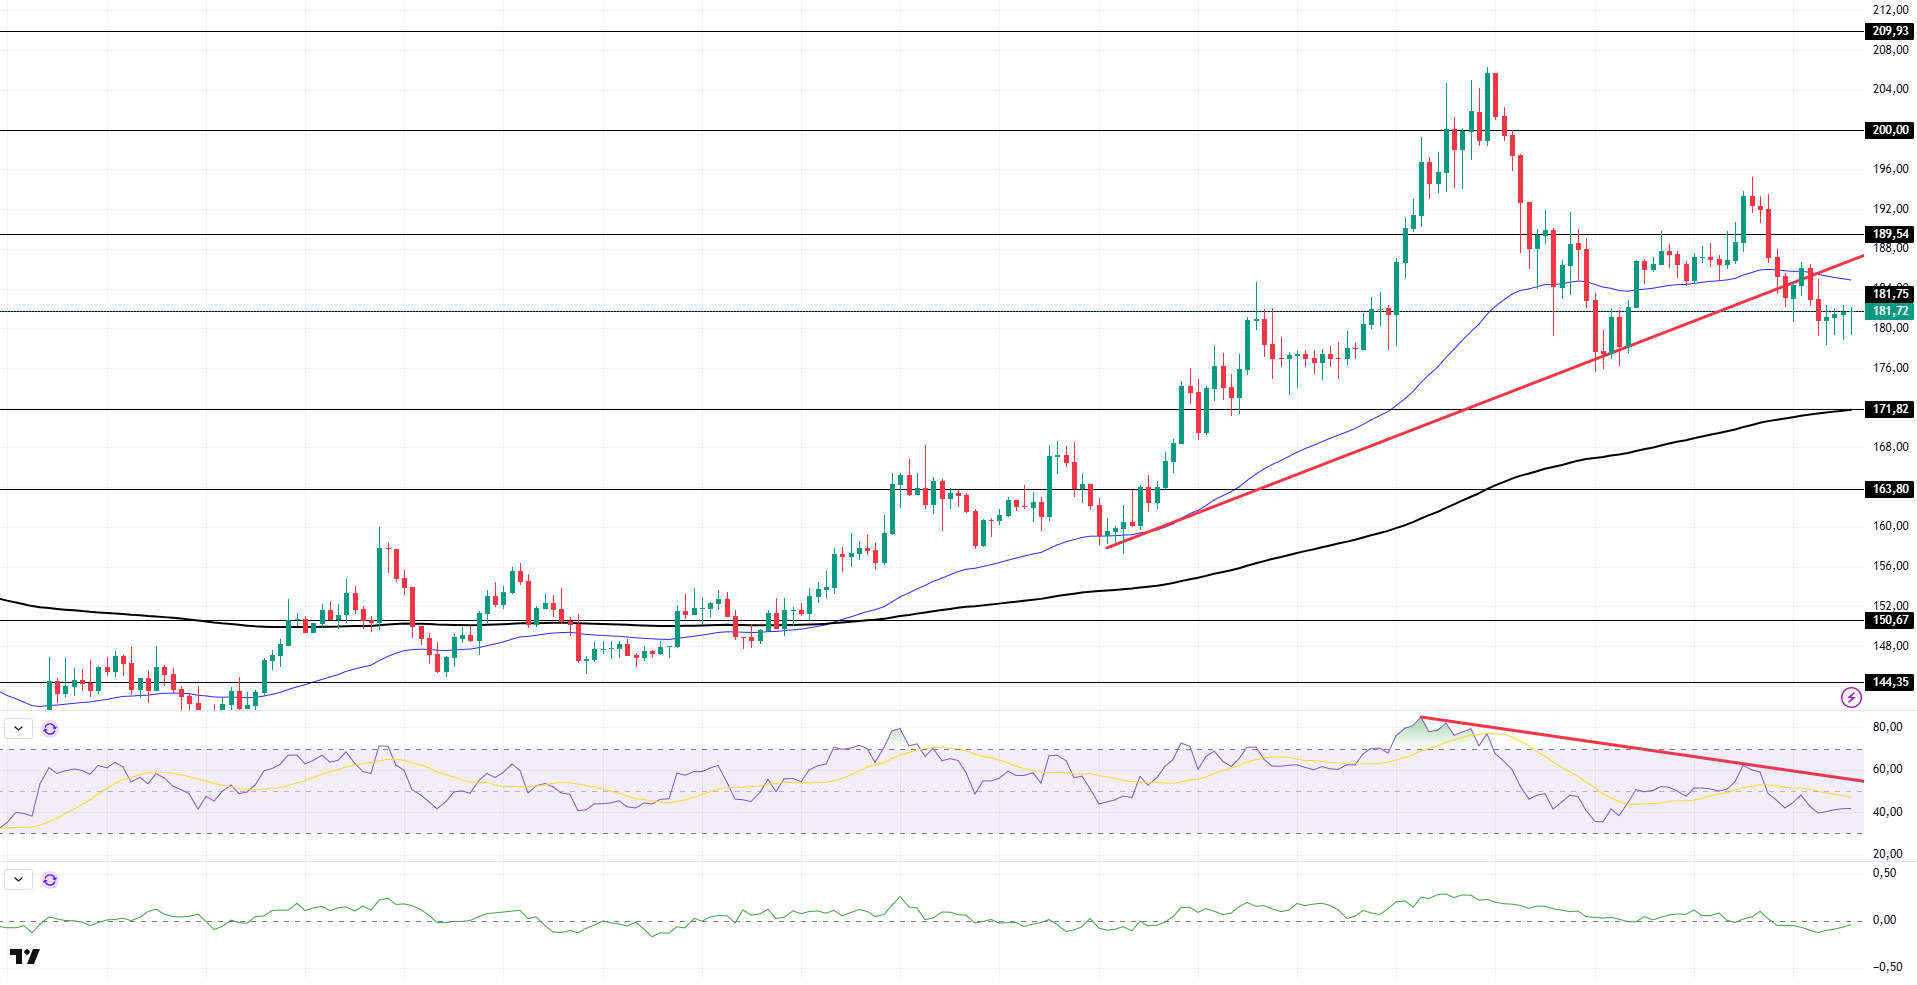
SOL price continued its horizontal trend. The asset tested the resistance level of the upward trend that began on July 15 but failed to break through, resulting in a pullback. As of now, it is testing the strong resistance level at $181.75. If the pullback continues, the 200 EMA (Black Line) moving average can be monitored. If an uptrend begins, the $189.54 level can be monitored.
On the 4-hour chart, the 50 EMA (Blue Line) remains above the 200 EMA (Black Line). This indicates that the upward trend may continue in the medium term. Additionally, the price being between the two moving averages suggests that the market is currently in a decision phase. Chaikin Money Flow (CMF-20) has continued to remain in the negative zone. However, a decrease in money inflows could push the CMF further into the negative zone. The Relative Strength Index (RSI-14) has continued to remain below the downward trend that began on July 21. In the event of an upward movement due to macroeconomic data or positive news related to the Solana ecosystem, the $189.54 level emerges as a strong resistance point. If this level is broken upward, the upward trend is expected to continue. In the event of a pullback due to adverse developments or profit-taking, the $171.82 level could be tested. A decline to these support levels could see an increase in buying momentum, presenting a potential opportunity for an upward move.
Support levels: 171.82 – 163.80 – 150.67
Resistance levels: 181.75 – 189.54 – 200.00
DOGE/USDT
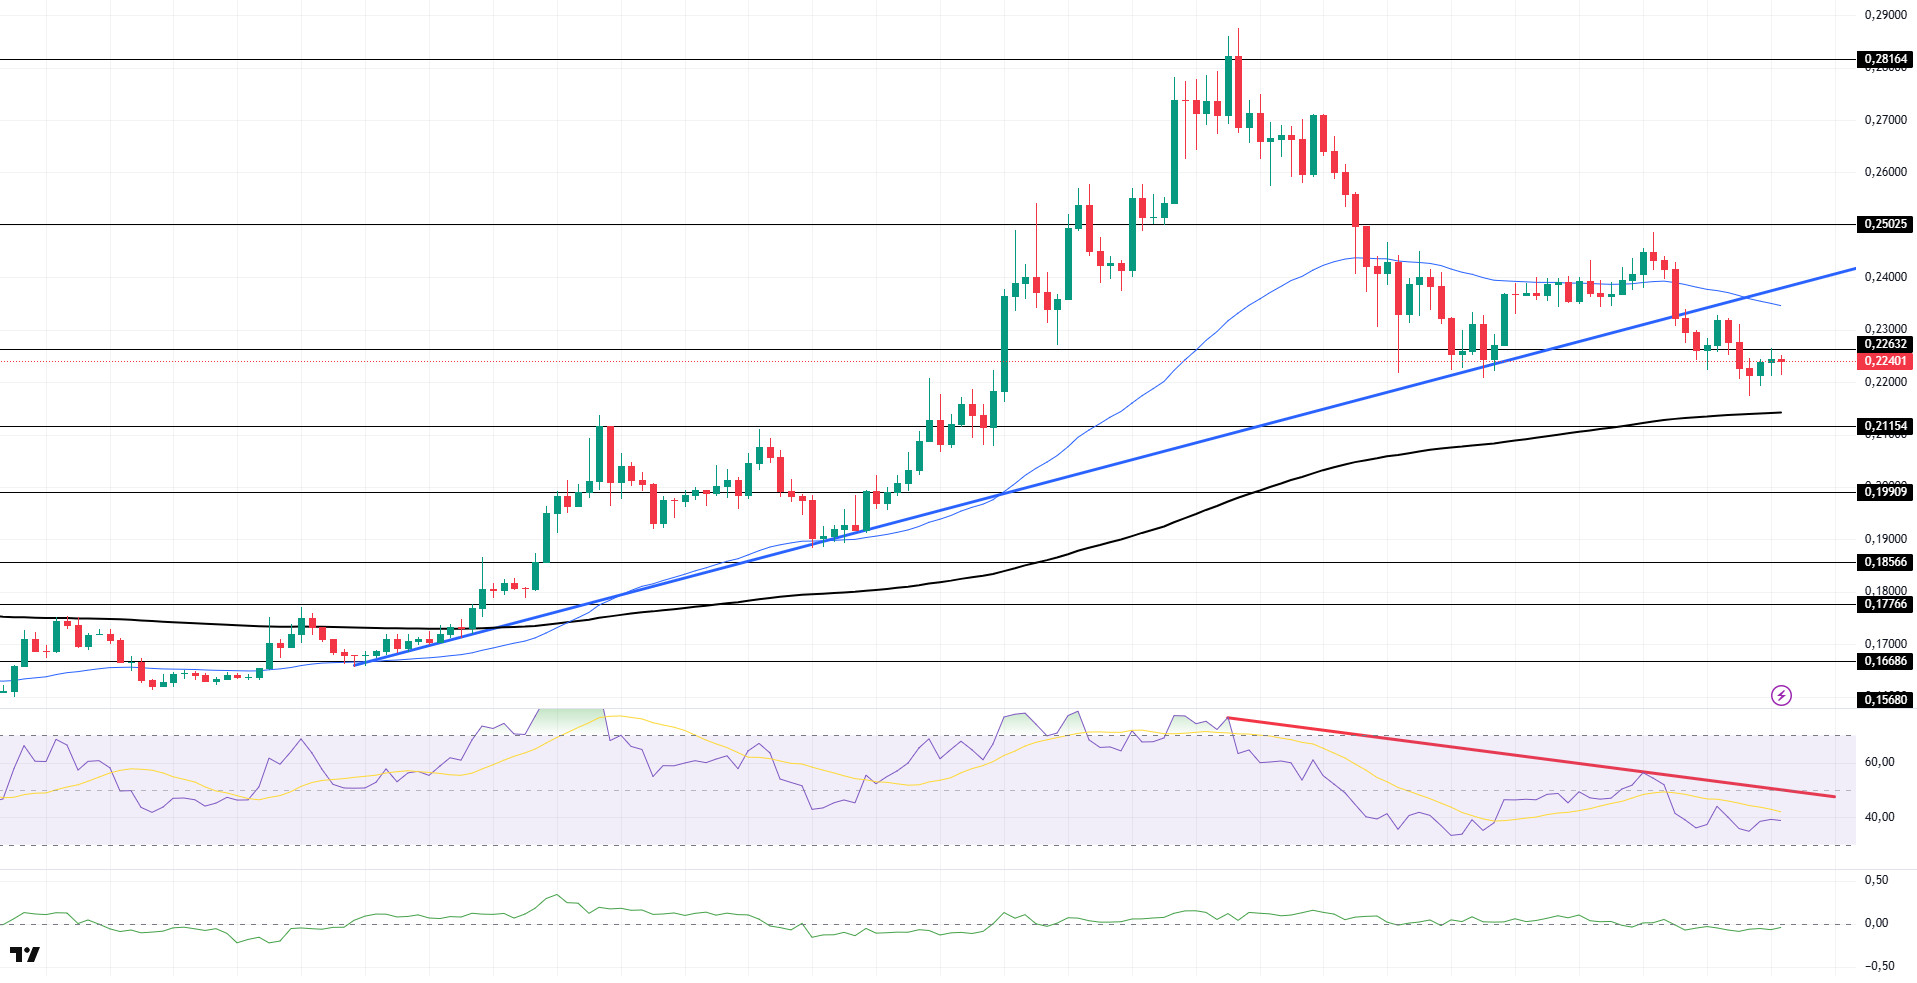
The DOGE price is continuing its sideways movement. The asset has remained below the 50 EMA (Blue Line) moving average since the upward trend began on July 7. The price is currently testing the 0.22632 dollar level as resistance. In the event of a continued pullback, the 200 EMA (Black Line) moving average can be monitored as a support level. If an uptrend begins, the 0.25025 dollar level should be monitored.
On the 4-hour chart, the 50 EMA (blue line) remains above the 200 EMA (black line). This indicates that the asset is in an upward trend in the medium term. The price being between the two moving averages indicates that the asset is in a decision phase in the short term. Chaikin Money Flow (CMF-20) remained in negative territory. Additionally, negative cash inflows could push the CMF further into the negative zone. The Relative Strength Index (RSI-14) remains in the negative zone. Furthermore, it remains below the downward trend that began on July 21. This could continue the downward movement. In the event of upward movements driven by political developments, macroeconomic data, or positive news flow within the DOGE ecosystem, the $0.25025 level emerges as a strong resistance zone. In the opposite scenario or in the event of negative news flow, the 0.21154 dollar level could be triggered. A decline to these levels could increase momentum and potentially initiate a new upward wave.
Support levels: 0.21154 – 0.19909 – 0.18566
Resistance levels: 0.22632 – 0.25025 – 0.28164
Legal Notice
The investment information, comments, and recommendations contained herein do not constitute investment advice. Investment advisory services are provided individually by authorized institutions taking into account the risk and return preferences of individuals. The comments and recommendations contained herein are of a general nature. These recommendations may not be suitable for your financial situation and risk and return preferences. Therefore, making an investment decision based solely on the information contained herein may not produce results in line with your expectations.

