
TECHNICAL ANALYSIS
BTC/USDT
While global markets fell sharply under the current tariffs, striking data for Bitcoin came from the S&P 500. Due to Trump’s trade tariffs, the seven-day annualized volatility of the S&P 500 rose to 169%, surpassing Bitcoin’s 83%. This once again demonstrated that Bitcoin is preferred as a safe haven as it moves towards becoming digital gold. When we look at the developments of the day, the SEC led by Paul Atkins published a new guideline on the issuance of securities and disclosure requirements in the crypto asset market, while Trump signed the law cancelling the crypto tax rules adopted during the Biden administration and targeting DeFi platforms. Today, markets will follow the US PPI data.
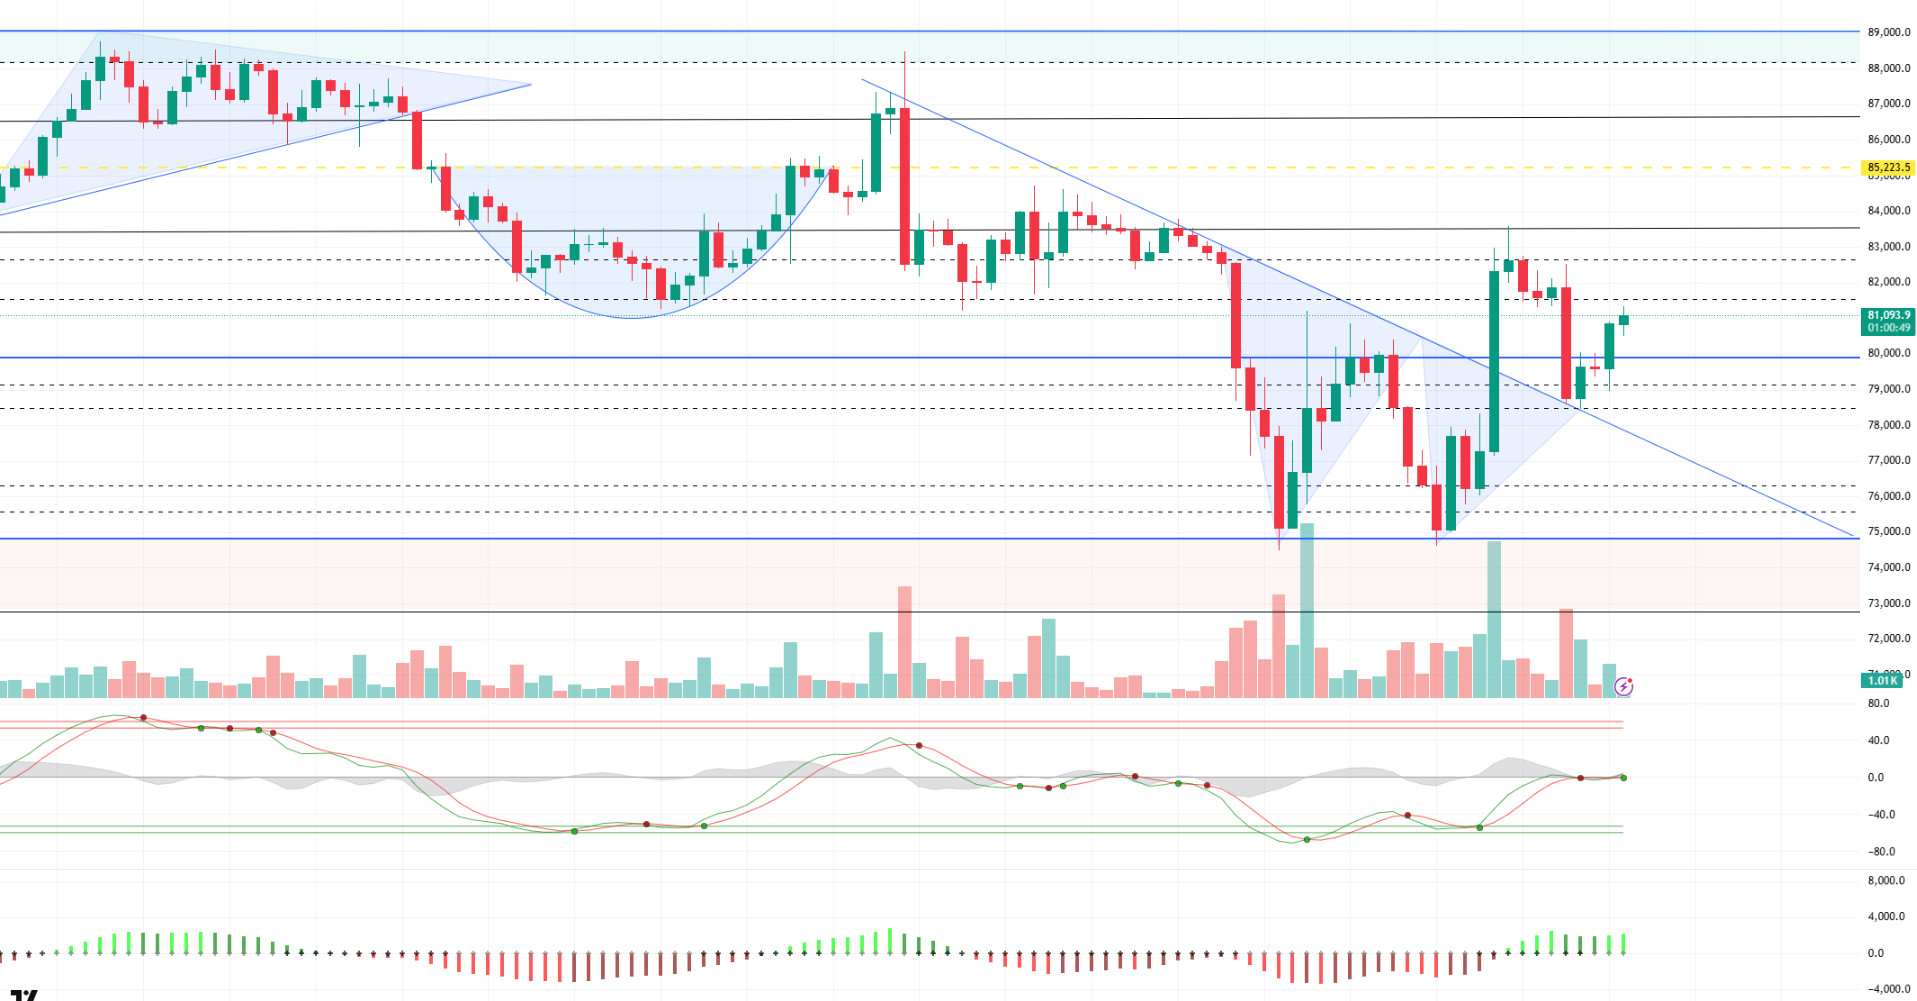
Looking at the technical outlook, BTC was stuck in a narrow bandwidth as of yesterday before breaking to the downside on a sell signal and testing the falling trend line. With the demand coming from this area, especially from the 78,000-79,000 band, the price generated a buy signal and turned its direction upwards again and managed to exceed the 80,000 level on its third attempt, which it had tested on two previous candles. At the time of writing, BTC is trading at 81,200. Technically, the 81,500 level stands out as a minor resistance point. If this level is breached, the price will have re-entered yesterday’s squeezed bandwidth, and this may strengthen the upside potential. Looking at the liquidation data, it is noteworthy that buyers are accumulating above the falling trend line. On the other hand, heavy short positions at the 85,000 level have not yet been closed, suggesting that there is an important resistance area in front of upside moves. On the fundamental side, the fact that the price has not yet encountered strong buyers despite the softening of the tone towards tariff rhetoric reflects that the market is still unable to determine a clear direction, and the uncertainty environment continues. In a possible new wave of selling, the tested falling trend line may work as an important support again. However, if this support is broken, the depth of the trend may increase, and lower levels may be on the agenda where the price may generate demand again.
Supports 81,500 – 80,000 – 78,500
Resistances 83,500 – 85,200 – 86,600
ETH/USDT
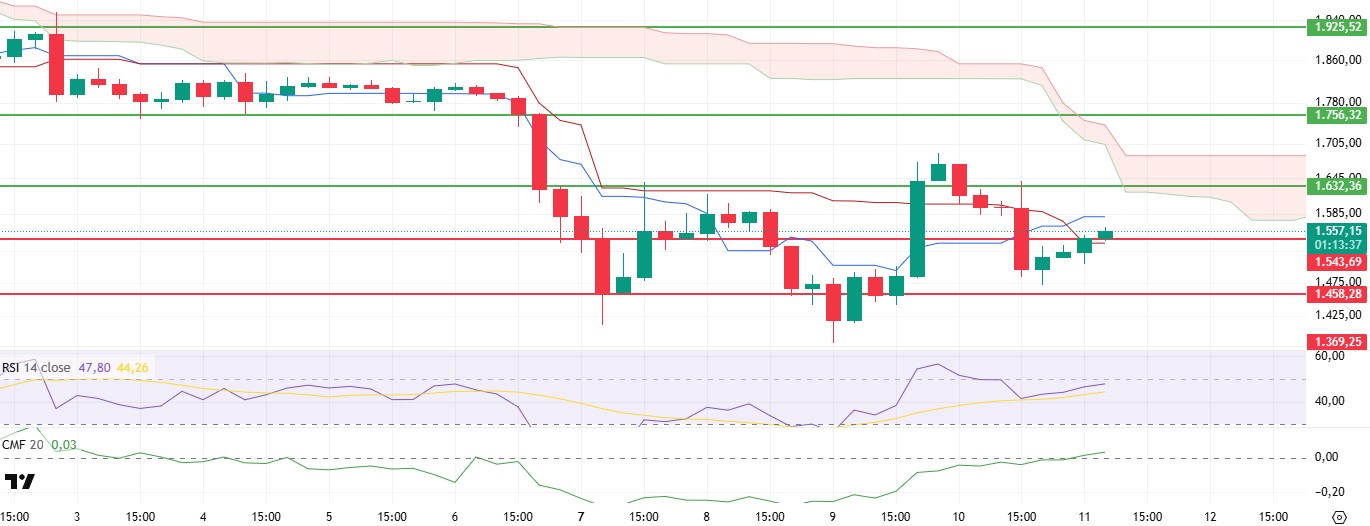
ETH experienced a sharp retreat yesterday due to macroeconomic developments from the US front, falling to the support level of $1,458. However, after this decline, a partial recovery was observed in the markets in the morning hours and ETH managed to regain the $1,543 level again. Despite the high volatility in price movements, technical indicators are still positive, suggesting that pullbacks can be considered as buying opportunities.
The Chaikin Money Flow (CMF) indicator continued to rise after crossing into positive territory, indicating that the liquidity entering the market is increasing and the buy side is regaining strength. The fact that CMF remains strong, especially despite the recent sharp decline, indicates that the buying activity in the spot market continues unabated and the confidence in the market has not completely dissipated. This is a positive signal for the medium-term outlook. When the Ichimoku indicator is analyzed, a classic buy signal has been formed as the tenkan level, which represents the short-term price average, exceeds the kijun level, which represents the longer-term average. However, for this signal to gain confirmation, the price needs to make an upward move towards the Ichimoku cloud. If the price enters and persists inside the cloud, this could signal a stronger trend reversal. On the other hand, momentum indicators are currently in positive territory. This indicates that the bullish potential is preserved in the short term.
In this context, if ETH manages to hold above the $1,543 level during the day, the price has the potential to retest the $1,632 resistance towards the evening hours, following a horizontal or slightly positive course. However, if this level cannot be maintained and a downward breakout occurs, the risk of a pullback to the $1,458 level may be on the agenda again as selling pressure increases again. For this reason, it is especially important for investors to closely monitor the $1,543 level as short-term pivot support.
Supports 1,632 – 1,756 – 1,925
Resistances 1,543 – 1,632 – 1,756
XRP/USDT
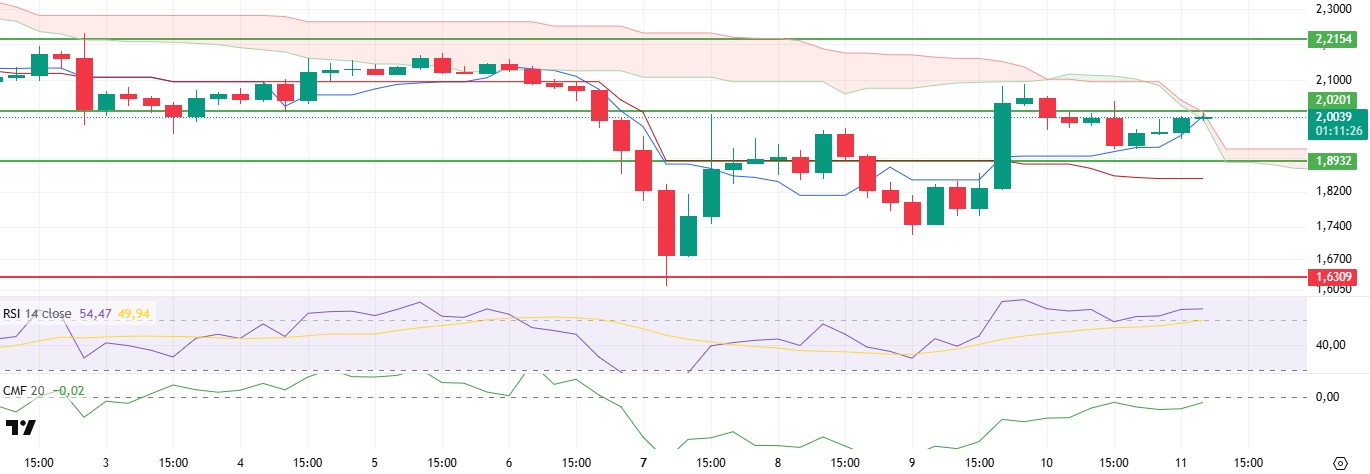
XRP experienced a slight pullback after being rejected once again at the $2.02 level yesterday evening. With this decline, the price fell to the tenkan level, which represents the short-term direction in the Ichimoku cloud. However, finding strong support from this level, it started to recover again and is making an attack towards the resistance of $2.02. The fact that the price is approaching this level again indicates that upside expectations continue in the short term.
Technical indicators remain generally positive. In particular, the Chaikin Money Flow (CMF) indicator climbed towards the positive territory, indicating that liquidity inflows to the market have increased and the buy side has regained its dominant position. This rise suggests that the buying appetite on the spot side is still alive and declines are likely to remain limited. The fact that CMF maintains this structure also supports the possibility of the price breaking the resistance zone. When the Ichimoku indicator is analyzed, the continued rise of the tenkan level indicates that the short-term momentum of the price continues. At the same time, the fact that the upper limit of the kumo cloud coincides with the $2.02 level makes this resistance even more technically critical.
If the price breaks this zone on volume, a stronger uptrend is possible. Such a scenario could push the price to higher resistances as buyers step in more aggressively. On the other hand, if the $2.02 level again works as a strong resistance and the price is clearly rejected from this level, selling pressure may increase again. In such a case, the $1.89 level can be monitored as the first support point. For this reason, the $2.02 region stands out as a critical threshold both in terms of short-term direction and in terms of the continuation of the trend.
Supports 1.8932- 1.6309 – 1.4264
Resistances 2.0201 – 2.2154 – 2.3938
SOL/USDT
Stablecoins on Solana mostly increased after the minting of USDC in January. However, DeFi stablecoins were added last month. Most of the new stablecoin supply remains on-chain even after the slowing DEX activity.
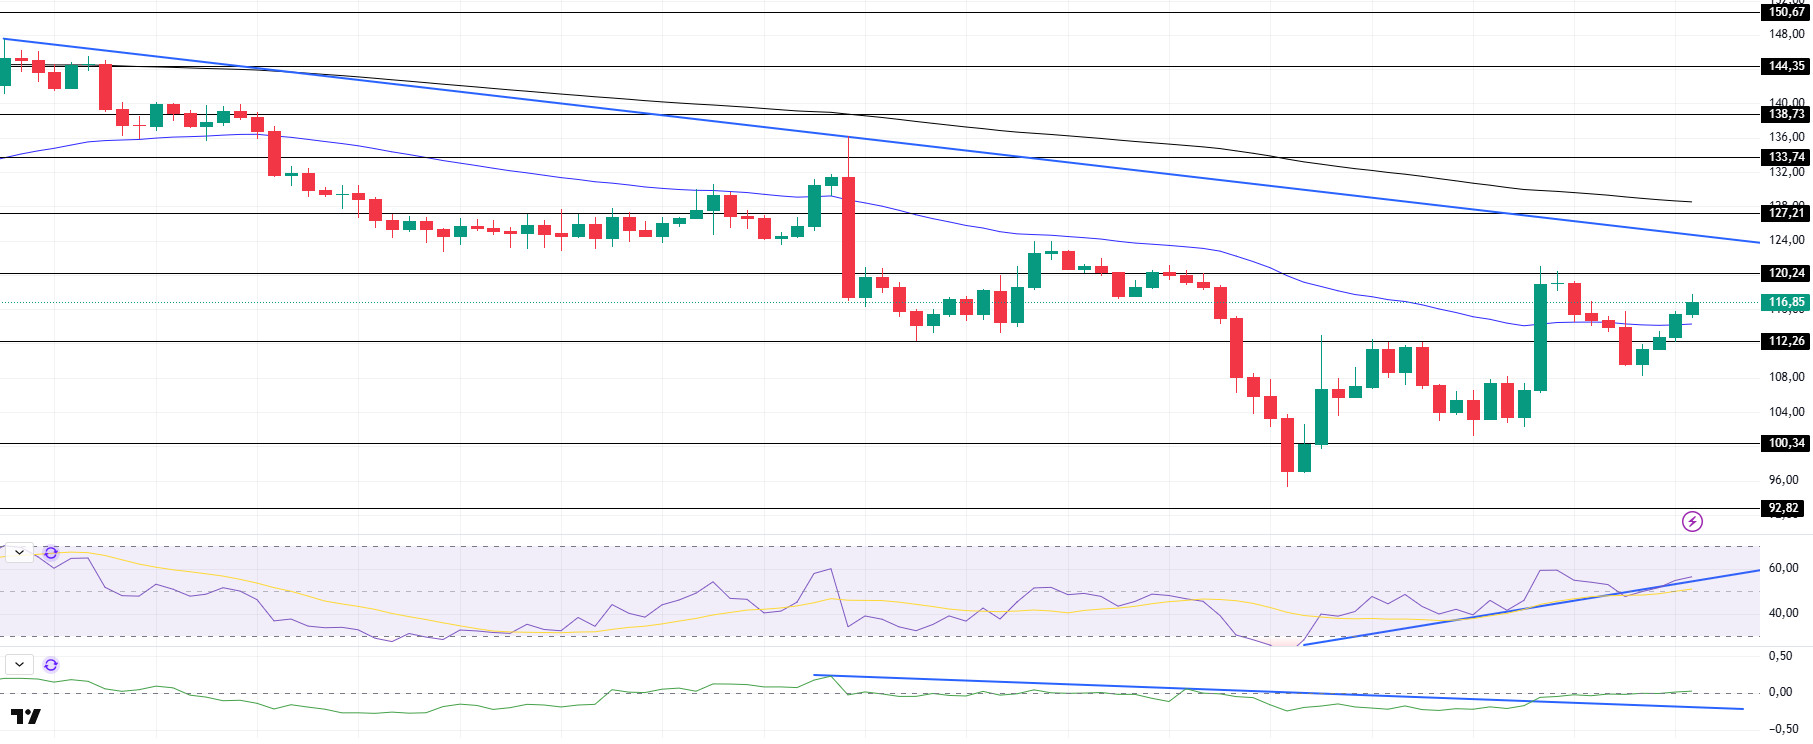
SOL has experienced fluctuations since our analysis yesterday evening. The asset fell by about 10% after testing the strong resistance level of $120.24. The asset then turned its momentum upwards and is moving towards the strong resistance level of 120.24 again with a rise of about 8%. Breaking the moving average of 50 EMA (Blue Line) to the upside, the asset may test the downtrend that started on March 25 as resistance if the momentum continues. On the 4-hour timeframe, the 50 EMA (Blue Line) remained below the 200 EMA (Black Line). This could continue the decline in the medium term. At the same time, the price started to move between two moving averages. This shows us that the market is in the decision phase. When we analyze the Chaikin Money Flow (CMF)20 indicator, it has moved into positive territory. However, the negative daily volume may move CMF back into negative territory. On the other hand, CMF has broken the downtrend that started on April 2. However, Relative Strength Index (RSI)14 maintained the uptrend that started on April 7 and crossed into positive territory. This could push the price higher. The $120.24 level appears as a resistance point in the rises driven by the upcoming macroeconomic data and the news in the Solana ecosystem. If it breaks here, the rise may continue. In case of retracements for the opposite reasons or due to profit sales, the support level of 112.26 dollars can be triggered. If the price comes to these support levels, a potential bullish opportunity may arise if momentum increases.
Supports 112.26 – 100.34 – 92.82
Resistances 120.24 – 127.21 – 133.74
DOGE/USDT
House of Doge and 21Shares have partnered to launch Dogecoin ETPs globally. The Dogecoin Foundation’s partnership with 21Shares aims to transform Dogecoin into a trusted financial instrument for global investors. On the Onchain side, more than $11 million in Dogecoin liquidations were recorded in 24 hours.
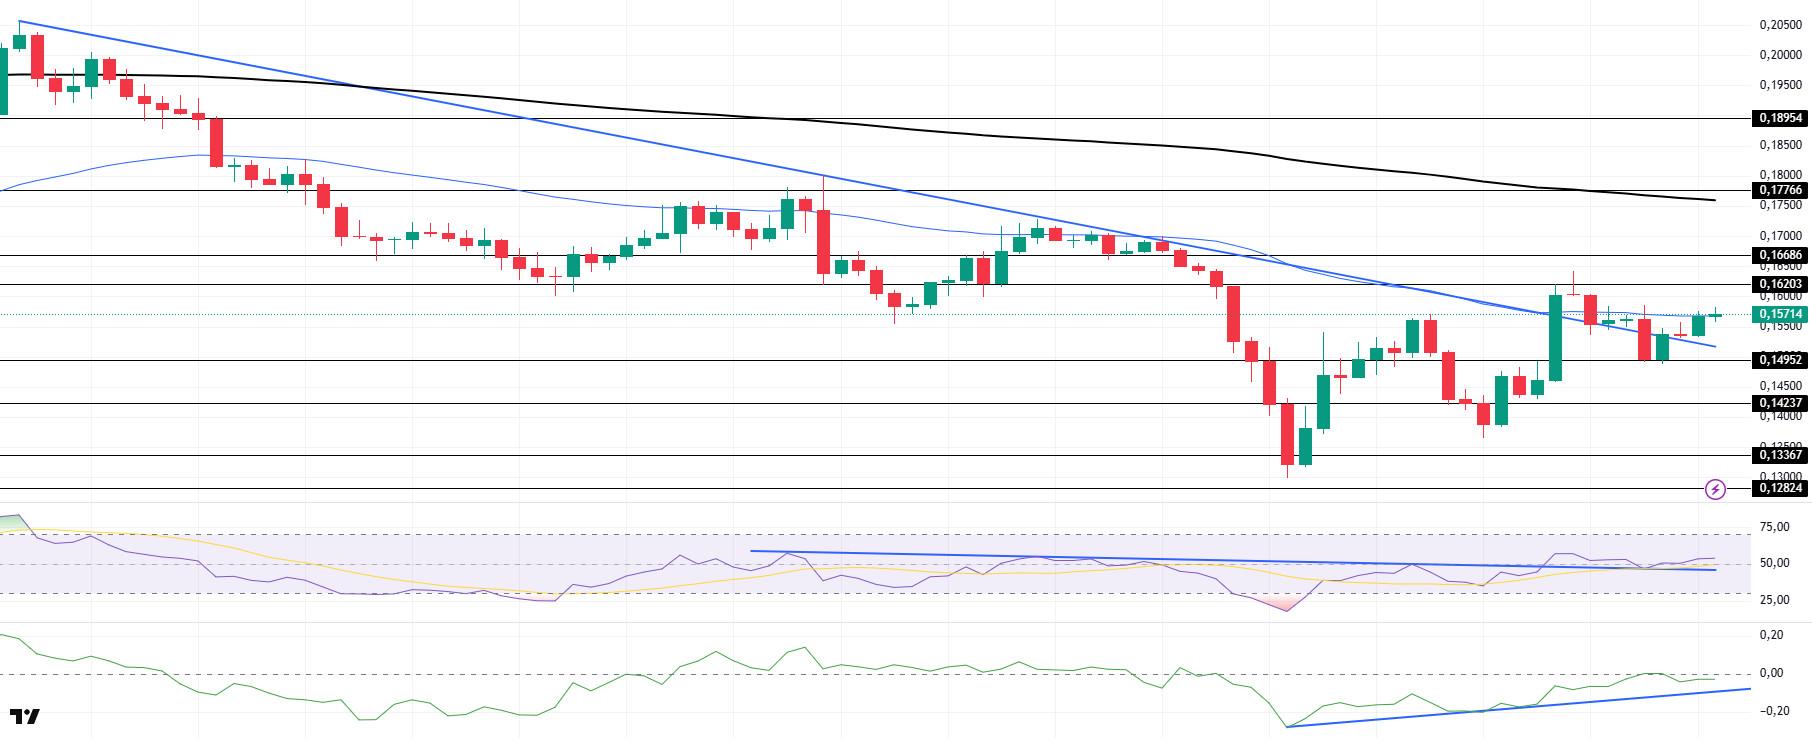
DOGE continued its uptrend after our analysis last night. The asset turned from the resistance level at $0.16203 and started pricing below the 50 EMA, the moving average. It then tested the strong support at $0.14952 and gained momentum from there. As of now, it remains above the 50 EMA (Blue Line), the moving average, making it a place of support. The price, which has managed to stay above the downtrend and the 50 EMA (Blue Line), may retest the strong resistance level of $0.16203 if the positive market dynamics continue. On the 4-hour timeframe, the 50 EMA (Blue Line) remains below the 200 EMA (Black Line). This could mean that the decline could continue in the medium term. However, the price started to price between two moving averages. When we analyze the Chaikin Money Flow (CMF)20 indicator, it is at a neutral level. In addition, the negative 24-hour volume may cause CMF to move back into negative territory. However, the uptrend in CMF, which started on April 7, continues. This may continue the uptrend. On the other hand, Relative Strength Index (RSI)14 is in the middle zone of the positive level and has broken the downtrend that started on April 1. It may test this trend as support and continue its uptrend. The level of 0.16686 dollars appears as a very strong resistance place in the rises due to political reasons, macroeconomic data and innovations in the DOGE coin. In case of possible retracements due to political, macroeconomic reasons or due to negativities in the ecosystem, the $ 0.14952 level, which is a strong support place, is an important support place. If the price reaches these support levels, a potential bullish opportunity may arise if momentum increases.
Supports 0.14952- 0.14237 – 013367
Resistances 0.16203 – 0.16686 – 0.17766
Legal Notice
The investment information, comments and recommendations contained herein do not constitute investment advice. Investment advisory services are provided individually by authorized institutions taking into account the risk and return preferences of individuals. The comments and recommendations contained herein are of a general nature. These recommendations may not be suitable for your financial situation and risk and return preferences. Therefore, making an investment decision based solely on the information contained herein may not produce results in line with your expectations.
