
TECHNICAL ANALYSIS
BTC/USDT
El Salvador President Nayib Bukele’s arrival in the US to meet with Trump at the White House drew attention. In addition to diplomatic cooperation, crypto policies are also expected to be on the agenda. On the other hand, Michael Saylor’s Bitcoin Tracker sharing and “No tariffs on orange dots” statements increased speculation that Strategy may have made new purchases. Eric Trump once again emphasized their interest in crypto by describing BTC as “one of the most valuable storage tools”.
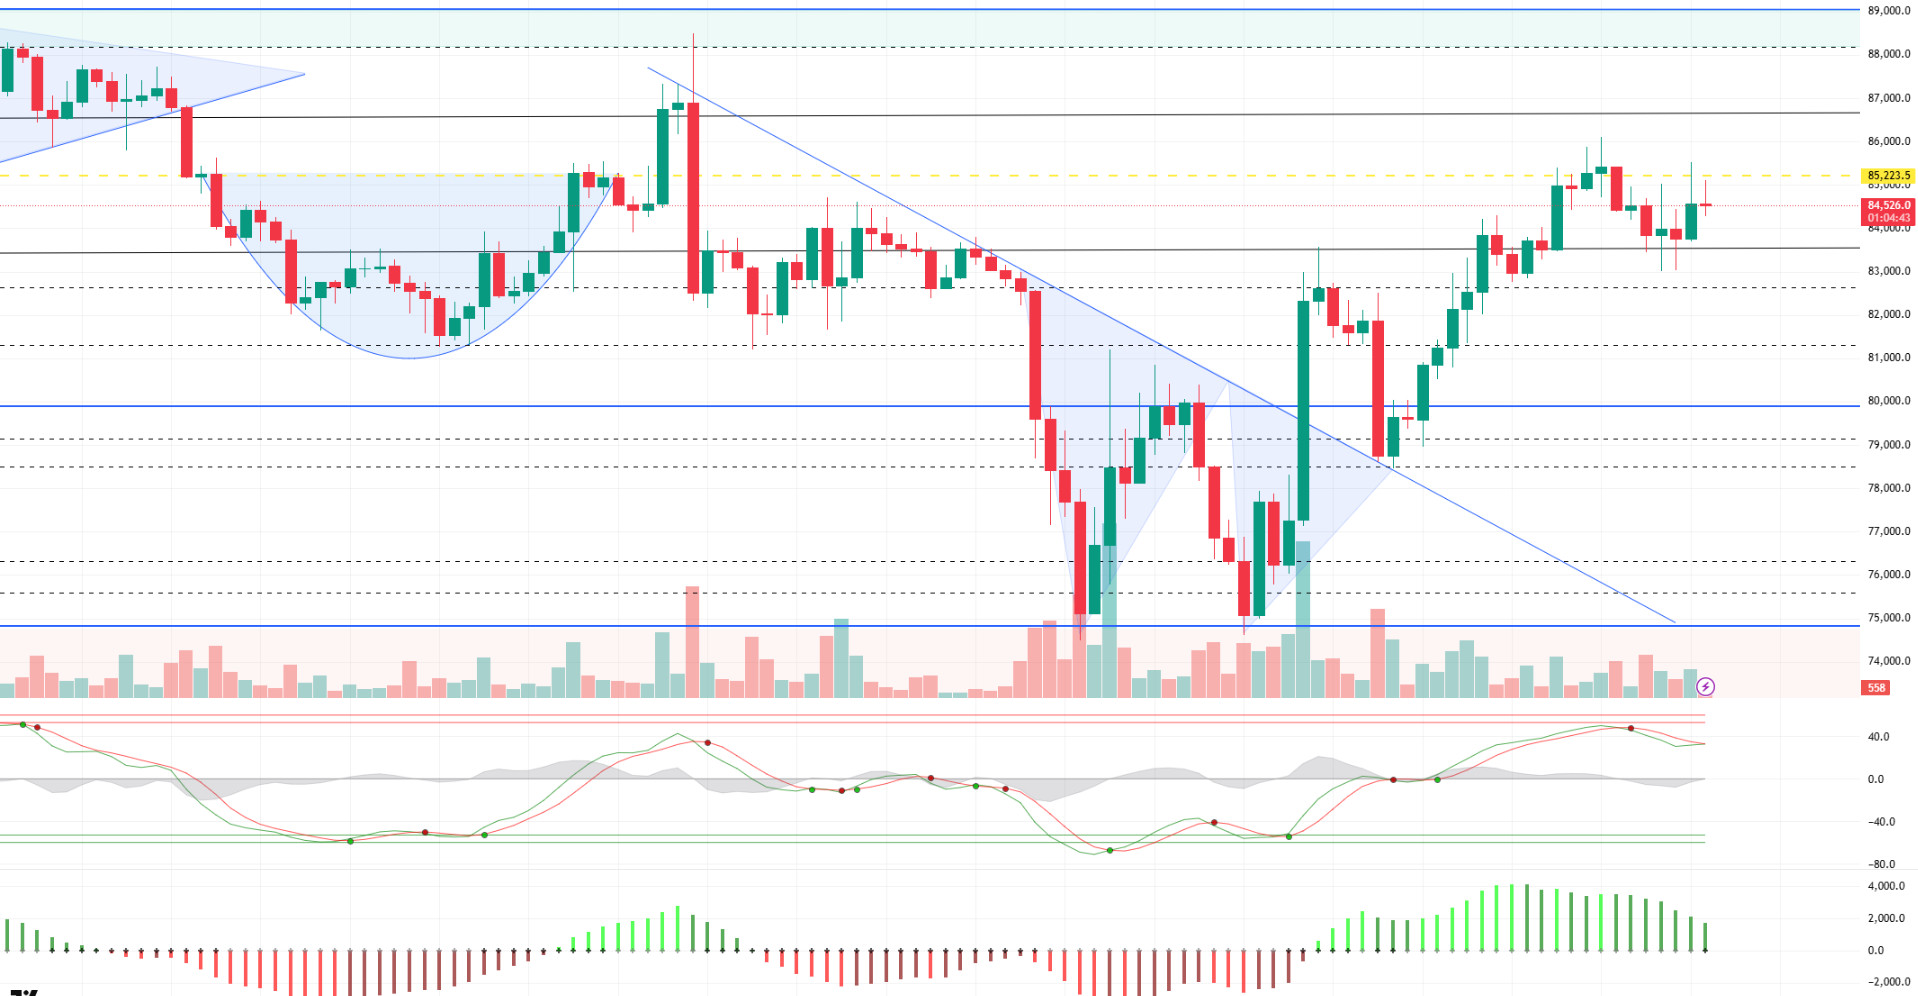
Looking at the technical outlook, BTC continued its uptrend over the weekend, pinning up to the 86,000 level and liquidating short trades above the 85,000 level with this move. However, with the sales following this rise, the price retreated and consolidated in the 83,500-85,200 band range after testing the 83,500 level three times. On the first trading day of the week, BTC continues to trade at 84,500 at the time of writing. When we look at the technical indicators, it is seen that a buy signal is generated again after the sell signal from the overbought zone on the wave trend oscillator. However, despite this signal, momentum indicators continue to weaken, indicating that the market is in an unstable structure. On the fundamental side, although an uptrend has been achieved in recent days with the effect of optimistic rhetoric about tariffs, the re-hardened rhetoric between the US and China and the fact that a concrete compromise step has still not been taken continues to put pressure on the market. This raises the possibility of a new wave of sales. Today, attention is focused on the potential purchases of Strategy, an institutional actor known for its Bitcoin purchases. Such a development could create short-term volatility in the markets. Technically, the 83,500 level stands out as a strong support point in case of a pullback. If the upward movement continues, exceeding the 85,200 level may allow the price to move back to 86,000 and above.
Supports 83,500 – 81,500 – 80,000
Resistances 85,200 – 86,600 – 89.000
ETH/USDT
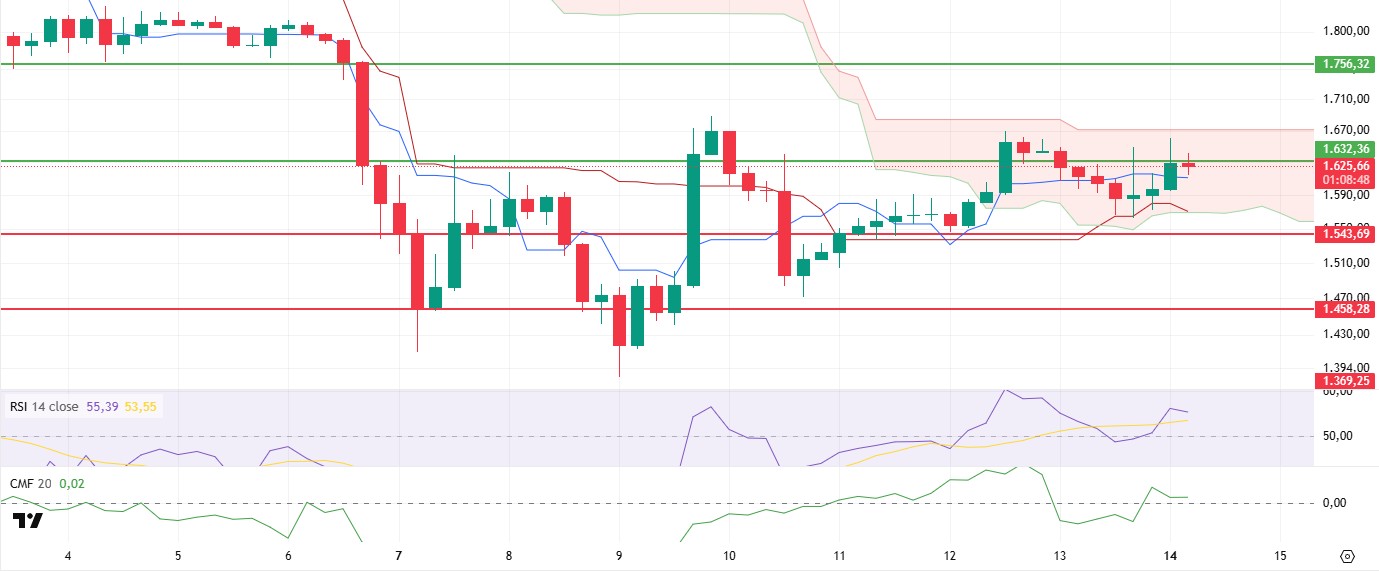
ETH made moves to break through the key resistance zone at $1,632 over the weekend, as expected. However, selling pressure from this level caused the price to pull back briefly. Despite this, ETH is making a strong effort to break above this resistance level again.
In this process, where price movements are supported by technical indicators, there was a remarkable development in the Ichimoku indicator. ETH has now entered the kumo cloud and is being priced within it. While this indicates that the market is in a period of indecision, it could also be a harbinger of a potential directional breakout. In particular, the fact that ETH started trading above both the tenkan and kijun levels points to a positive technical picture. However, the positioning of tenkan above kijun suggests that the short-term momentum is up and the trend is gaining strength. This alignment supports that buyers are gaining weight in the market and the price is willing to enter an uptrend. On the other hand, the Chaikin Money Flow (CMF) indicator is also improving, confirming the price movements. Starting at $1,632, CMF, which fell into the negative zone in the retreat, has moved back to the positive area with the recovery on Sunday. This development shows that the liquidity inflow to the market has increased again and buyers have taken control. Momentum indicators are similarly gaining upward momentum, accompanying the price action. The upward trend in these indicators reveals that the market has confidence in the current uptrend and that the uptrend is technically supported. In this context, a clear breach of the $1,632 level during the day, along with the positive outlook offered by technical indicators, could further strengthen the uptrend. In this case, ETH is likely to target higher levels.
However, in a possible pullback scenario, the $1,543 level stands out as a very critical support point. This level is important not only because it is the area of previous price reactions, but also because it is the lower boundary of the Ichimoku cloud. If this support is broken to the downside, technical weakness could be seen, which could lead to a sharper retracement in ETH price. In conclusion, while the current technical data supports ETH’s upward movement, price reactions to critical support and resistance levels should be carefully monitored.
Supports 1,543 – 1,458 – 1,369
Resistances 1,632 – 1,756 – 1,925
XRP/USDT
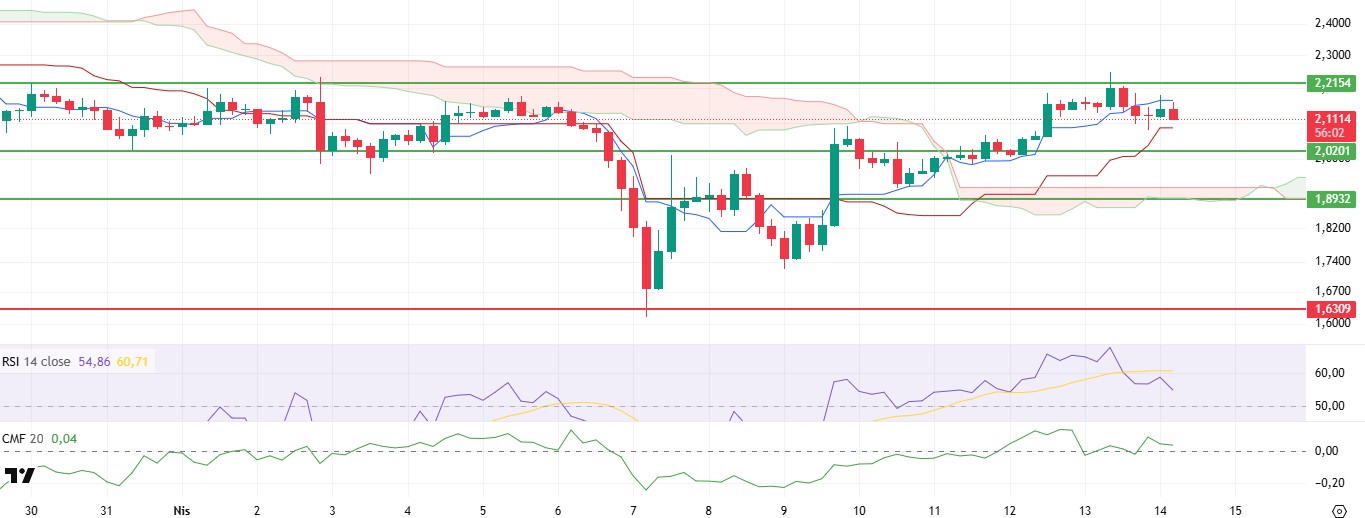
XRP managed to break through an important resistance zone by rising above the $2.02 level on Saturday and rose as high as $2.21 as expected after this move. However, with the selling pressure intensifying at this point, there was a slight pullback in the price. As of now, XRP continues to stay above the Ichimoku cloud, while exhibiting a horizontal outlook with pricing between the tenkan and kijun levels.
Analysing the technical indicators, it is noteworthy that the Chaikin Money Flow (CMF) indicator still remains in the positive zone but has started to exhibit a downward trend. This indicates that liquidity outflows from the market have started, albeit limited. However, it may become clear whether this trend will be permanent or not, especially after the US session opens, as high-volume transactions have the potential to cause directional changes. On the Ichimoku indicator, the general outlook remains positive. The fact that the price is hovering above the kumo cloud suggests that the market is building a strong outlook in the short term with cloud support behind it. The upward movement of the tenkan level is also in sync with the price, which supports that the current uptrend is based on healthy fundamentals. On the other hand, the RSI indicator is below the based MA line and continues its downward movement. This indicates a short-term weakness and suggests that the current selling pressure still persists from a technical perspective.
Therefore, the possibility that the price may fall back to the kijun level of $2.08 in intraday movements should not be ignored. However, the positive structure on the Ichimoku side suggests that these possible pullbacks may be limited and the price could recover quickly and test the $2.21 level again. In this context, a volatile price action can be expected for XRP in the short term, but the search for direction remains positive.
Supports 2.0201- 1.8932 – 1.6309
Resistances 2.2154 – 2.3938 – 2.4721
SOL/USDT
Solaxy, a Tier 2 project created to improve Solana’s infrastructure, managed to raise $30 million in pre-sales. Onchainde reached a 2025 low in active addresses with approximately 1.67 million as of April 11, according to data from Dune Analytics. Open Interest (OI) rose 37% to $5.55 billion, signaling a new wave of leveraged risk entering the market.
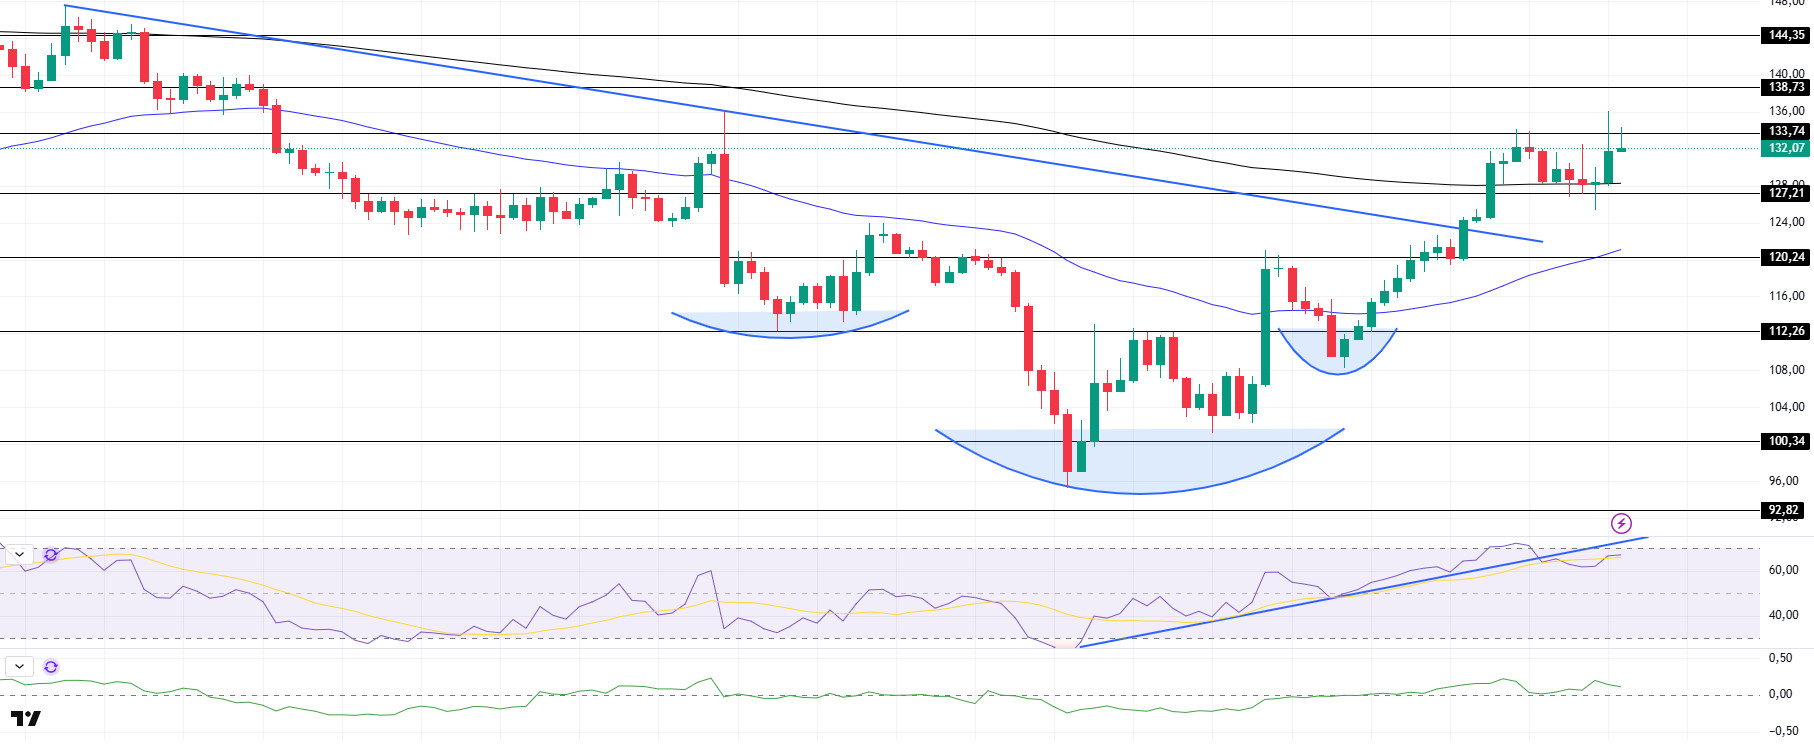
SOL continued its bullish run over the weekend. The asset broke the strong resistance level of $127.21 and the moving average of 200 EMA (Black Line) to the upside. It tested the strong resistance level of 133.74 twice as resistance but failed to break it and retreated slightly. Currently, it is preparing to test this level again. On the other hand, the reverse shoulder-head-shoulder pattern should be taken into consideration. On the 4-hour timeframe, the 50 EMA (Blue Line) remained below the 200 EMA (Black Line). This could continue the decline in the medium term. At the same time, the price started moving above the two moving averages. This suggests that buyers are becoming more dominant in the market. The Chaikin Money Flow (CMF)20 indicator is also at a positive level. However, the negative daily volume may move CMF back into negative territory. However, Relative Strength Index (RSI)14 fell below the trend, failing to maintain the uptrend that started on April 7, but the buying dominance did not disappear. This could push the price higher. The $144.35 level appears as a resistance point in the rises driven by the upcoming macroeconomic data and the news in the Solana ecosystem. If it breaks here, the rise may continue. In case of retracements for the opposite reasons or due to profit sales, the support level of $ 120.24 can be triggered. If the price comes to these support levels, a potential bullish opportunity may arise if momentum increases.
Supports 127.21 – 120.24 – 112.26
Resistances 133.74 – 138.73 – 144.35
DOGE/USDT
He reported that DOGE whales bought about 1.83 billion DOGEs worth about 640.5 million dollars over a two-day period.
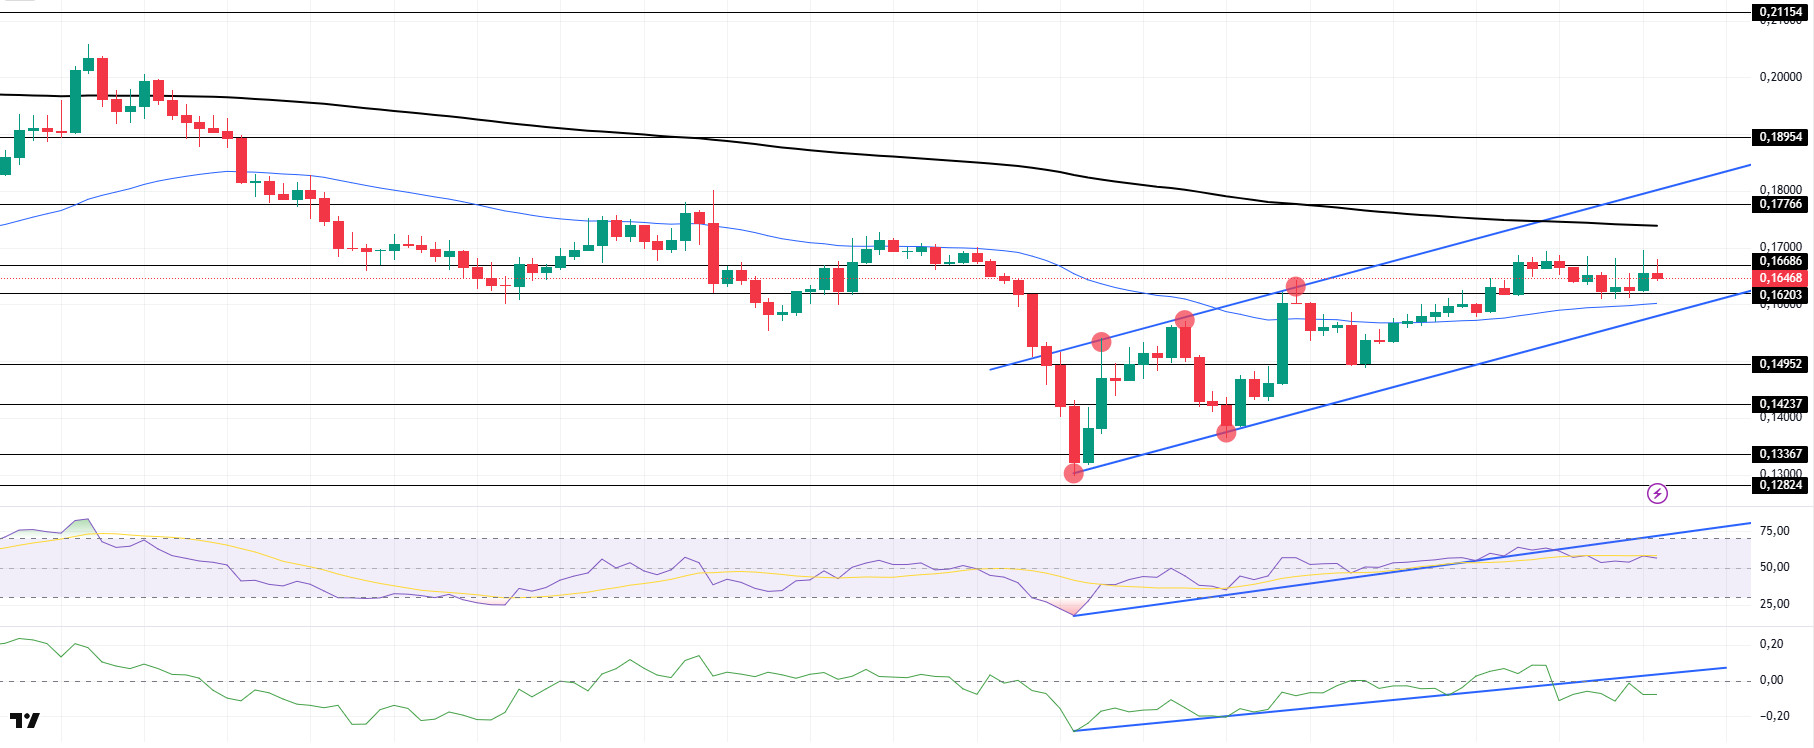
DOGE followed a sideways trend over the weekend. Although the asset tested the resistance level of $0.16686 multiple times, it failed to break it and narrowed to a narrow band of $0.16203 – $0.16686. However, the price managed to stay above the 50 EMA (Blue Line), the moving average, and continues to be at the mid-level of the uptrend that started on April 7. On the 4-hour timeframe, the 50 EMA (Blue Line) remains below the 200 EMA (Black Line). This could mean that the decline could continue in the medium term. However, the price started to price between the two moving averages. This shows us that the price is in the decision-making phase. When we examine the Chaikin Money Flow (CMF)20 indicator, it fell from the neutral level and found value in the negative zone. In addition, the positive 24-hour volume may push CMF back into positive territory. However, the uptrend in CMF, which started on April 7, broke downwards. This may continue the decline. On the other hand, Relative Strength Index (RSI)14 is in the middle zone of the positive level and has broken the uptrend that started on April 7. This may cause a slight pullback. The $0.16686 level stands out as a very strong resistance point in the rises due to political reasons, macroeconomic data and innovations in the DOGE coin. In case of possible pullbacks due to political, macroeconomic reasons or negativities in the ecosystem, the $ 0.16203 level, which is a strong support place, is an important support place. If the price reaches these support levels, a potential bullish opportunity may arise if momentum increases.
Supports 0.16203 – 0.14952 – 014237
Resistances 0.16686 – 0.17766 – 0.18954
LEGAL NOTICE
The investment information, comments and recommendations contained herein do not constitute investment advice. Investment advisory services are provided individually by authorized institutions taking into account the risk and return preferences of individuals. The comments and recommendations contained herein are of a general nature. These recommendations may not be suitable for your financial situation and risk and return preferences. Therefore, making an investment decision based solely on the information contained herein may not produce results in line with your expectations.
