
TECHNICAL ANALYSIS
BTC/USDT
In his speech at the Economic Club of Chicago, Fed Chairman Jerome Powell emphasized that the US economy is still strong despite high uncertainties. Stating that risks arising from trade policies have led to a decline in business and consumer confidence, Powell said that it is appropriate for the Fed to maintain its “wait-and-see” strategy in the current environment. On the crypto side, Bitcoin miners sold 40% of the BTC they produced in March, reaching the highest sales rate since October 2024. On the Bitcoin spot ETFs front, there was a net outflow of 170 million dollars, while the biggest outflow came from the Fidelity FBTC fund with 114 million dollars. In the data set, we will follow US unemployment claims today.
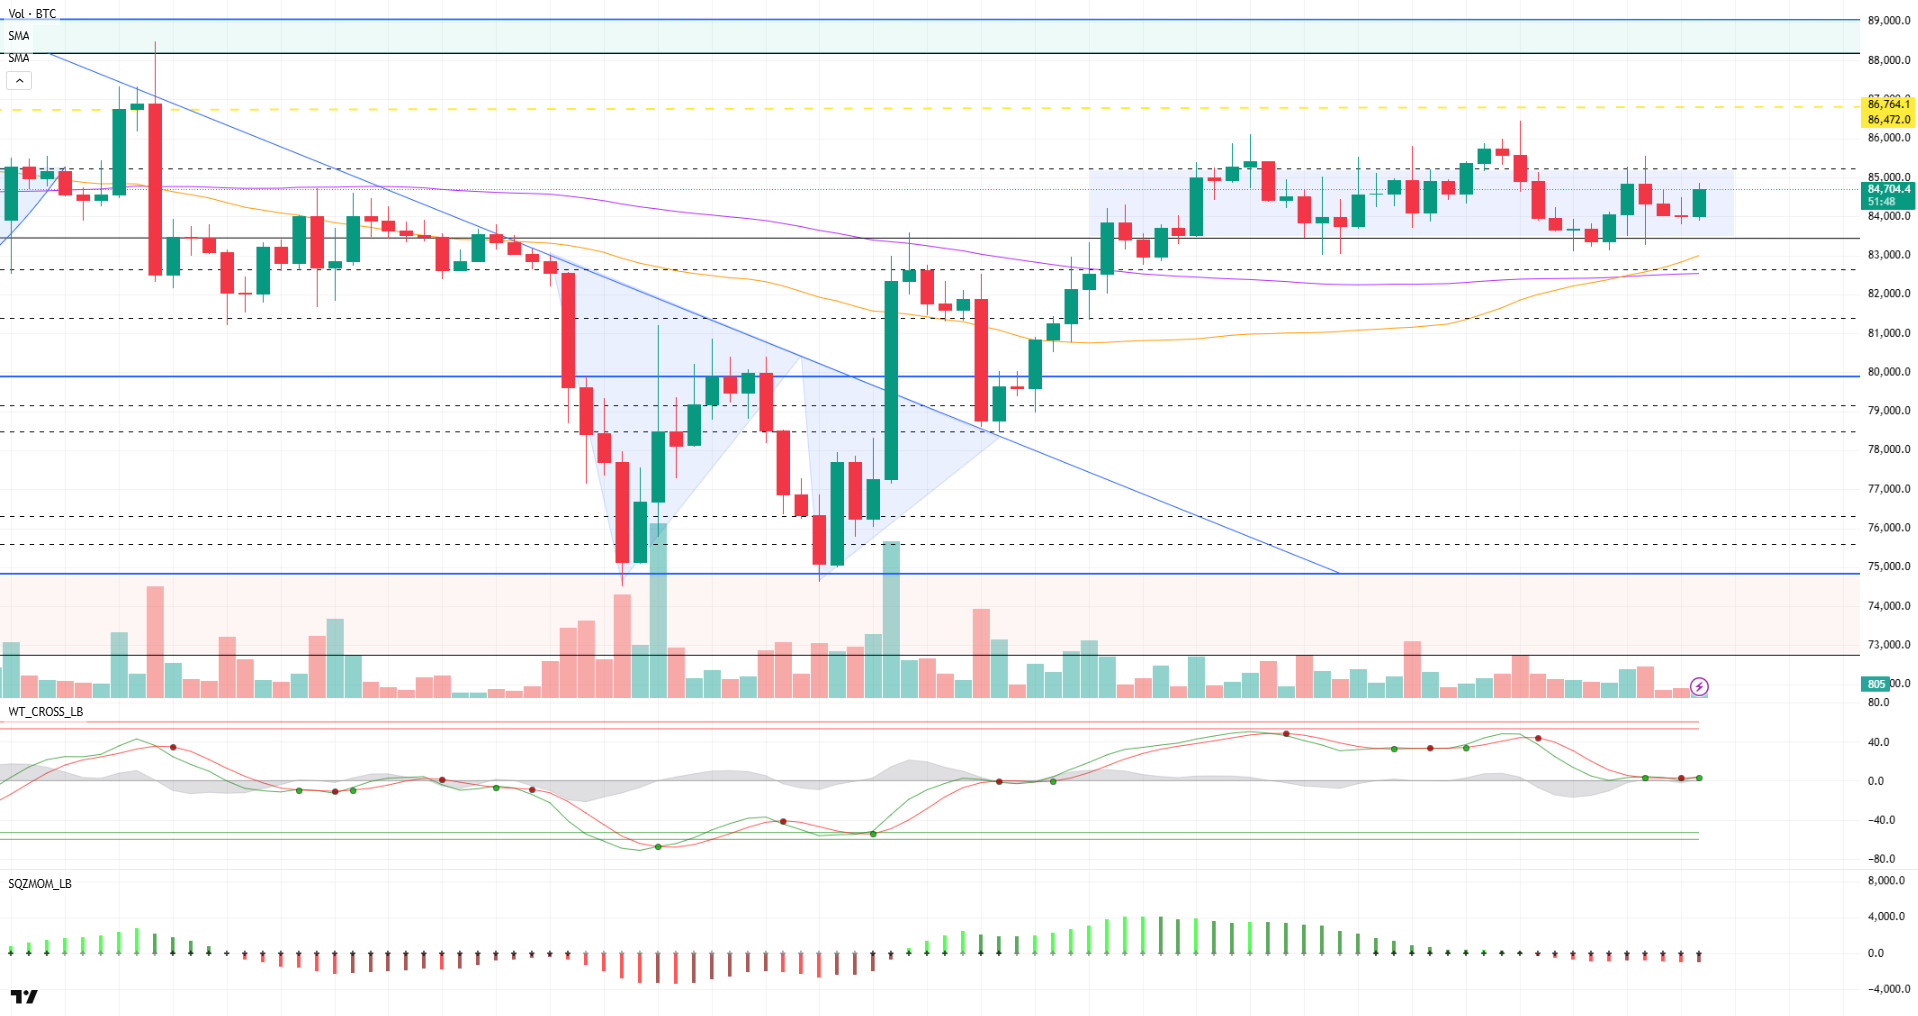
When we look at the technical outlook, it is seen that BTC experienced a sharp retreat from the 85,000 band to the 83,500-support level with the increased volatility after Fed Chairman Powell’s statements yesterday. However, after this decline, the price has recovered again and has risen to 84,700 as of the moment of writing this analysis. BTC continues to consolidate in a horizontal band range during this period. This time, the Wave Trend Oscillator started to generate trading signals above the midline, indicating a lack of direction in the market. Momentum indicators are still weak, which reveals that the rise is not supported by a strong momentum. While the spot ETF data, which we evaluate together with the technical, continues to maintain its negative image, it is worth noting that the area indicated by the yellow dashed line in the liquidation data contains intense short accumulation. With yesterday’s movement, we can say that buyers also accumulated just below the 83,000 band. As short positions are dominant in terms of market structure, we can state that short positions may be the first target short positions in liquidity cleaning and that the price may gain momentum with the break of the 85,200-resistance level. Another technical development that supports this possibility is that the SMA 50 line has cut the SMA 100 line from below. This technical signal makes the possibility of bullishness in the short term a little more prominent. On the other hand, the 83,500 level remains a strong support point. Persistence above this level will continue to be considered as a positive parameter for the market.
Supports 83,500 – 81,500 – 80,000
Resistances 85,200 – 86,600 – 89.000
ETH/USDT
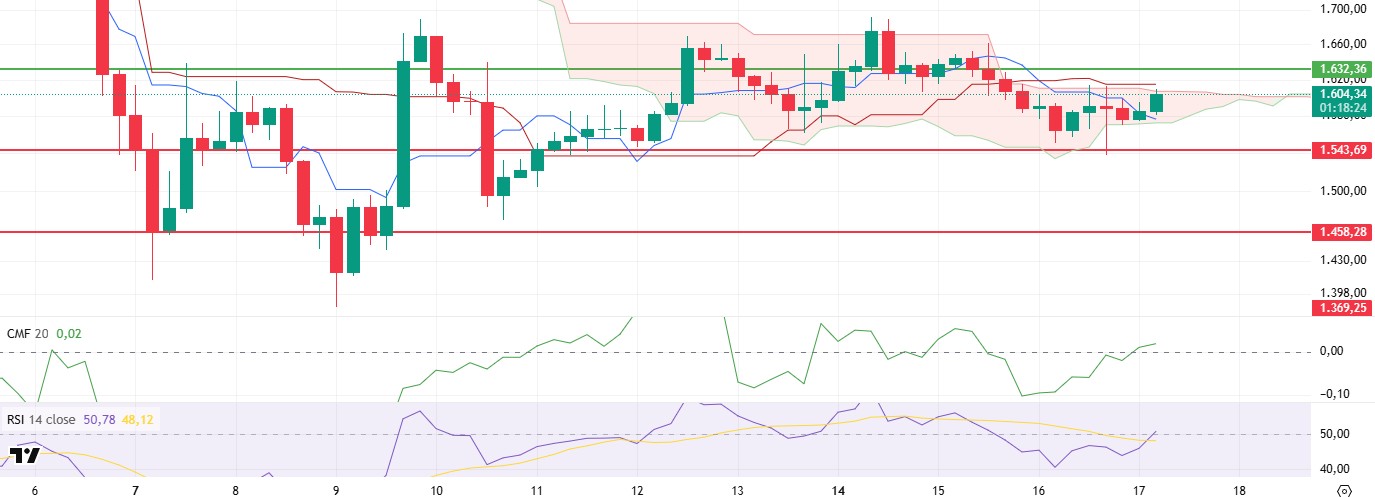
ETH retreated to the $1,543 level yesterday evening amid the uncertainty created by FED chairman Jerome Powell’s speech and weakness in technical indicators. This was an important price band that has worked as a support in the past, so it was once again an area where buyers stepped in. With the increase in spot demand in the morning hours, ETH managed to rebound strongly and rise again to the kumo cloud resistance on the ichimoku indicator.
On the technical indicators side, especially the Chaikin Money Flow (CMF) indicator showed a remarkable recovery. CMF, which moved sharply into negative territory yesterday due to intense selling pressure, recovered rapidly with the price recovery this morning and moved back into positive territory. This indicates that market liquidity has shifted back to buyers and capital inflows have increased. On the other hand, the Relative Strength Index (RSI) indicator has also crossed an important threshold and moved above the based MA line. This move indicates that momentum is gaining upside strength and price action is gaining momentum. The RSI’s attempt to hold this area confirms that the positive outlook dominates the market in the short term. Looking at the Ichimoku indicator, it is seen that the price is still priced in the kumo cloud. This shows that a clear breakdown in the direction of the market has not yet formed, and uncertainty continues. The fact that the tenkan level is still below the kijun level continues to produce a signal of weakness in terms of the short-term trend. However, the fact that the price is not hanging below the kumo cloud shows that buyers have not given up control and the upside potential is still on the table.
When the general outlook is evaluated, the upward movement can be expected to accelerate if the ETH price breaks the kumo cloud resistance zone between $1,610 and $1,632 upwards due to the recovery in technical indicators. In case of persistence above these levels, new targets may come to the agenda. In a contrary scenario, that is, if the price comes under pressure again and sags below the kumo cloud, the support of $1,543 can be tested once again, and this region remains critical for short-term direction determination.
Top of Form
Below the Form
Supports 1,543 – 1,458 – 1,369
Resistances 1,632 – 1,756 – 1,925
XRP/USDT
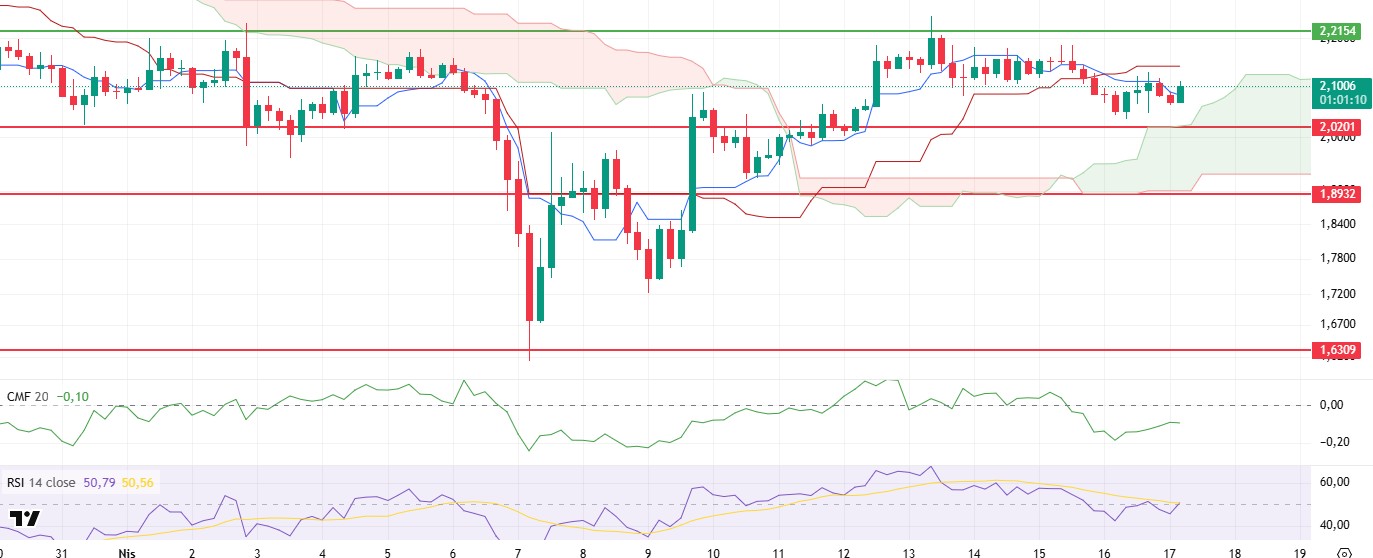
Despite the general pullback observed in the crypto market yesterday evening, XRP maintained a relatively strong stance and found support at the $2.04 level. This region stood out as a critical threshold where short-term buyers re-engaged and began to stabilize the price. With the increased spot buying in the morning hours, the price managed to exceed the $2.10 level again. This movement shows that despite the general weakness of the market, XRP maintains its strong stance and the short-term recovery trend continues.
In terms of technical indicators, the Chaikin Money Flow (CMF) indicator is showing weakness despite the positive price action. CMF has been trending sideways upwards in the negative territory, indicating that despite the buying in the futures market, buying in the spot markets has remained limited. The fact that CMF remains in this zone suggests that capital inflows are weak and the uptrend is mostly based on short-term buying interest. In contrast, the Relative Strength Index (RSI) indicator is showing a positive divergence. The RSI has gained upward momentum, breaking through the based MA line. This outlook suggests that buying appetite is increasing and the technical upside potential is gaining strength. This strengthening in the RSI supports the price’s effort to hold at current levels. On the Ichimoku indicator, the price breaking above the tenkan level stands out as a positive signal in the short-term trend. This movement shows the market’s willingness to break through short-term resistances, and the upward trend is gaining strength. However, for a more meaningful technical transformation to be confirmed, it is critical for the price to exceed the kijun resistance at the $2.14 level. Persistence above this level may pave the way for a retest of the $2.21 level.
As a result, although the negative structure in the CMF indicator has not yet been completely broken, the recovery trend in other technical indicators continues. This indicates that buyers are regaining strength in the short term. While the $2.14 level stands out as the key resistance point for the current recovery to continue, the $2.02 level is the most important support below. If this support is broken, the possibility that the selling pressure will increase, and the price will go to a deeper correction should not be ignored.
Supports 2.0201- 1.8932 – 1.6309
Resistances 2.2154 – 2.3938 – 2.4721
SOL/USDT
Radium has officially launched Launch Lab; a cutting-edge token launch platform aimed at strengthening the Solana ecosystem following the departure of Pump.fun.
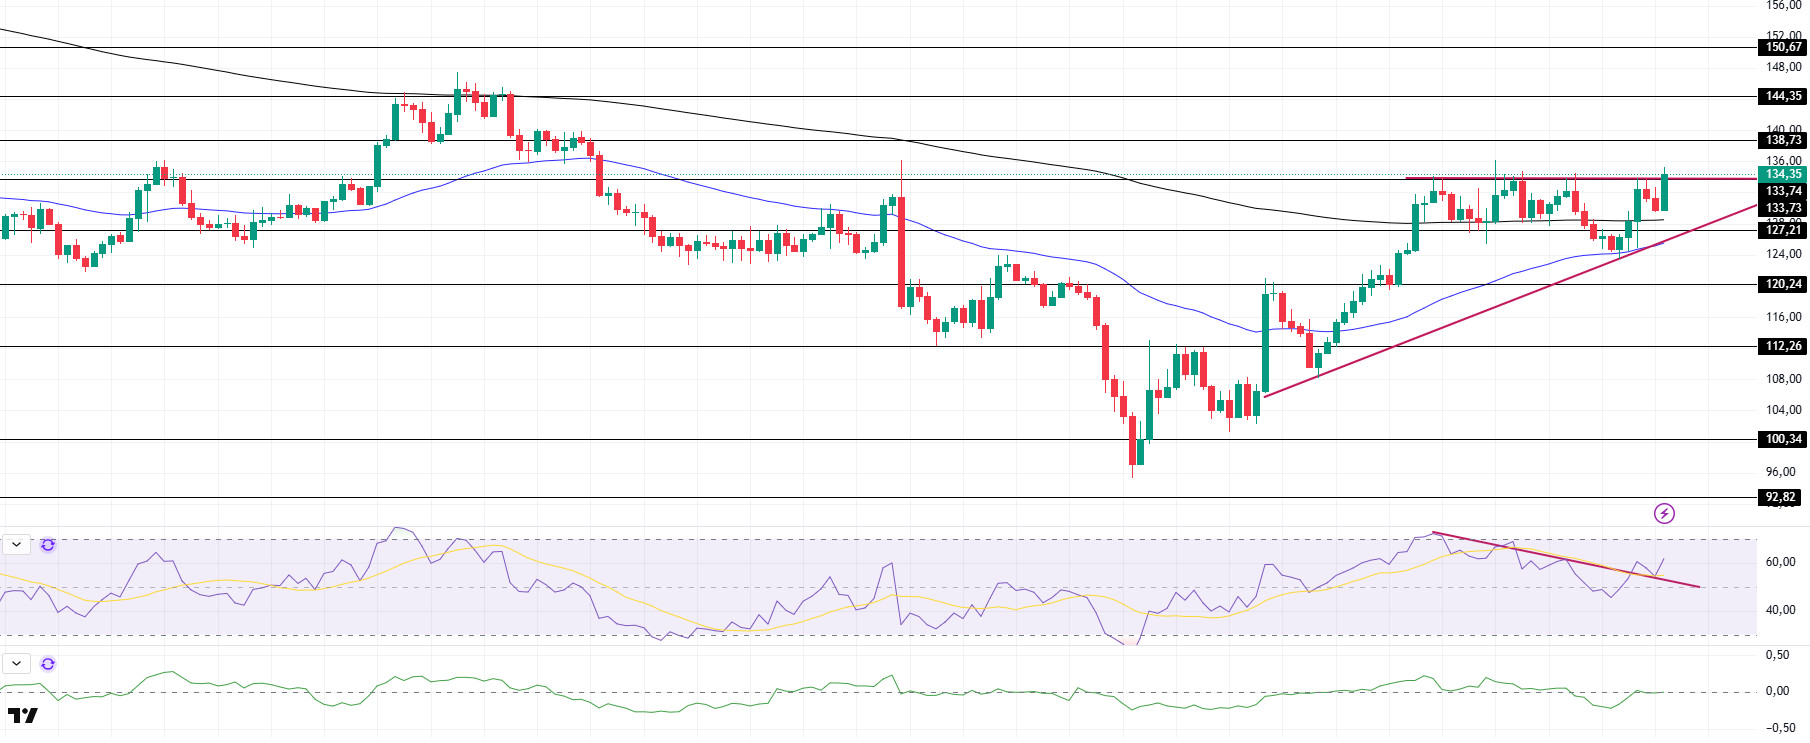
SOL continued its ascent. The asset is currently testing the $133.74 level, the resistance of the ascending triangle pattern. The price, which has tested this level 3 times before, failed to break it and started to rise with support from the support of the ascending triangle pattern and the 50 EMA (Blue Line). On the 4-hour timeframe, the 50 EMA (Blue Line) is below the 200 EMA (Black Line). This could continue the decline in the medium term. At the same time, the price started moving above the two moving averages. This shows that there is buying pressure in the market. The Chaikin Money Flow (CMF)20 indicator is at a neutral level. However, positive daily volume may move CMF to the positive area. Relative Strength Index (RSI)14, on the other hand, broke the downtrend that started on April 12 to the upside and accelerated from there, turning the downtrend into a support zone. This may increase buying pressure. The $133.74 level appears as a resistance point in the rises driven by the upcoming macroeconomic data and the news in the Solana ecosystem. If it breaks here, the rise may continue. In case of retracements for the opposite reasons or due to profit sales, the support level of $127.21 can be triggered. If the price comes to these support levels, a potential bullish opportunity may arise if momentum increases.
Supports 127.21 – 120.24 – 112.26
Resistances 133.74 – 138.73 – 144.35
DOGE/USDT
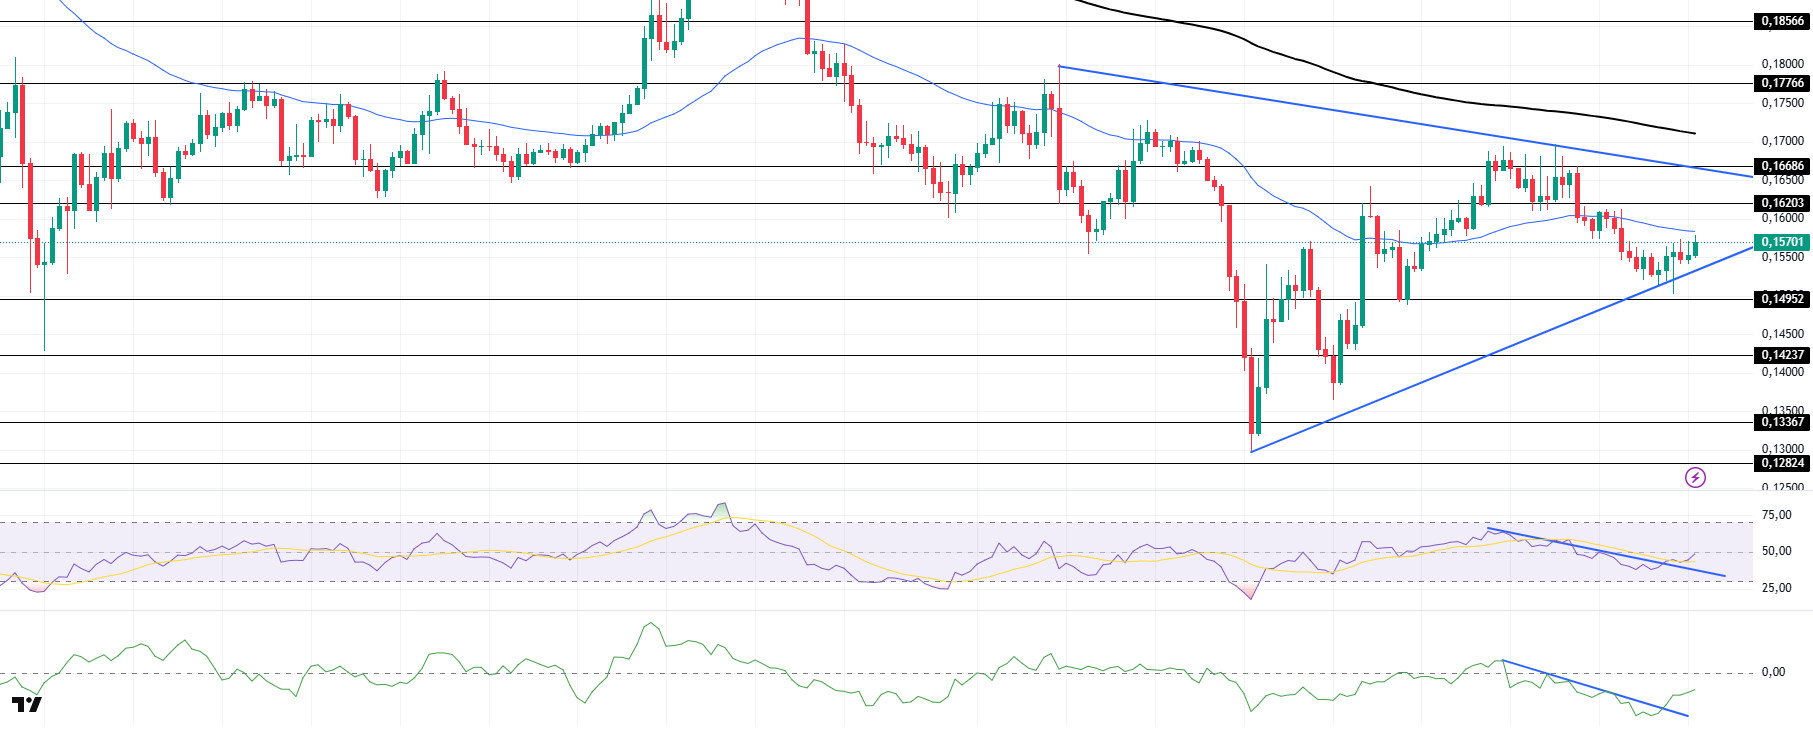
DOGE continues to move within a symmetrical triangle pattern. The asset is poised to test the moving average of 50 EMA (Blue Line) as resistance. The slightly bearish price accelerated and turned bullish, taking support from the base level of the symmetrical triangle pattern. On the 4-hour timeframe, the 50 EMA (Blue Line) remains below the 200 EMA (Black Line). This may mean that the decline may continue in the medium term. However, the price continued to price below the two moving averages. This suggests that selling pressure is increasing. When we examine the Chaikin Money Flow (CMF)20 indicator, it continued to be in negative territory. In addition, the negative 24-hour volume may increase the retracement of CMF. However, we see that this trend has broken upwards as money outflows decreased. On the other hand, Relative Strength Index (RSI)14 is at neutral level and broke the downtrend that started on April 12. This could be a bullish harbinger. The level of 0.16686 dollars is a very strong resistance point in the rises due to political reasons, macroeconomic data and innovations in the DOGE coin. In case of possible retracements due to political, macroeconomic reasons or negativities in the ecosystem, the $ 0.14952 level, which is a strong support place, is an important support place. If the price reaches these support levels, a potential bullish opportunity may arise if momentum increases.
Supports 0.14952 – 014237 – 0.13367
Resistances 0.16203 – 0.16686 – 0.17766
Legal Notice
The investment information, comments and recommendations contained herein do not constitute investment advice. Investment advisory services are provided individually by authorized institutions taking into account the risk and return preferences of individuals. The comments and recommendations contained herein are of a general nature. These recommendations may not be suitable for your financial situation and risk and return preferences. Therefore, making an investment decision based solely on the information contained herein may not produce results in line with your expectations.
