
TECHNICAL ANALYSIS
BTC/USDT
The global economic agenda is being shaped by Trump’s trade statements and the debate over Fed Chair Powell. US President Donald Trump said that there will be fair trade deals with Italy and China and that this process will not be rushed. On the other hand, Senator Elizabeth Warren warned that if Trump dismisses Powell, there could be a collapse in the markets. On the crypto side, a net inflow of 108 million dollars was recorded in Bitcoin spot ETFs yesterday. In the data set, a total of 1.95 billion dollars of open positions in the Bitcoin options market expire today. The “max pain” level set for these contracts is $ 82,000.
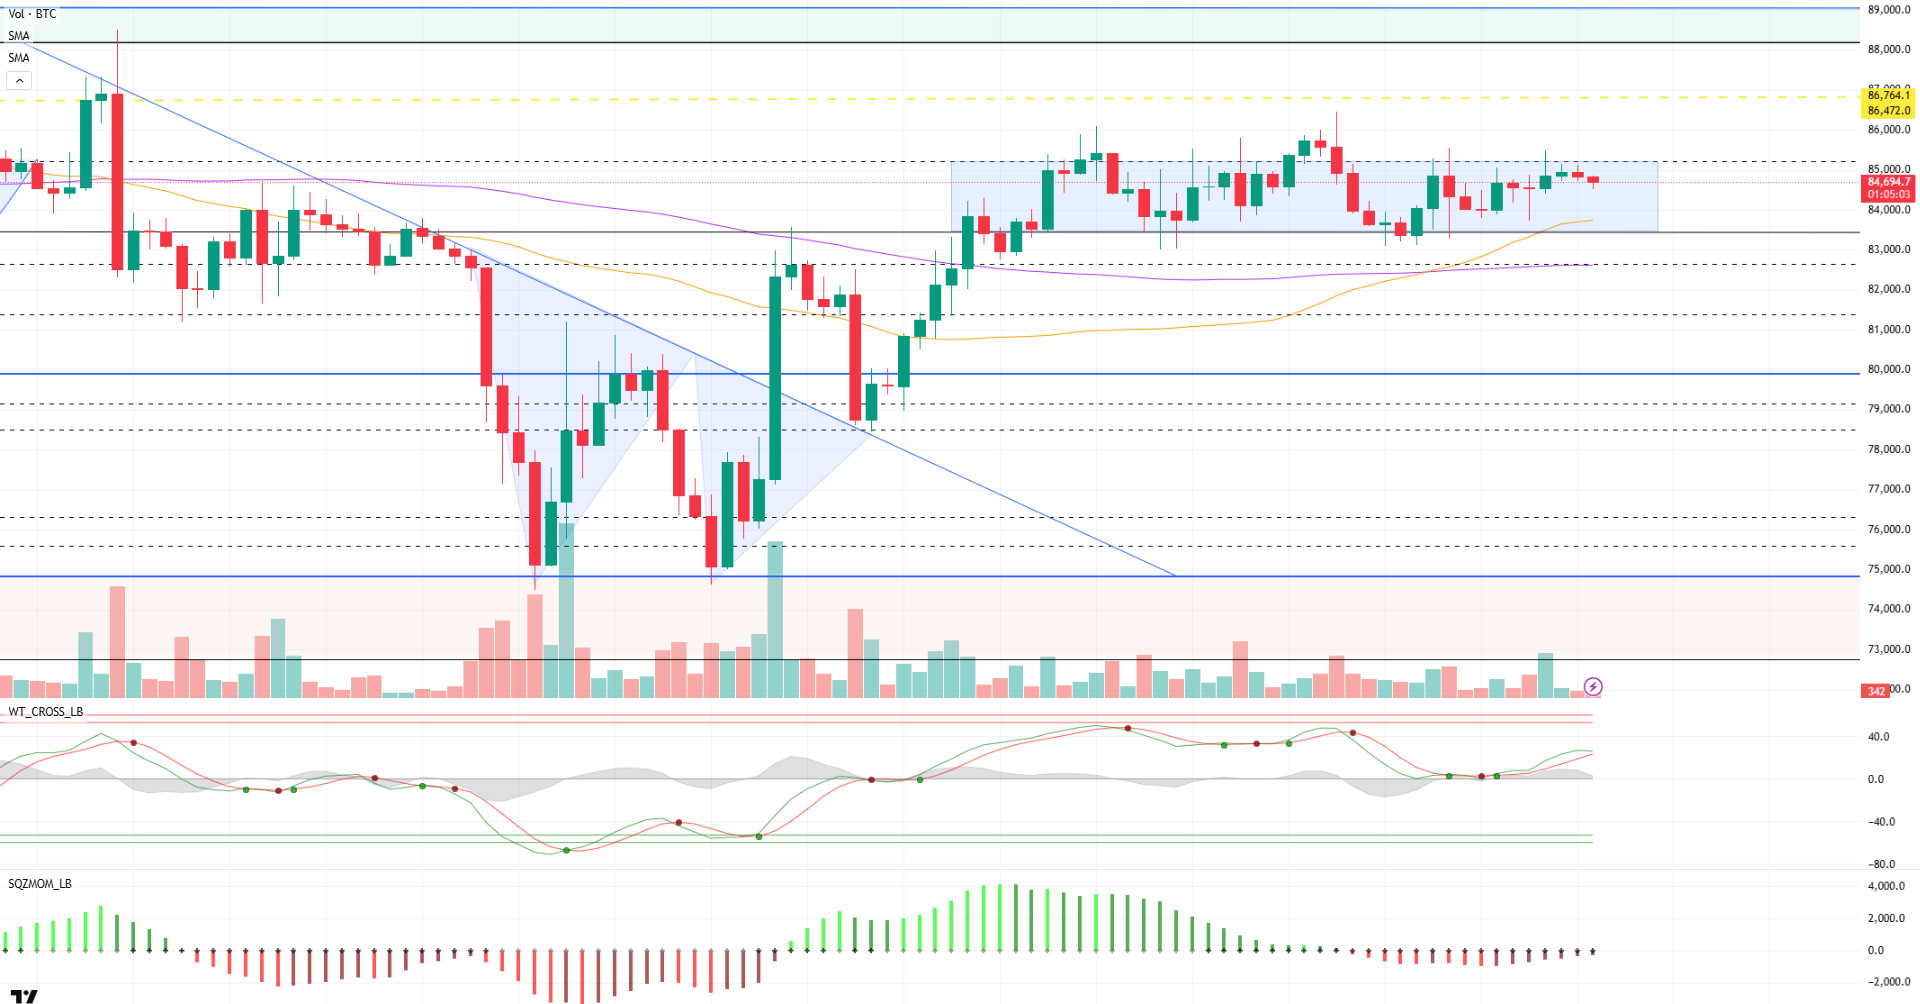
Looking at the technical outlook, BTC continues to consolidate in a sideways range and tested the 85,200 level once again. Although this level has been tested many times since April 11, there has not yet been an upside breakout. This makes it a critical technical resistance point. BTC’s price structure continues to point to a high tight flag pattern, while the wave trend oscillator continues to generate a weakening buy signal. The short-term moving averages also support an optimistic technical sentiment. However, despite this technical positivity, the lack of a driving force on the fundamental side on behalf of the market reduces the risk appetite and causes the upward movement to remain limited. The price is seen moving in a tight band between the 83,500-support level and the 85,200-resistance level we mentioned earlier. As long as it remains in this range, the 85,200 level will remain important as a breakout point. Exceeding this level in a voluminous way may pave the way for an upward movement. According to liquidation data, it is seen that intense short positions have accumulated in the range of 86,472 – 86,764. This indicates that short-term selling pressure may increase if the price reaches these levels. On the other hand, the accumulation of long positions in the 82,000 – 83,500 band attracts attention and makes this area a strong support area.
Supports 83,500 – 81,500 – 80,000
Resistances 85,200 – 86,600 – 89.000
ETH/USDT
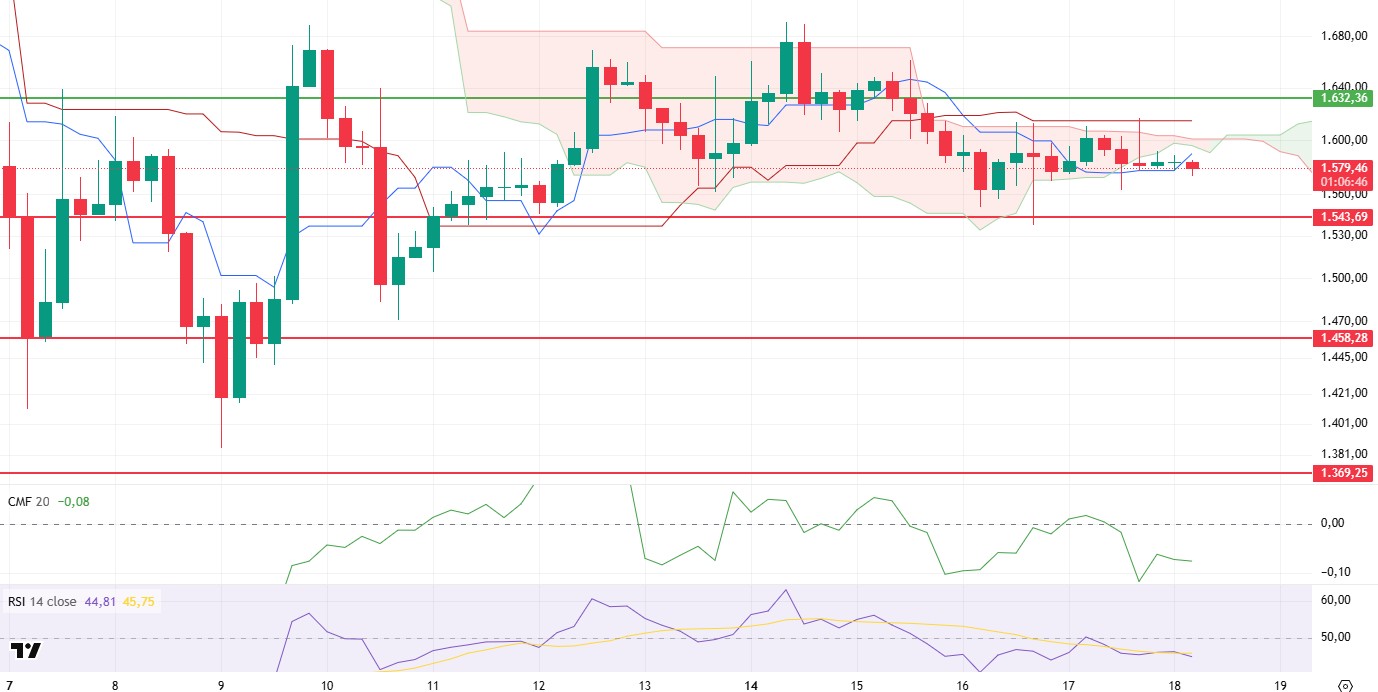
ETH, which rose up to the kijun level, the importance of which was emphasized in yesterday evening’s analysis, turned its direction down again with the selling pressure it faced at this level. With the rejection of the price from the Kijun level, pricing took place below both the tenkan level on the Ichimoku indicator and the kumo cloud. This technical structure indicates that the downward trend is gaining strength in the short term. In particular, the drop below the $1,580 level indicates that buyers are weakening and sellers are becoming more active in the market.
When technical indicators are analyzed, it is observed that Chaikin Money Flow (CMF) data continued its downward movement after moving into negative territory. This indicates that the amount of capital leaving the market has increased and liquidity outflows in general continue. On the other hand, on the Ichimoku indicator, the fact that the price has fallen below both the Tenkan and kumo clouds further weakens the technical outlook, while these level losses are among the factors that increase the pressure on the market. Momentum indicators similarly show that the downward trend continues. This both confirms the negativity in the technical outlook and limits the possibility of a potential recovery at this stage.
In this context, the possibility of retesting the $1,543 level as support during the day is at the forefront. A downside break of this support could lead to deeper selling and sharper price retracements. In order for an upward recovery to begin, the Kijun level must be exceeded in the first place, and then the horizontal resistance at $1,632 must be broken in volume. Unless persistence is achieved above these two technical levels, the possibility that the rises will remain limited and the current pressure will continue is considered as a strong scenario.
Top of Form
Below the Form
Supports 1,543 – 1,458 – 1,369
Resistances 1,632 – 1,756 – 1,925
XRP/USDT
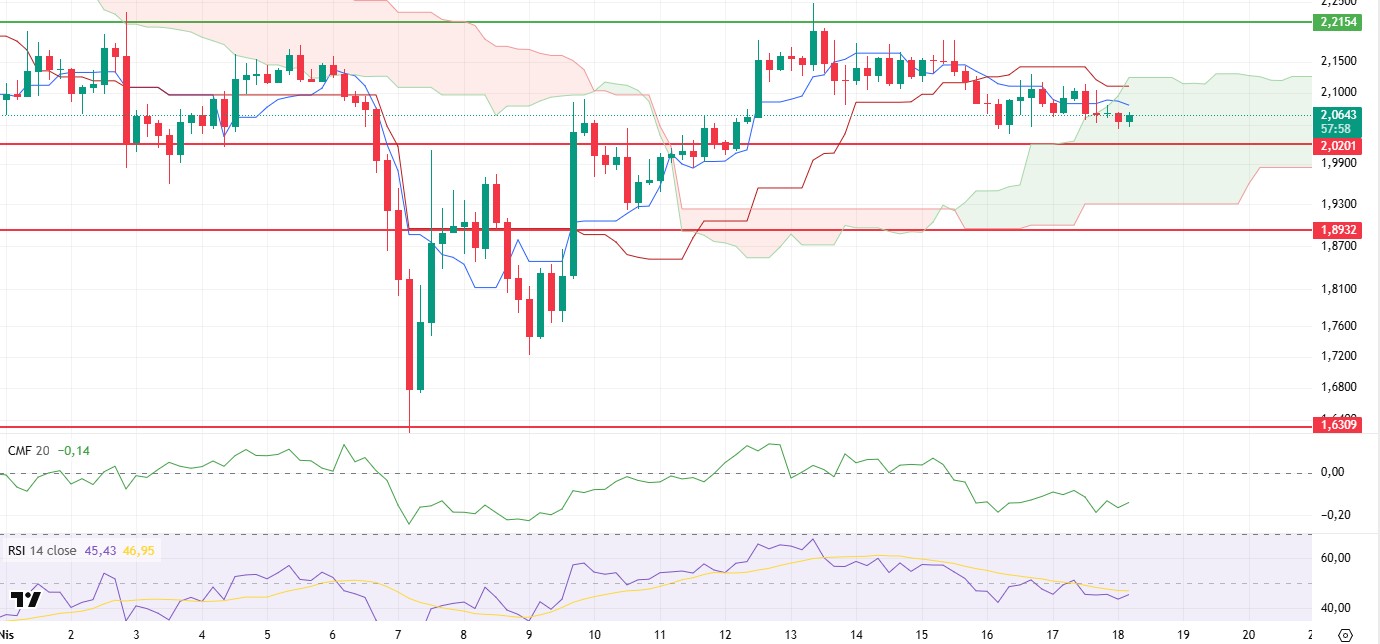
The slight pullback observed in the cryptocurrency market yesterday evening also had an impact on XRP. Although the price action that dipped below the Tenkan level in this process signaled a short-term technical weakness, XRP’s re-pricing within the boundaries of the kumo cloud shows that there is no significant deterioration in the general outlook yet. Although the price’s loss of the Tenkan level produces a negative signal for the Ichimoku indicator in the first place, the fact that it continues to stay within the sand cloud causes this signal to remain unconfirmed and the selling pressure to be limited.
When the Chaikin Money Flow (CMF) indicator is analyzed, it is seen that although the indicator moves in the negative zone, it exhibits a limited upward trend. This suggests that buyers are gradually entering the market and liquidity outflows are decreasing. These recovery signals on the buy side increase the potential for an upside breakout of the current horizontal movement. On the other hand, the slight recovery trends and positive divergence structures observed in momentum indicators are among the technically supportive factors for the price to turn its direction upwards again.
Within the framework of all these technical factors, it is critical for XRP to remain above the $2.02 level for the upward movement to continue. As long as it is maintained above this level, it seems possible for the price to maintain its upward momentum and make new attempts. However, in the event of a possible downward break, if the support of $2.02 is lost, harsh selling pressures may be encountered, and the price may decline towards lower support levels. For this reason, the level of $2.02 should be followed as a decisive threshold in terms of both technical balance and market psychology in the short term.
Supports 2.0201- 1.8932 – 1.6309
Resistances 2.2154 – 2.3938 – 2.4721
SOL/USDT
A centralized exchange has announced significant upgrades to its Solana infrastructure. The improvements include 5x faster block processing and 4x better RPC performance. Galaxy Research has submitted a new proposal to the Solana (SOL) community to reorganize the network’s inflation governance debate with a method called Multiple Election Share Weight Aggregation (MESA), according to a filing published on April 17.
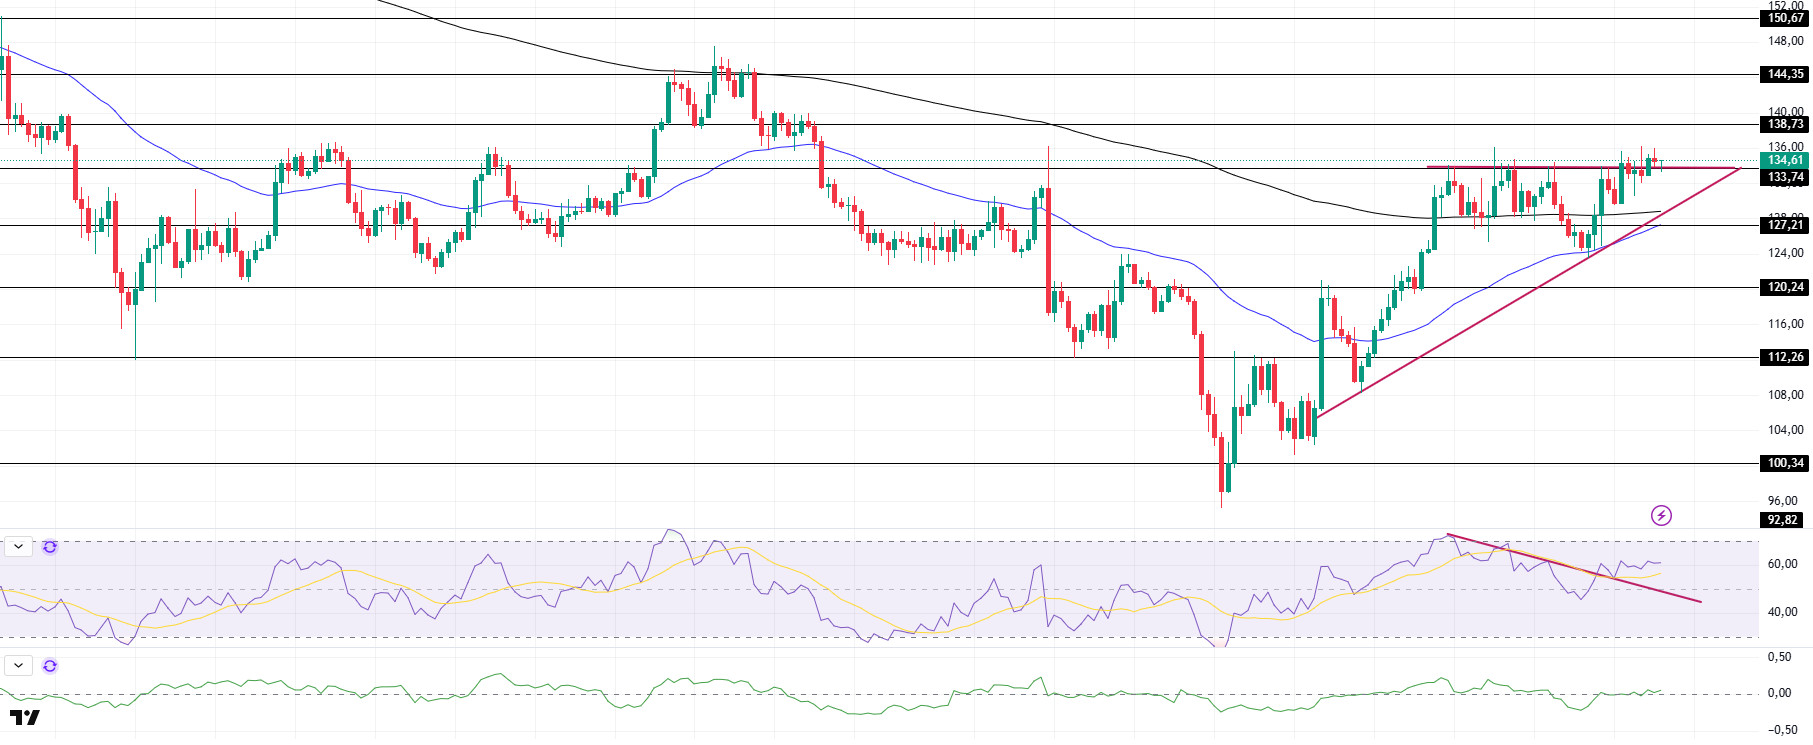
SOL continues its sideways movements. The asset broke the $133.74 level, the resistance of the ascending triangle pattern. But it is currently testing this as support. If it accelerates from here, the $ 144.35 level appears as a strong resistance place. On the 4-hour timeframe, the 50 EMA (Blue Line) is below the 200 EMA (Black Line). This could continue the decline in the medium term. At the same time, the price continues to move above the two moving averages. This shows that there is buying pressure in the market. When we analyze the Chaikin Money Flow (CMF)20 indicator, it is at a neutral level. However, the negative daily volume may move CMF to the negative area. Relative Strength Index (RSI)14 broke the downtrend that started on April 12 to the upside and continues to be above the downtrend. This may increase buying pressure. The $144.35 level appears as a resistance point in the rises driven by the upcoming macroeconomic data and the news in the Solana ecosystem. If it breaks here, the rise may continue. In case of retracements for the opposite reasons or due to profit sales, the support level of $127.21 can be triggered. If the price comes to these support levels, a potential bullish opportunity may arise if momentum increases.
Supports 133.74 – 127.21 – 120.24
Resistances 138.73 – 144.35 – 150.67
DOGE/USDT
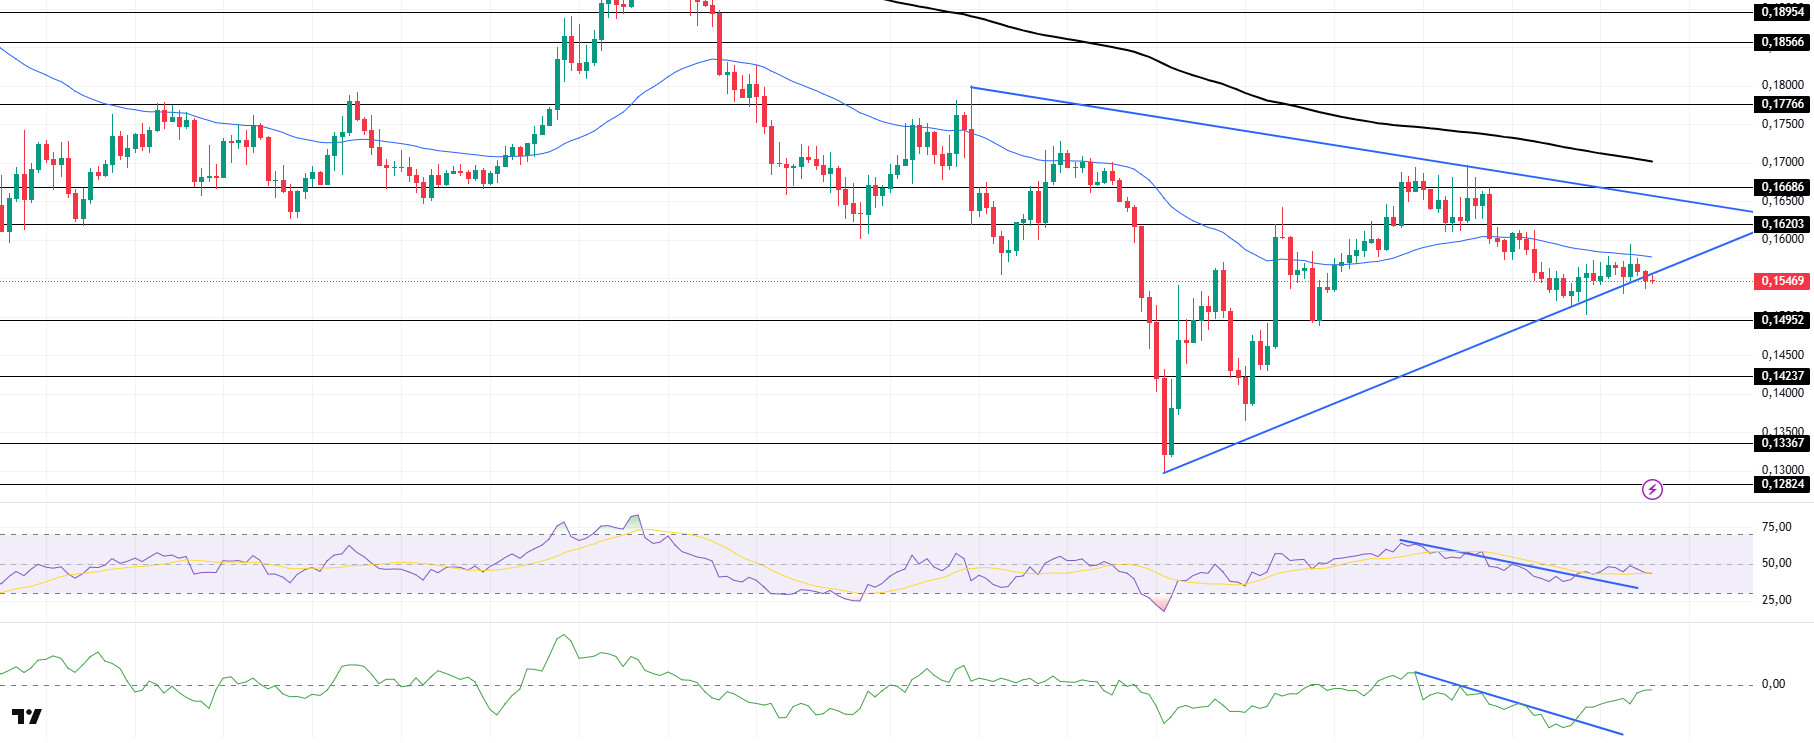
DOGE continues to move sideways. The asset tested the moving average of 50 EMA (Blue Line) as resistance and failed to break it. Slightly declining from here, the price broke the support of the symmetrical triangle pattern and is currently testing this support as resistance. If it fails to break here, the retracement may deepen. On the 4-hour timeframe, the 50 EMA (Blue Line) continues to be below the 200 EMA (Black Line). This could mean that the decline could continue in the medium term. However, the price continued to price below the two moving averages. This shows us that selling pressure continues. When we examine the Chaikin Money Flow (CMF)20 indicator, it continued to be in the negative zone. In addition, the negative 24-hour volume may bring CMF to the middle levels of the negative zone. However, the uptrend that started on April 16 continues. On the other hand, Relative Strength Index (RSI)14 is in the negative zone and broke the downtrend that started on April 12. It is currently testing the base level of the downtrend as support. This could be a bullish harbinger. The $0.16686 level is a very strong resistance in the uptrend due to political reasons, macroeconomic data and innovations in the DOGE coin. In case of possible retracements due to political, macroeconomic reasons or due to negativities in the ecosystem, the $ 0.14952 level, which is a strong support place, is an important support place. If the price reaches these support levels, a potential bullish opportunity may arise if momentum increases.
Supports 0.14952 – 014237 – 0.13367
Resistances 0.16203 – 0.16686 – 0.17766
Legal Notice
The investment information, comments and recommendations contained herein do not constitute investment advice. Investment advisory services are provided individually by authorized institutions taking into account the risk and return preferences of individuals. The comments and recommendations contained herein are of a general nature. These recommendations may not be suitable for your financial situation and risk and return preferences. Therefore, making an investment decision based solely on the information contained herein may not produce results in line with your expectations.
