TECHNICAL ANALYSIS
BTC/USDT
March clearly showed the effects of the correlation between the crypto and traditional markets. The combined market capitalization of 14 publicly traded Bitcoin mining companies plummeted by nearly 25% to a loss of $6 billion. During the same period, Bitcoin suffered sharp pullbacks. On the other hand, yesterday, trade bodies in the UK called on the government to declare “crypto a strategic priority”. Today, eyes turned to US President Donald Trump; The tariff details to be announced are expected to steer the market in terms of their effects, while it is stated that they have been largely priced on crypto before. Japan-based Metaplanet, on the other hand, bought another 160 BTC, bringing its reserve to 4,206 BTC.
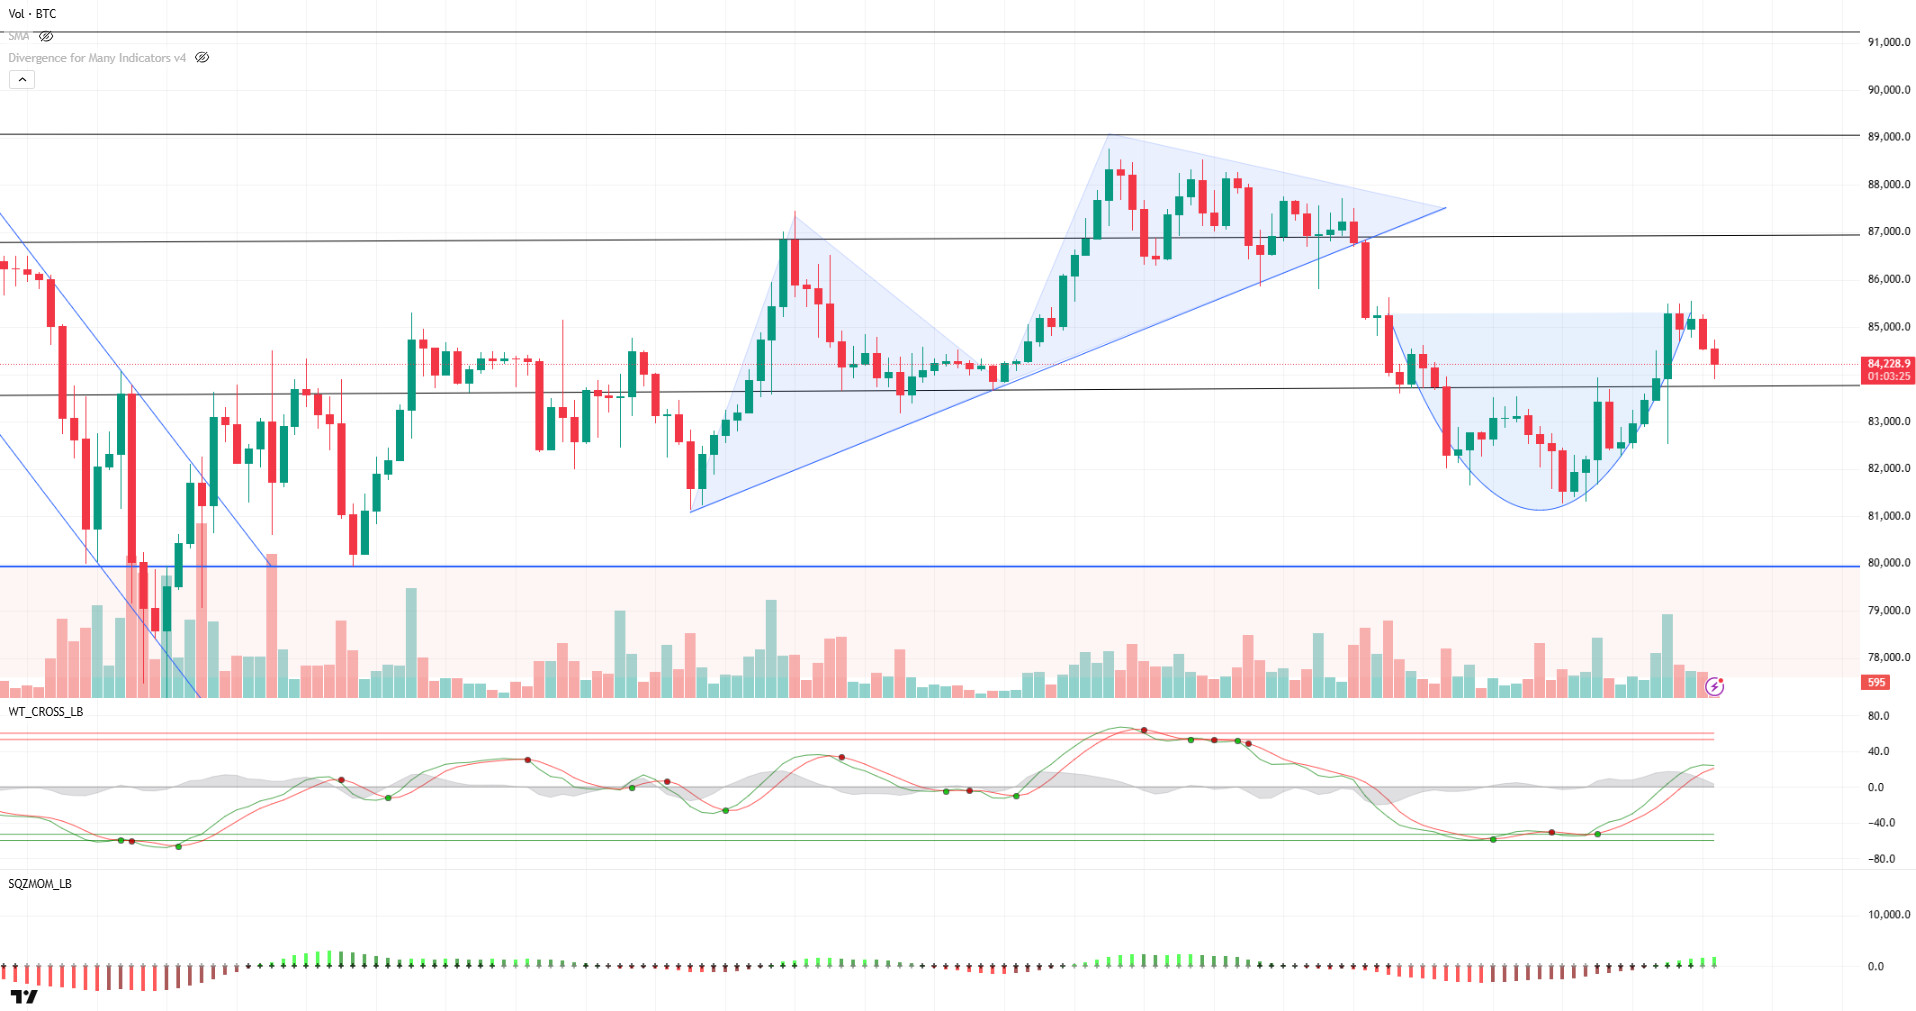
When we look at the technical outlook of BTC with all these developments, we see that the uptrend structure of the past two weeks has been lost and the price has fallen to the 83,500 level, which is an important support point. At this level, after four consecutive candles closed in the 4-hour period, a sharp breakout occurred with increasing selling pressure and BTC tested the 81,300 level. After this decline, the BTC price rebounded and managed to exceed the 83,500 level as the buy signal seen on the Wave Trend Oscillator and momentum indicators gained strength. Subsequently, BTC, which technically forms a bowl pattern, tested the 85,400 level to complete the handle, before turning down again. At the time of writing, BTC is trading at 84,200. However, the weakening buy signal indicates that selling pressure may increase depending on the tariff announcements later in the day. In such a scenario, the price is likely to dip below the 83,500 level again. Liquidation data reveals that low volumes continue due to the uncertainty in the markets and there is no significant concentration of positions in both directions in BTC price. However, the removal of uncertainty about tariffs, especially the clarification of US-side statements, may cause risk appetite to increase again, and this may pave the way for the re-establishment of the upward trend in the medium term. In this context, while the 83,500 level remains important as a support point, exceeding the 86,600 level in the upside scenario may strengthen the upward momentum in the price.
Supports 83,500 – 82,400 – 80,000
Resistances: 86,600 -89,000 – 91,400
ETH/USDT
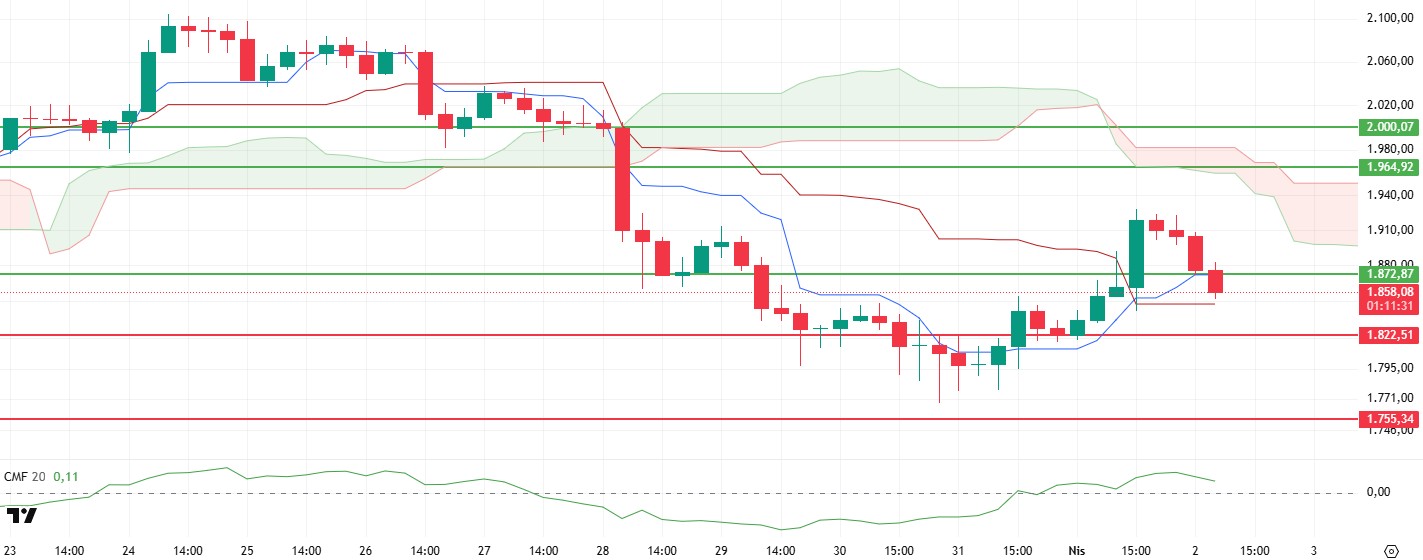
With the bullish movement yesterday, ETH managed to rise up to $1,925, breaking the resistance at the $1,872 level. However, it faced intense selling pressure at this level and fell below the $1,872 level again. With this pullback, some signs of weakness began to be observed in ETH.
An analysis of the Cumulative Volume Delta (CVD) reveals that the bearish move was largely driven by the selling in the spot market. In addition, the significant decline in open interest suggests that long positions have been closed at a high rate. The closure of long positions by investors indicates that short-term bullish expectations have weakened and the market has increased selling pressure. The fact that the Chaikin Money Flow (CMF) indicator did not overreact and remained in the positive zone despite the pullback indicates that the liquidity flow in the market is still positively weighted. When the Ichimoku indicator is analyzed, it is observed that the strong buy signal formed when the tankan level crossed the kijun level upwards during yesterday’s rise in the price did not work and the price fell below the tenkan level. This development suggests that the uptrend is not sustainable and the price tends to weaken in the short term. In the current situation, the price can be expected to hold on to the kijun support that appears in red on the chart. If this support cannot be maintained, the possibility of a deeper retracement may strengthen as selling pressure increases.
Overall, technical indicators and on-chain data suggest continued weakness in ETH price. While it seems likely that the price will fall to the tenkan level, if it finds support from this area, an upward reaction movement could be seen again. However, in case this level is lost, ETH price can be expected to retrace back to the major support at $1,822. On the other hand, if the $1,872 level is breached again, the signal on the Ichimoku indicator could potentially push the price up to the kumo cloud resistance.
Supports 1,822 – 1,755 – 1,540
Resistances 1,872 – 1,964 – 2,000
XRP/USDT
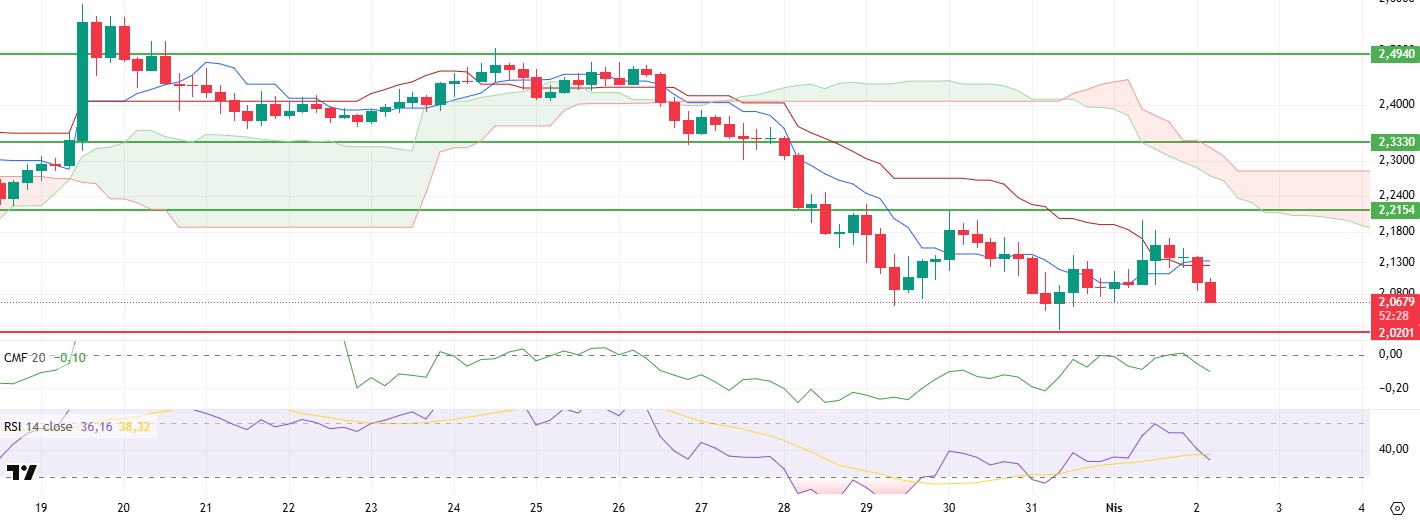
The downtrend in XRP continues. XRP, which converged to the resistance level of $2.21 again with yesterday’s rise, experienced a sharp decline again, rejected from this region. Weakness continues for XRP, which is currently hovering around $2.07.
When technical indicators are analyzed, it is seen that the Relative Strength Index (RSI) has lost its support level and continues its downward movement. There seems to be similar weakness in momentum. Chaikin Money Flow (CMF), which reached the zero line with the recent rise, is similarly moving downwards, indicating that liquidity outflows are increasing. According to the Ichimoku indicator, it can be inferred that for XRP, which lost to tenakn and kijun levels, the decline may continue unless these levels are exceeded.
In summary, with the weakness in technical indicators, it seems possible for the price to retreat to the level of $2.02 during the day. Since this region is a strong support zone, it can be expected that purchases from this region will gain weight in a possible pullback. However, violating this zone may bring deeper declines.
Supports 2.0201 – 1.8932 – 1.6309
Resistances 2.2154 – 2.3330 – 2.4940
SOL/USDT
Miller Whitehouse-Levine, who previously ran the DeFi Education Fund, is launching a new nonprofit focused on advocating for Solana in the national capital. Kristin Smith, a prominent figure in the blockchain community, will leave her position at the Blockchain Association to lead the newly formed Solana Policy Institute. According to BlockBeats, Circle increased its USDC supply on the Solana network by 250 million tokens. On the other hand, PumpSwap DEX reached $10 billion in volume in 10 days and captured 67.4% of the Solana market with a trading volume of $2.43 billion
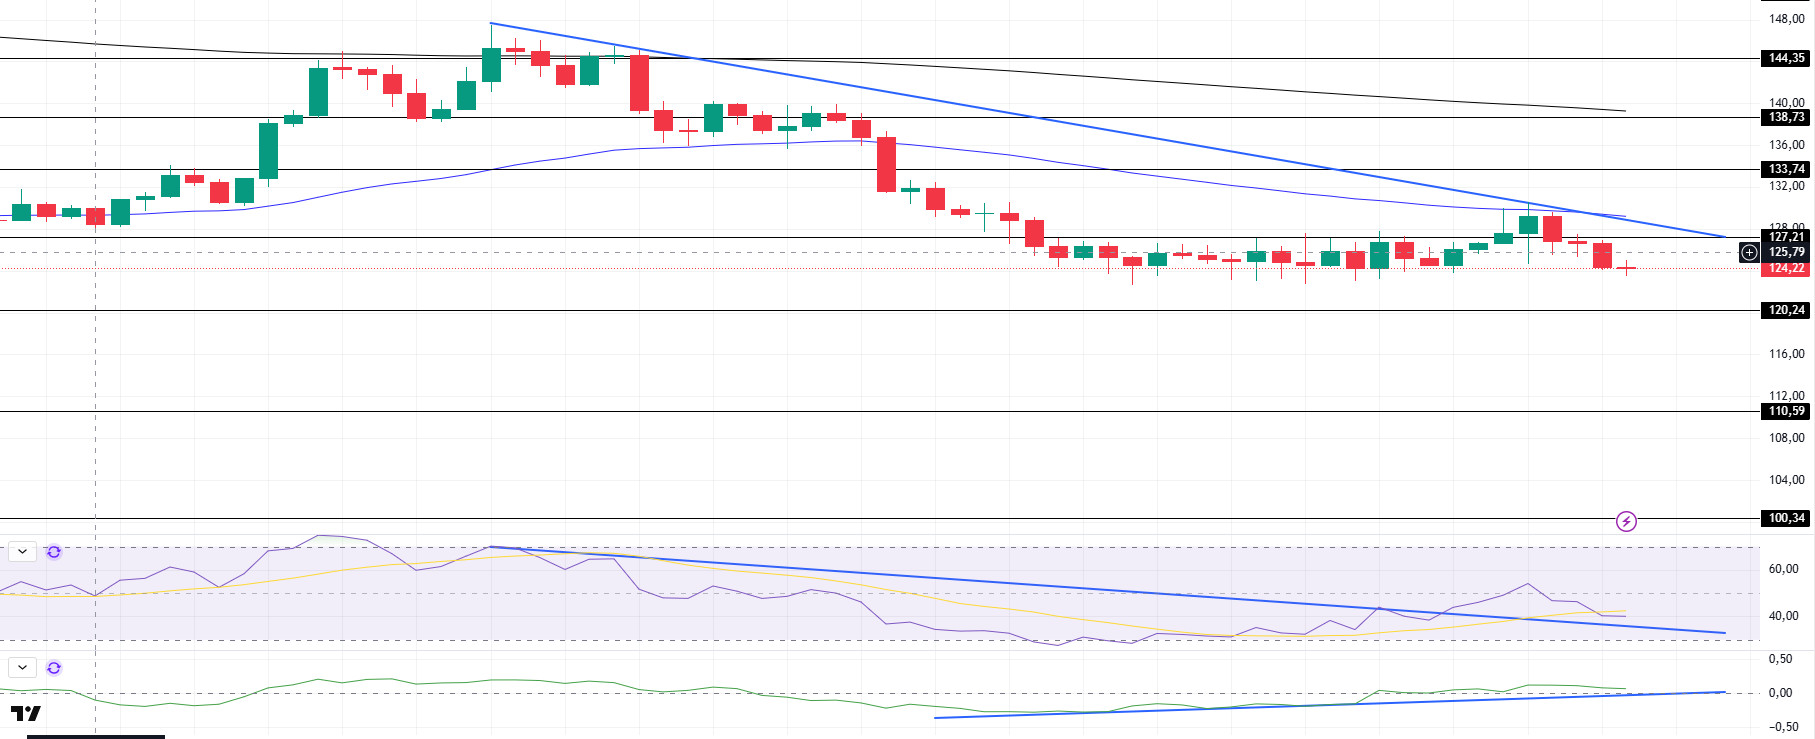
SOL continues to lose value. The asset tested the downtrend that started on March 25 and the 50 EMA (Blue Line) as resistance. However, it failed to break it and experienced a bearish acceleration again. On the 4-hour timeframe, the 50 EMA (Blue Line) remained below the 200 EMA (Black Line). This could deepen the decline further in the medium term. At the same time, the price is moving below the two moving averages again. When we analyze the Chaikin Money Flow (CMF)20 indicator, it is in the positive zone, but the daily volume is balanced, indicating that CMF may continue to be priced in the positive zone. On the other hand, the uptrend that started on March 29 continues in our CMF indicator. However, the Relative Strength Index (RSI)14 indicator retreated to the mid-level of the negative zone. However, it broke the downtrend that has formed since March 24 in an upward direction. This may be a bullish harbinger. The $138.73 level appears as a resistance point in the rises driven by the upcoming macroeconomic data and the news in the Solana ecosystem. If it breaks here, the rise may continue. In case of retracements due to the opposite reasons or profit sales, the support level of $120.24 can be triggered. If the price comes to these support levels, a potential bullish opportunity may arise if momentum increases.
Supports 120.24 – 110.59 – 100.34
Resistances 127.21 – 133.74 – 138.73
DOGE/USDT
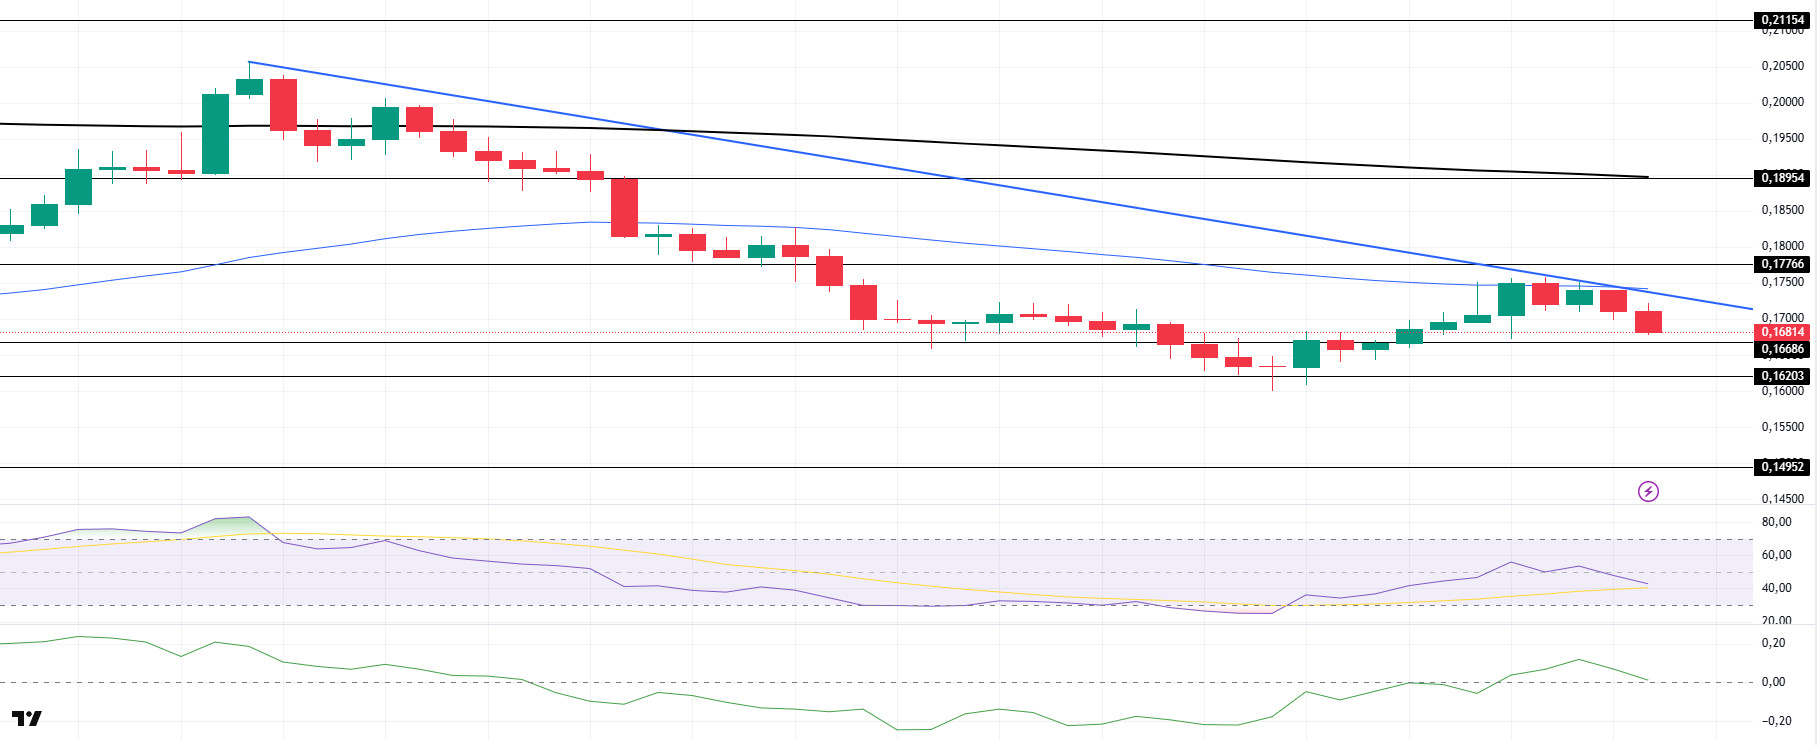
DOGE plunged after Elon Musk said that the efficiency department has nothing to do with Dogecoin. The price continued to stay below the 200 EMA (Black Line), breaking the strong support at $0.18954 and pricing below the 50′ EMA after the statement. As of now, although it tested the 50 EMA (Blue Line) moving average as resistance, it failed to break it and experienced a pullback and continued to be priced below the downtrend that started on March 26. If it fails to break upwards, it may test the $0.16203 level, which is a strong support. On the 4-hour timeframe, the 50 EMA (Blue Line) continues to be below the 200 EMA (Black Line). This could mean that the decline could deepen in the medium term. However, the price has started to price below the two moving averages. The Chaikin Money Flow (CMF)20 indicator is in positive territory. In addition, the negative 24-hour volume may reduce inflows and keep CMF in negative territory. On the other hand, Relative Strength Index (RSI)14 continued to retreat, moving from positive to negative territory and at the same time, it is seen that selling pressure continues. The $0.18954 level stands out as a very strong resistance point in the rises due to political reasons, macroeconomic data and innovations in the DOGE coin. In case of possible retracements due to political, macroeconomic reasons or due to negativities in the ecosystem, the $ 0.16203 level, which is a strong support place, is an important support place. If the price reaches these support levels, a potential bullish opportunity may arise if momentum increases.
Supports 0.16686 – 0.16203 – 014952
Resistances 0.17766 – 0.18954 – 0.21154
LEGAL NOTICE
The investment information, comments and recommendations contained herein do not constitute investment advice. Investment advisory services are provided individually by authorized institutions taking into account the risk and return preferences of individuals. The comments and recommendations contained herein are of a general nature. These recommendations may not be suitable for your financial situation and risk and return preferences. Therefore, making an investment decision based solely on the information contained herein may not produce results in line with your expectations.


