
TECHNICAL ANALYSIS
BTC/USDT
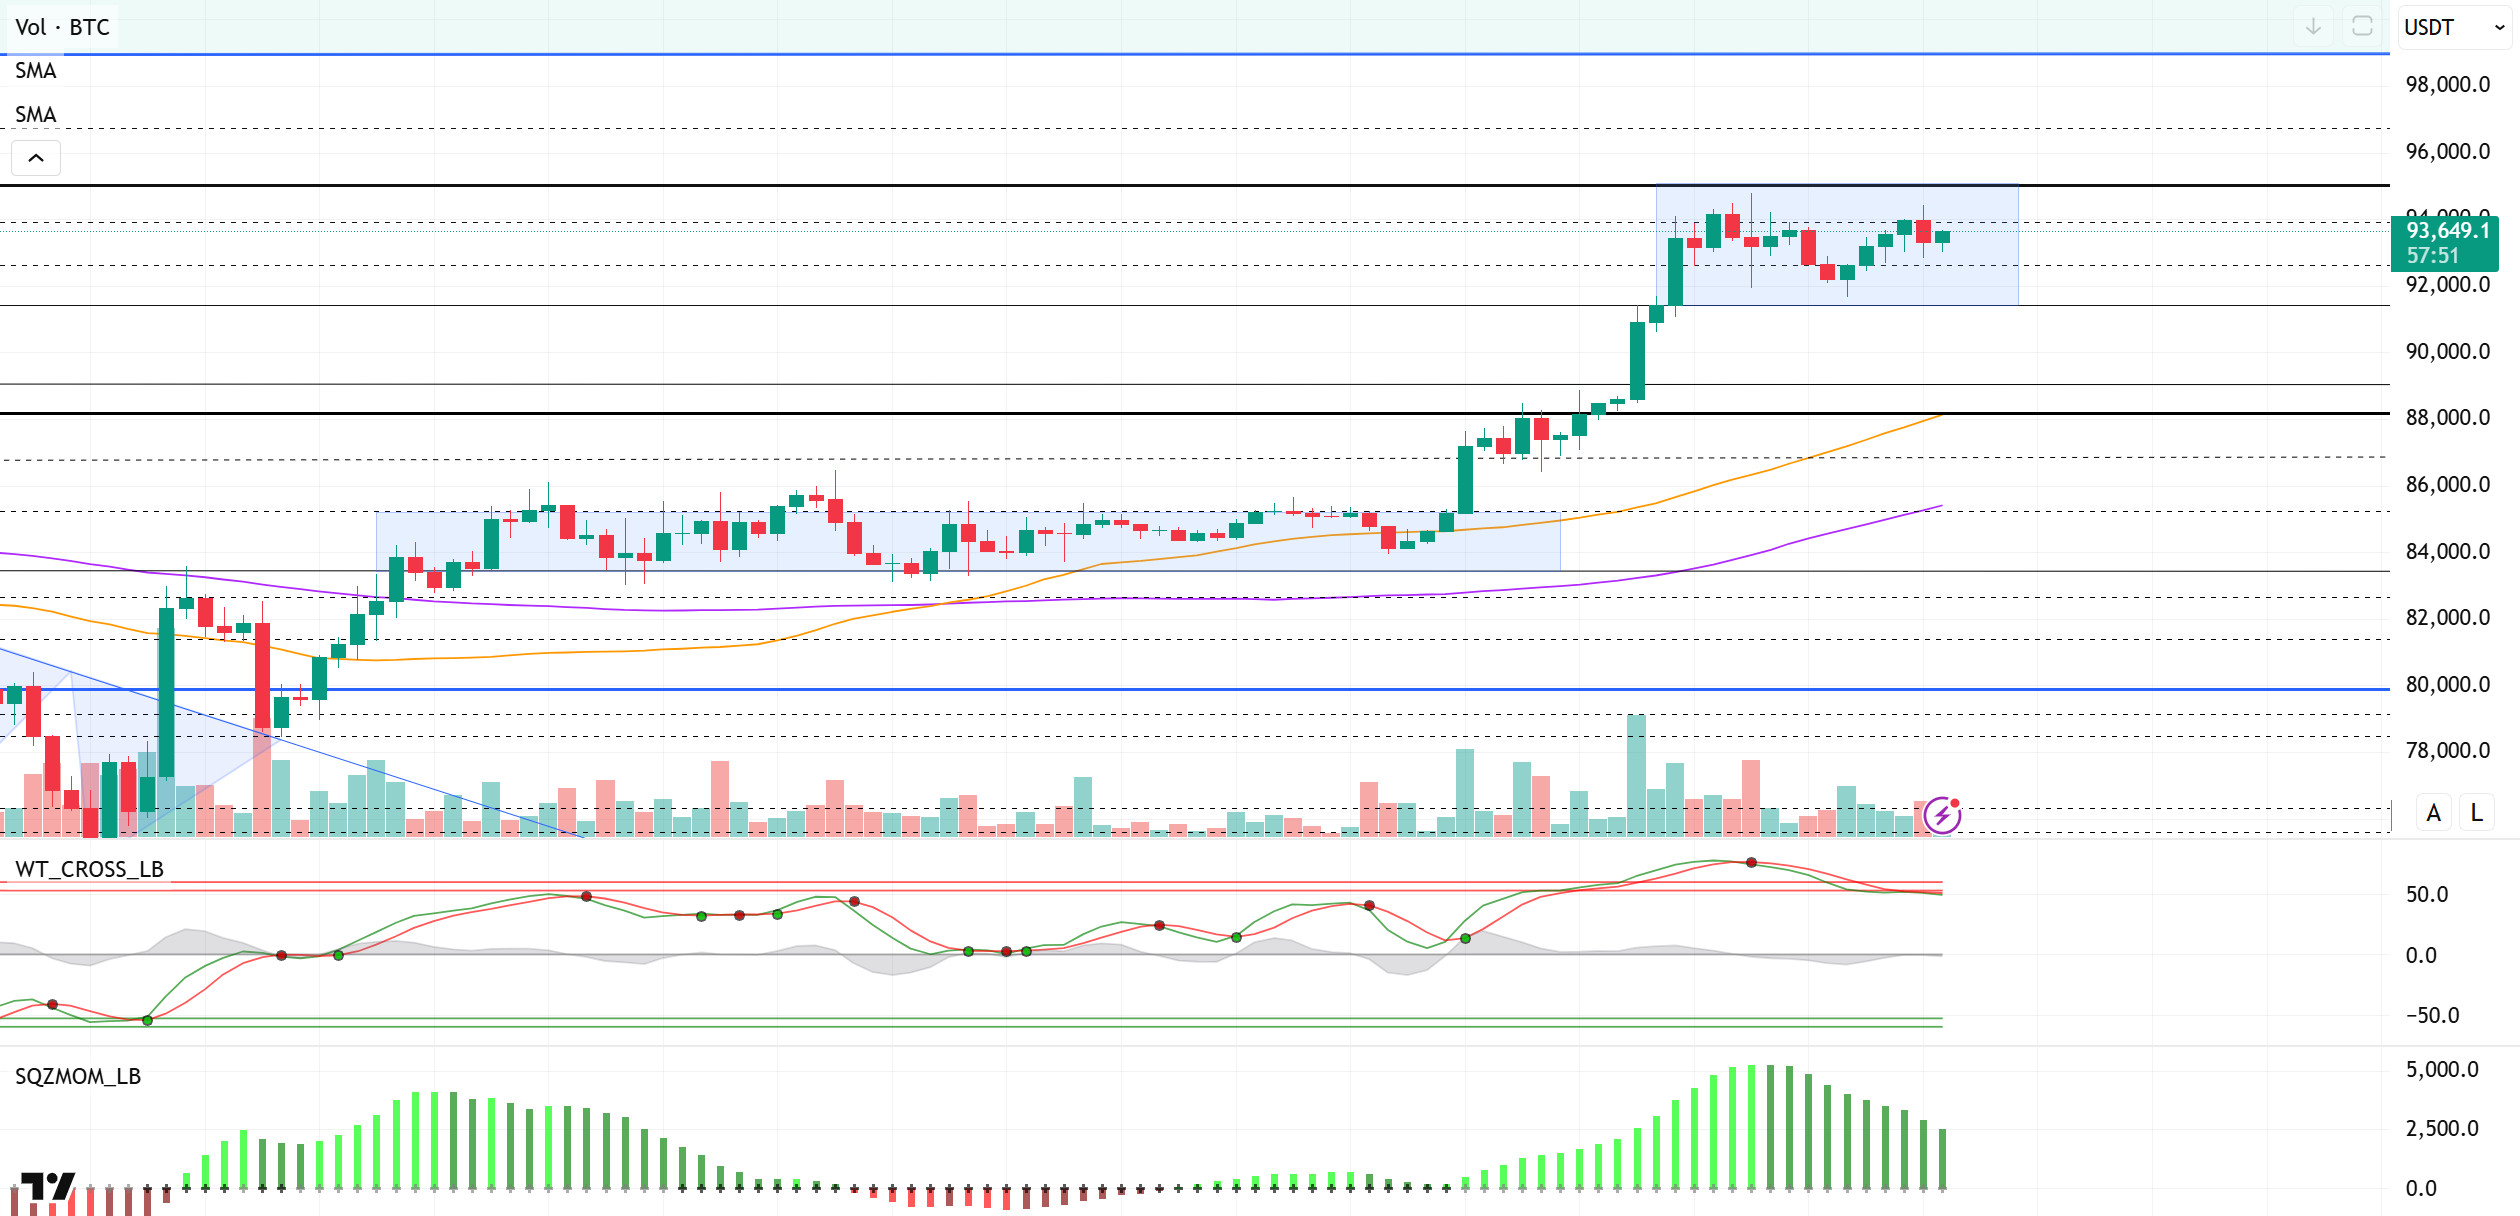
A week in which institutional and state-sponsored purchases gained momentum in the crypto market is coming to an end. The government of El Salvador continued its purchases under the “1 BTC per day” strategy, increasing its reserve to 6,157 BTC. On the other hand, the large transfer of 1,000 BTC by Alameda Research was considered as a safe custody move while attracting the attention of market players. On the spot ETF side, the strong outlook continued; Bitcoin ETFs saw net inflows of $442 million for the fifth consecutive day, while BlackRock IBIT alone contributed $327 million.
Looking at the technical outlook, BTC managed to hold on to its bullish territory despite falling momentum and sell signals on oscillators. In previous analyses, a similar scenario was experienced, after BTC consolidated in a certain region, it broke the 85,200 level with a high tight flag pattern and started an uptrend that lasted until the 95,000 level. Looking at the current price movements, it is observed that BTC is preparing to create a similar technical structure again. If BTC continues to hold in the current price zone for a while, it could once again break out to the upside and start a new rally that could extend to six-digit levels. At the time of writing, BTC is trading at 93,500. In this process, the 89,000 level, as the bottom of the horizontal band range, stands out as the area where both technical support and buying positions accumulate. On the other hand, the 95,000 level continues to act as an important resistance as the upper limit of this bandwidth. This level should be carefully monitored as it is a critical region that has previously worked as both support and resistance. When technical indicators are analyzed, it is seen that the current structure is not yet fully ready for a new bullish attack. The wave trend oscillator is still generating a sell signal in the overbought area. This suggests that BTC is in need of a correction and that a technically healthier backdrop may emerge once the indicators break out of saturation and signal buying again. On the other hand, if the above-mentioned fundamental developments remain positive, the possibility that the market could regain upward momentum regardless of technical signals should not be ignored. In such a scenario, the 95,000 level will once again be monitored as a critical reference point both technically and psychologically.
Supports 92,800 – 91,450 – 90,400
Resistances 94,000 – 95,000 – 97,000
ETH/USDT
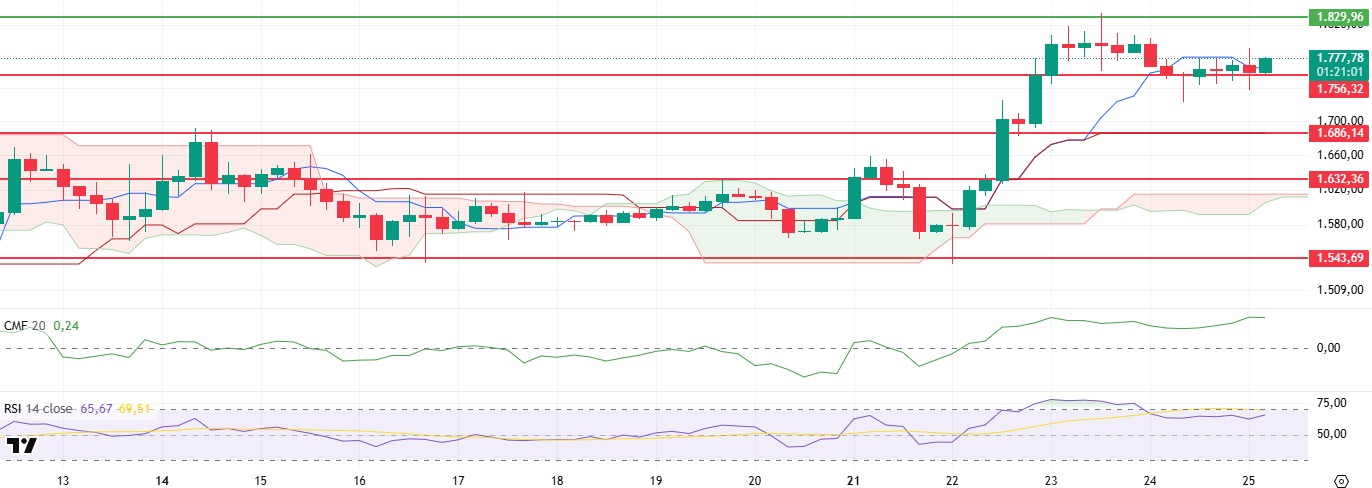
ETH tested the important support at the $1,756 level yesterday evening and after slipping below this area, it recovered in a short time and made this level a support area again. After this transformation, the price rose above the $1,775 level with light buying in the morning hours and is trying to stabilize above this level. This price action reflects the short-term recovery effort of the market structure.
Technical indicators continue to generate positive signals in general. The Ichimoku indicator showed that the kumo cloud remained horizontally stable, indicating a directionless equilibrium in the market. However, the fact that the price has risen back above the tenkan level is an important element indicating that short-term buyers have re-entered the market and the positive structure continues to be supported. This can be interpreted as a sign that market participants are starting to regain confidence. While the Chaikin Money Flow (CMF) indicator remains in the positive zone, its upward movement reveals that the liquidity flow is developing in the direction of buying. This outlook of CMF suggests that the money entering the market is moving in a positive direction and investors’ risk appetite is increasing. Momentum indicators are also generally in positive territory and continue their upward trend, reinforcing the possibility that the price will remain at current levels or head higher.
Within the framework of this technical outlook, pricing is likely to move in a slightly positive and horizontal band as long as it stays above the $1,756 support during the day. This support level is also a reference for short-term investors. However, if this level is breached again to the downside, short-term selling pressure may increase and ETH may risk testing lower support levels.
Top of Form
Below the Form
Supports 1,756 – 1,686 – 1,632
Resistances 1,829 – 1,925 – 2,131
XRP/USDT
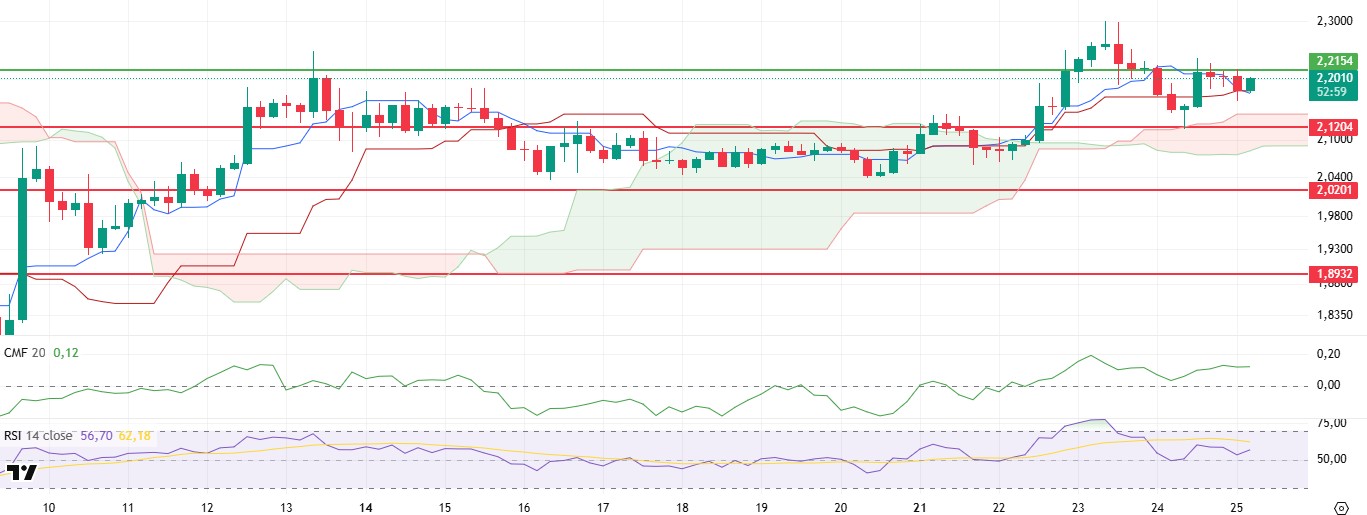
As mentioned in the previous analysis, after testing the $2.21 level, XRP experienced a slight pullback with selling pressure from this point, then recovered and gained positive momentum. This price action shows that the market encountered strong resistance at this level, but downward pressure remained limited. Especially with the buyers coming into play, the price has found an upward movement area again and this has created an unstable structure in terms of the short-term outlook.
Technical indicators are generating opposite signals in support of this indecision. The Chaikin Money Flow (CMF) indicator continues to move upwards while remaining in positive territory. This indicates that the capital entering the market is positive and buyers are dominating the market. This structure in liquidity flow stands out as an important factor supporting the upside potential of the price. On the other hand, the Relative Strength Index (RSI) has rebounded to 57 after the previous day’s decline. This level indicates that it remains above the neutral threshold of 50 and that buying pressure is regaining strength. The rebound in the RSI indicates that the momentum is shifting back towards buying. However, the Ichimoku indicator offers a contrary view to these positive technical signals. In particular, the downward cross of the tenkan level with the kijun level is considered a negative signal in the short term. This crossover indicates that market momentum is weakening and the price may enter a slight downward correction. This structure in the Ichimoku indicator suggests that the price may have difficulty breaking through the $2.21 resistance permanently.
In light of all this data, the conflicting signals in the technical outlook are striking. While CMF and RSI indicators support the upward trend of the price, the Ichimoku indicator reveals that caution should be exercised, especially in the short term. For this reason, the $2.21 level stands out as a critical resistance both technically and psychologically. Unless persistence above this level is not achieved, it should be evaluated that downward pressures may increase again and the risks of retreat may continue. However, if the $2.21 level can be exceeded and price stability can be achieved above this region, this will be a strong confirmation in terms of the continuation of the positive trend.
Supports 2.1204 – 2.0201 – 1.8932
Resistances 2.2154 – 2.3938 – 2.4721
SOL/USDT
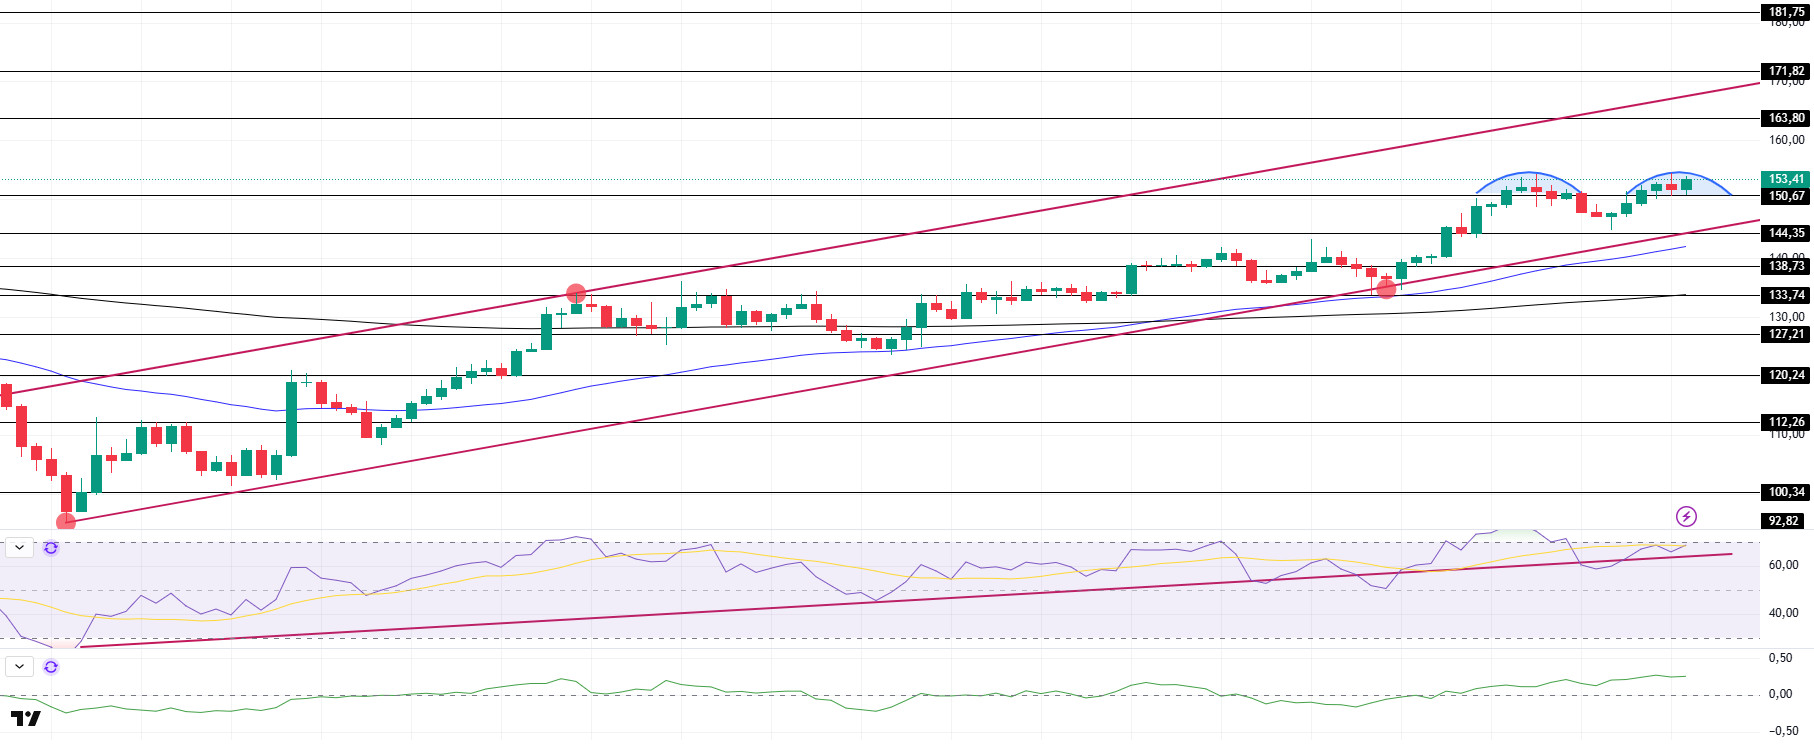
Investment firm RockawayX raises $125 million in early-stage funding for Solana projects. Robinhood will remove Solana fees by June 9th.
SOL continued its sideways trend and remained in the middle levels of the uptrend that started on April 7. The asset managed to hold above the $150.67 level, which is a strong resistance. However, a double top pattern has formed. This may cause pullbacks. On the 4-hour timeframe, the 50 EMA (Blue Line) continues to hover above the 200 EMA (Black Line). This could be a bullish start in the medium term. At the same time, the price continued to be above the two moving averages. This suggests that there is buying pressure in the market. The Chaikin Money Flow (CMF)20 indicator remained in positive territory. However, the negative daily volume may move CMF into negative territory. Relative Strength Index (RSI)14 continues to be above the uptrend that started on April 7. But the buying pressure seems to be over. This may cause a pullback to the support point of the trend. If it breaks, the retracements may deepen. The $163.80 level appears as a resistance point in the rises driven by the coming macroeconomic data and the news in the Solana ecosystem. If it breaks here, the rise may continue. In case of retracements for the opposite reasons or due to profit sales, the support level of $138.73 can be triggered. If the price comes to these support levels, a potential bullish opportunity may arise if momentum increases.
Supports 150.67 – 144.35 – 138.73
Resistances 163.80 – 171.82 – 181.75
DOGE/USDT
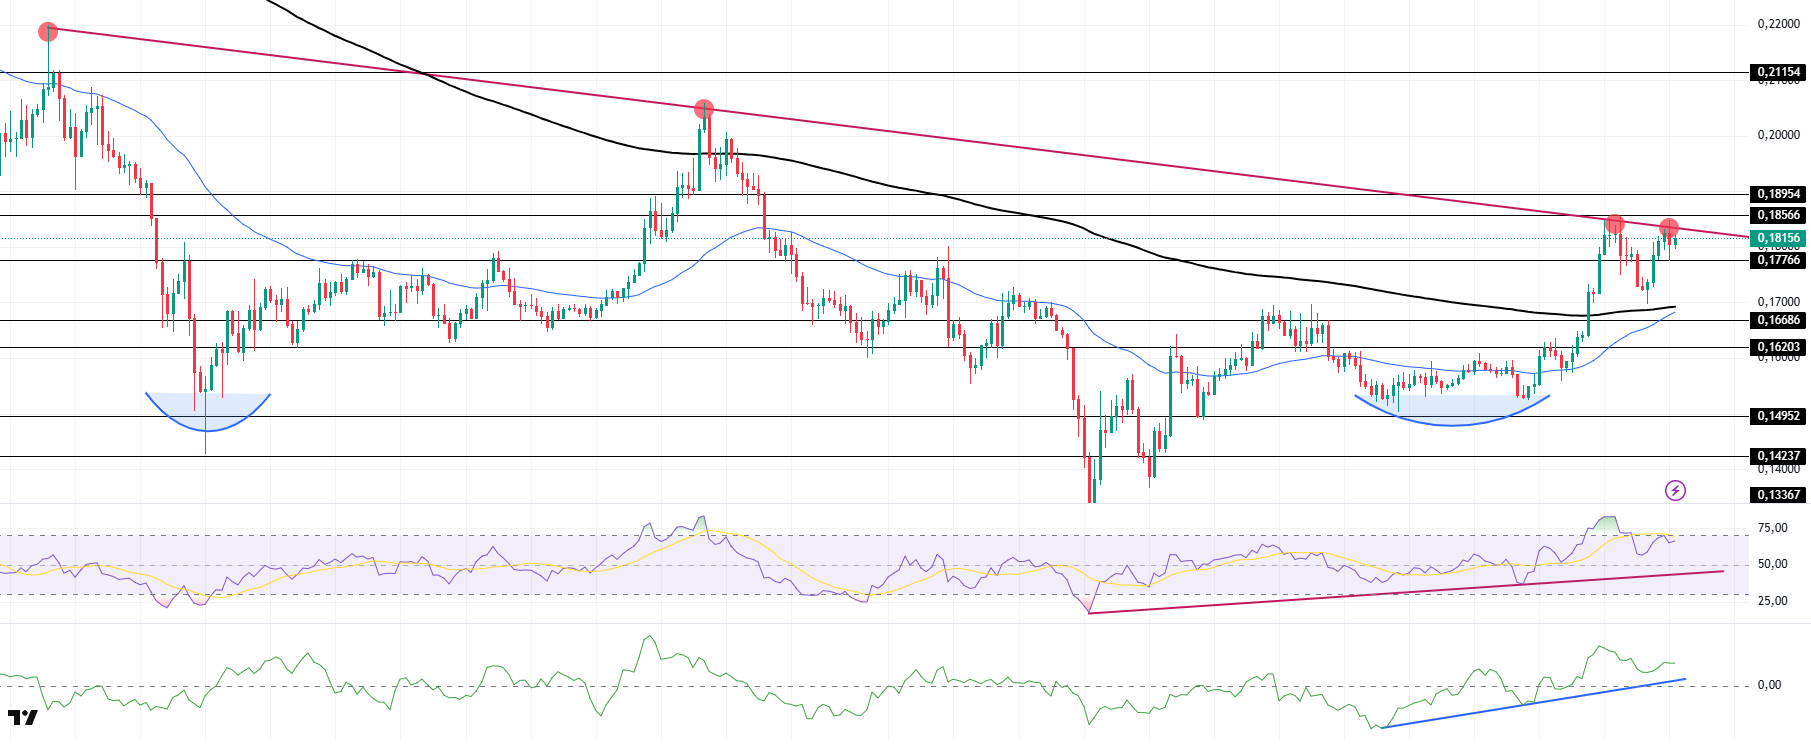
DOGE was bullish and continued to accelerate upwards. Testing the 200 EMA (Black Line) as support, the asset accelerated from there and is currently testing the downtrend that started on March 6 once again. If it breaks, it may trigger the strong resistance level of $ 0.18954. On the 4-hour timeframe, the 50 EMA (Blue Line) continues to be below the 200 EMA (Black Line). This could mean that the decline could continue in the medium term. However, the price is pricing above the two moving averages. This suggests that buying pressure is building. When we examine the Chaikin Money Flow (CMF)20 indicator, it is in positive territory but money outflows have started. At the same time, it continued the uptrend that started on April 16. In addition, the negative 24-hour volume may cause CMF to test the uptrend as support. On the other hand, Relative Strength Index (RSI)14 continued to be in positive territory. At the same time, it continues to be above the uptrend that started on April 7. The level of 0.18954 dollars appears as a very strong resistance place in the rises due to political reasons, macroeconomic data and innovations in the DOGE coin. In case of possible retracements due to political, macroeconomic reasons or negativities in the ecosystem, the $ 0.16686 level, which is a strong support place, is an important support place. If the price comes to these support levels, a potential bullish opportunity may arise if momentum increases.
Supports 0.17766 – 0.16686 – 0.16203
Resistances 0.18566 – 0.18954 – 0.21154
Legal Notice
The investment information, comments and recommendations contained herein do not constitute investment advice. Investment advisory services are provided individually by authorized institutions taking into account the risk and return preferences of individuals. The comments and recommendations contained herein are of a general nature. These recommendations may not be suitable for your financial situation and risk and return preferences. Therefore, making an investment decision based solely on the information contained herein may not produce results in line with your expectations.
