
TECHNICAL ANALYSIS
BTC/USDT
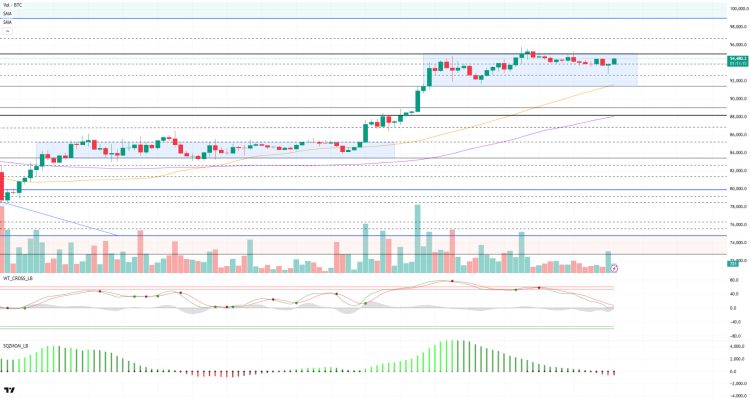
Bitcoin and crypto markets continue to break new records amid strong institutional interest. According to a CoinShares report, the computing power of the Bitcoin network will exceed 1 Zettahash in July 2025, reinforcing the resilience of the network. Strategy (former MicroStrategy) rose to the 88th largest company in the US with a market capitalization of $99.15 billion, while the Bitcoin Bullish Index rose to 60, signaling renewed market optimism. On the other hand, Bitcoin spot ETFs broke another historical record with a net inflow of 3.06 billion dollars last week.
Looking at the technical outlook, it seems that BTC, which has been on an uptrend, has once again entered the consolidation phase. With the effect of optimistic developments in global markets, BTC continues to push the 95,000 resistance level. BTC, which exhibited a similar structure in the previous breakout, broke in line with the high tight flag pattern and settled in the 90,000 band. For BTC, which is currently forming the same technical structure again at higher levels, the breakout point stands out as the 95,000 level. If this level is broken, our target will be six-digit pricing. When we look at the Wave trend oscillator, it is observed that it is about to exit the overbought zone and give a buy signal on the middle band. However, the momentum indicator does not yet fully support this structure, suggesting caution. According to liquidation data, buy positions have increased, while sell positions have not yet accumulated significantly. This suggests that the market is still bullish. Although the overall sentiment is bullish, caution should be exercised in the name of a possible liquidity purge. In such a scenario, 91,450 support point should be followed if the 92,800 level is broken.
Supports 92,800 – 91,450 – 90,400
Resistances 94,000 – 95,000 – 97,000
ETH/USDT
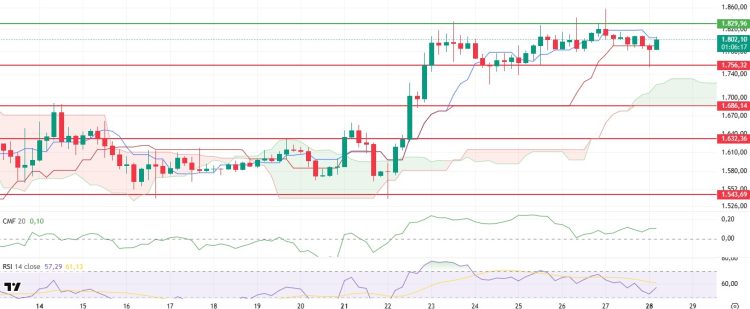
ETH remained stable at $1,793 over the weekend, moving in a narrow price range. While the low volume and directionless course of the market reflected the cautious attitude of investors, there was a pullback to the level of $1,756 with the selling pressure coming in the night hours. However, with purchases from this support zone, the price recovered quickly and reacted upwards by rising above the $1,800 level. Especially the timing of the strong reaction from the $1,756 level showed that this region is an important line of defense for short-term buyers.
Significant changes in technical indicators are also noteworthy with this recovery. Although the Chaikin Money Flow (CMF) indicator weakened to the zero line during the pullback, it accelerated back into positive territory as the price recovered. The fact that CMF is trying to stay above the zero line confirms that the liquidity inflow to the market is accelerating again and buyers are gaining strength. The Relative Strength Index (RSI) indicator, on the other hand, exhibited a downward trend over the weekend as the price remained flat. This created a positive divergence structure and set the stage for the upward movement of the price and the RSI level. On the Ichimoku indicator side, the price seems to be in an intense effort to regain the tenkan level. The persistence above Tenkan supports that the short-term trend may turn back in favor of buyers. The current structure of the Kumo cloud is also noteworthy; the cloud forms a positive pattern by both expanding and sloping upwards. This expansion and rise of the Kumo cloud indicates that the market’s expectations for the future continue to improve and the trend strength is increasing.
Within the framework of all these technical developments, the potential for Ethereum to move towards the $1,829 resistance level during the day seems quite high. Exceeding the $1,829 level could further accelerate the uptrend and lead to the next resistance zones of $1,850 and $1,870. However, it should be noted that volume support should increase in order for the upward movement to gain strength. Otherwise, selling pressure may be encountered at resistance levels. On the other hand, downside risks should not be ignored. The $1,756 level stands out as the most critical support point in the short term. It should be kept in mind that if this support is broken, selling pressure may increase and the price may sag into the Kumo cloud and retreat to the $1.690 band.
Supports 1,756 – 1,686 – 1,632
Resistances 1,829 – 1,925 – 2,131
XRP/USDT
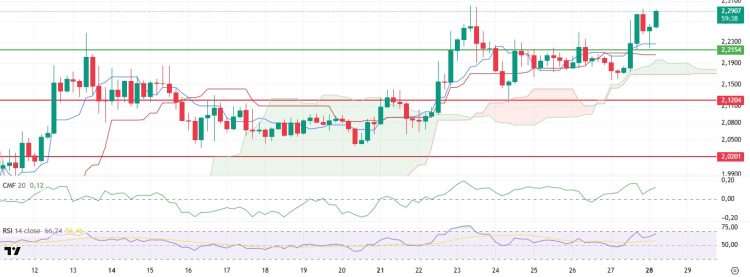
XRP made several attempts to break through the $2.21 level over the weekend but failed to do so, pulling back to the upper band of the kumo cloud on the ichimoku indicator. This pullback, especially on Saturday, showed the short-term indecision of the market and the selling pressure at the resistance zone. However, as of Sunday, with strong support from this region, XRP rallied sharply and managed to stay above the $2.21 level. This move indicates that XRP continues its upward trend and buyers are gaining weight in the market.
When technical indicators are analyzed, a significant change in the ichimoku indicator stands out. In particular, the buy signal generated by the Tenkan level crossing the Kijun level upwards has had an impact on price action. This crossover is often considered a strong indicator of trend reversals and confirms that the current bullish move is technically supported. In addition, the upper band of the kumo cloud rose to the level of $2.21, indicating that this region has completed the technical support-resistance transformation and gained an even more important structure. This upward expansion and thickening of the cloud indicates that the buying expectations in the market are strengthening and the upward movement area is expanding. On the Relative Strength Index (RSI) indicator, after the rise, the overbought zone was entered for a short time and a slight retracement was observed. However, this pullback was limited and RSI accelerated upwards again and managed to maintain its positive structure near the 70 level. The fact that the RSI did not suffer a sharp rejection from the overbought zone and recovered quickly supports that the market is strongly controlled by buyers. The Chaikin Money Flow (CMF) indicator is also in the positive territory, maintaining its upward slope. The fact that CMF remains in the positive area reveals that there is a clear inflow of liquidity into the market and this continues to support price movements. This data confirms that the interest of short-term buyers in the market is strong and selling pressures can be absorbed.
Within the framework of all these technical findings, the possibility of XRP making an attack towards the $ 2.39 level during the day seems quite strong. The $2.39 region stands out as a strong resistance point considering both historical price movements and current technical structures. When this level is reached, profit realizations and short-term selling pressures may increase as a possible scenario. On the other hand, the $2.21 level is the most critical support point in terms of downside risks. If this support is broken downwards, there may be a risk that the price may retreat back to the lower band of the kumo cloud, around $2.12. For this reason, the support of $2.21 should be carefully monitored in intraday transactions and a strategy should be determined according to whether there is a persistence below this level.
Supports 2.2154 – 2.1204 – 2.0201
Resistances 2.3938 – 2.4721 – 2.8347
SOL/USDT
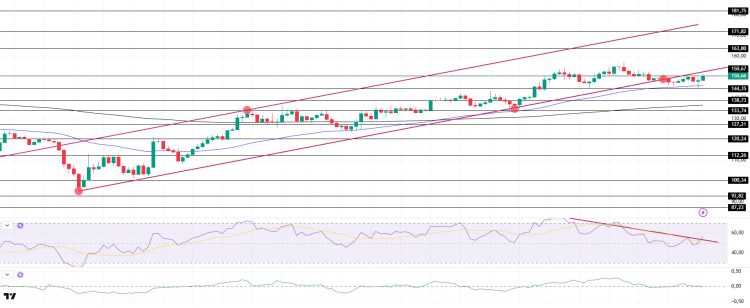
DeFi Development Corp. aims to raise $1 billion by selling securities to buy Solana (SOL) tokens over time. RockawayX has raised $125 million in funding to support Solana startups. Huma Finance, the first PayFi network, surpassed $4 billion in total transaction volume (TTV) two weeks after the introduction of Huma 2.0. Nous Research received $50 million from Paradigm to build decentralized artificial intelligence on Solana. Solana’s stablecoin supply reached an all-time high of 12.80 billion.
SOL continued its sideways trend. The asset broke the base of the uptrend that started on April 7, tested the 50 EMA (Blue Line) as support and accelerated from there. It is currently preparing to test the bottom of the downtrend as resistance. On the 4-hour timeframe, the 50 EMA (Blue Line) continues to hover above the 200 EMA (Black Line). This could mean a bullish continuation in the medium term. At the same time, the price remained above the two moving averages. This suggests that there is buying pressure in the market. The Chaikin Money Flow (CMF)20 indicator is at a neutral level. However, the negative daily volume and positive outflows may move CMF to the negative area. Relative Strength Index (RSI)14 continues to be below the downtrend that started on April 23 and is currently testing the downtrend as resistance. If it breaks here, there may be upside. The $ 163.80 level appears as a place of resistance in the rises driven by the upcoming macroeconomic data and the news in the Solana ecosystem. If it breaks here, the rise may continue. In case of withdrawals for the opposite reasons or due to profit sales, the support level of $ 138.73 can be triggered. If the price reaches these support levels, a potential bullish opportunity may arise if momentum increases.
Supports 144.35 – 138.73 – 133.74
Resistances 150.67 – 163.80 – 171.82
DOGE/USDT
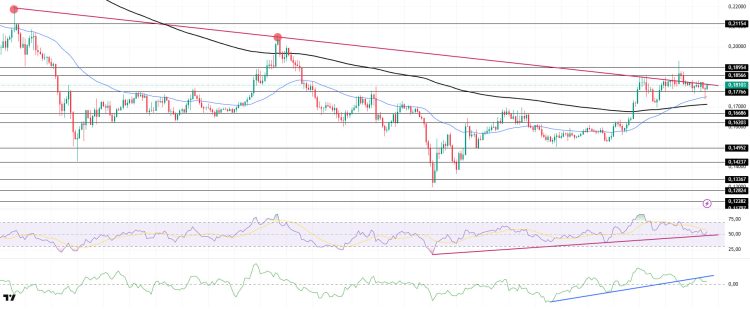
DOGE continued its sideways movement and is currently testing the downtrend as resistance once again. If it breaks it could trigger the strong resistance at $0.18954 again. The asset tested the 50 EMA (Blue Line) as support and accelerated from there. It is stuck between the resistance point of the downtrend and the 50 EMA. On the 4-hour timeframe, the 50 EMA (Blue Line) started to be above the 200 EMA (Black Line). This suggests that the asset could be in a bullish phase in the medium term. However, the price is pricing above two moving averages. This suggests that buying pressure is building. When we examine the Chaikin Money Flow (CMF)20 indicator, it is in the positive zone but money outflows have started. At the same time, it broke the uptrend that started on April 16 downwards and tested this as resistance and failed to break it. In addition, the negative 24-hour volume may move CMF to the negative area. On the other hand, Relative Strength Index (RSI)14 is in the neutral zone. But the bullish momentum seems to have diminished. At the same time, it is currently testing the uptrend that started on April 7 as support. The level of 0.18954 dollars appears to be a very strong resistance in the rises due to political reasons, macroeconomic data and innovations in the DOGE coin. In case of possible retracements due to political, macroeconomic reasons or due to negativities in the ecosystem, the $ 0.16686 level, which is a strong support place, is an important support place. If the price comes to these support levels, a potential bullish opportunity may arise if momentum increases.
Supports 0.17766 – 0.16686 – 0.16203
Resistances 0.18566 – 0.18954 – 0.21154
LEGAL NOTICE
The investment information, comments and recommendations contained herein do not constitute investment advice. Investment advisory services are provided individually by authorized institutions taking into account the risk and return preferences of individuals. The comments and recommendations contained herein are of a general nature. These recommendations may not be suitable for your financial situation and risk and return preferences. Therefore, making an investment decision based solely on the information contained herein may not produce results in line with your expectations.
