
TECHNICAL ANALYSIS
BTC/USDT
While regulatory developments and an increase in institutional interest in cryptocurrency markets attracted attention, El Salvador’s Economy Minister announced that the country will continue to accumulate Bitcoin despite the agreement with the IMF. On the same day, the US Senate stated that it will prepare to vote on the GENIUS bill on stablecoins in May. The UK Treasury aims to expand crypto regulations in cooperation with the US. While Eric Trump argued that blockchain will transform traditional banking, Bitcoin spot ETFs recorded a net inflow of $ 173 million for the 8th consecutive day. Today, eyes will be on the US GDP and PCE data as we mentioned in the weekly calendar.
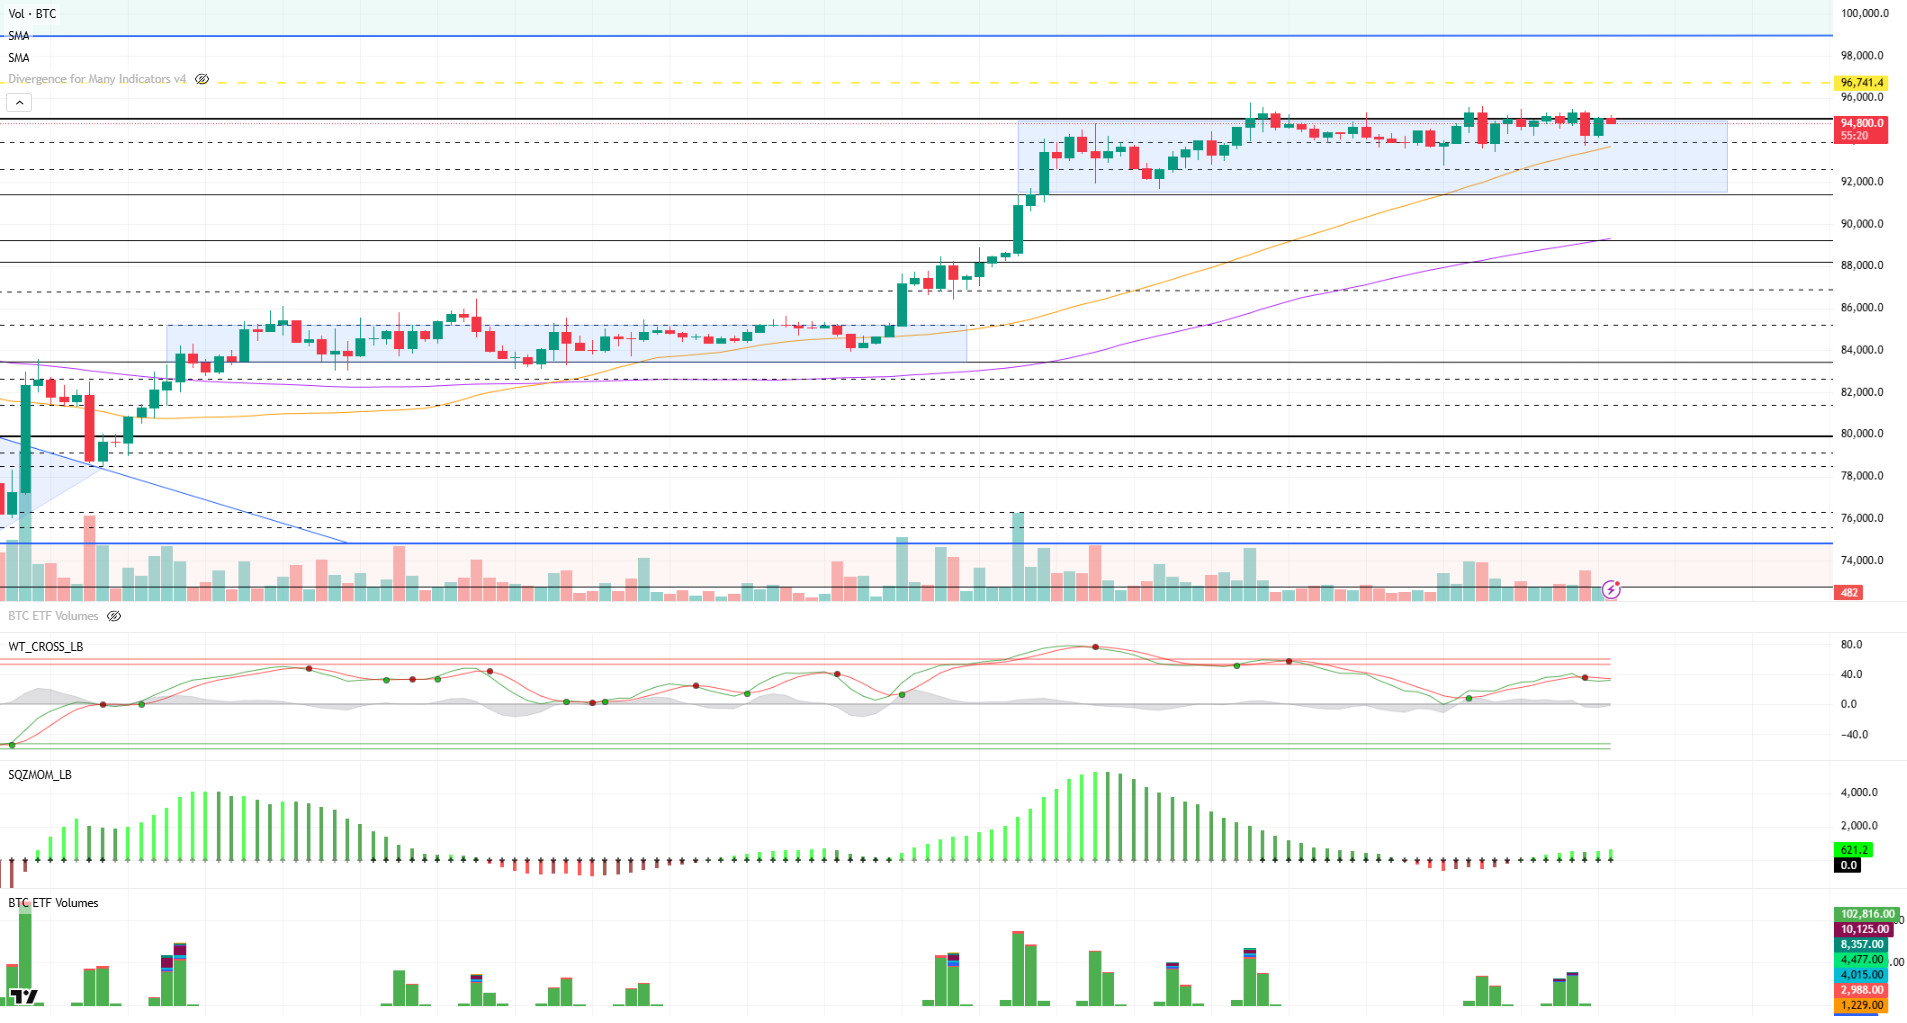
When we look at the technical outlook, BTC continues to consolidate in a horizontal band and follows a course dominated by low volatility. The price action, which has fluctuated in the 94,000-95,000 band in the last five days, has not yet received the necessary momentum support for an upside breakout. The buy signal previously observed on the Wave Trend oscillator turned into a sell signal, indicating a weakening technical structure. BTC, which briefly pinned below the 94,000 level yesterday, recovered and started testing 95,000 resistance again. Another noteworthy technical data is that the consolidation process that has been going on since April 22 has entered its 8th day. The previous similar structure lasted 9 days and was followed by a voluminous breakout. This similarity indicates that the possibility of a breakout is strengthening in the coming days. However, in order to clarify the breakout direction, eyes are turned to macro data. In particular, optimistic economic data that will support the expectation of an interest rate cut may trigger an upward breakout. When we look at the liquidation data, short positions are concentrated above the 96,000 level, while some of the buy positions are taking profits, indicating that investors have started to act cautiously. On the other hand, the continuation of positive inflows in Spot ETF data contributes to limiting downward movements in BTC. As of the general outlook, the expectation of an increase in volatility due to macro developments stands out for the direction of BTC. In this context, while the 95,000 level remains the reference point for the start of the upward movement, the 94,000 level will be followed as short-term support.
Supports 94,000 – 92,800 – 91,450
Resistances 95,000 – 97,000 – 98,000
ETH/USDT
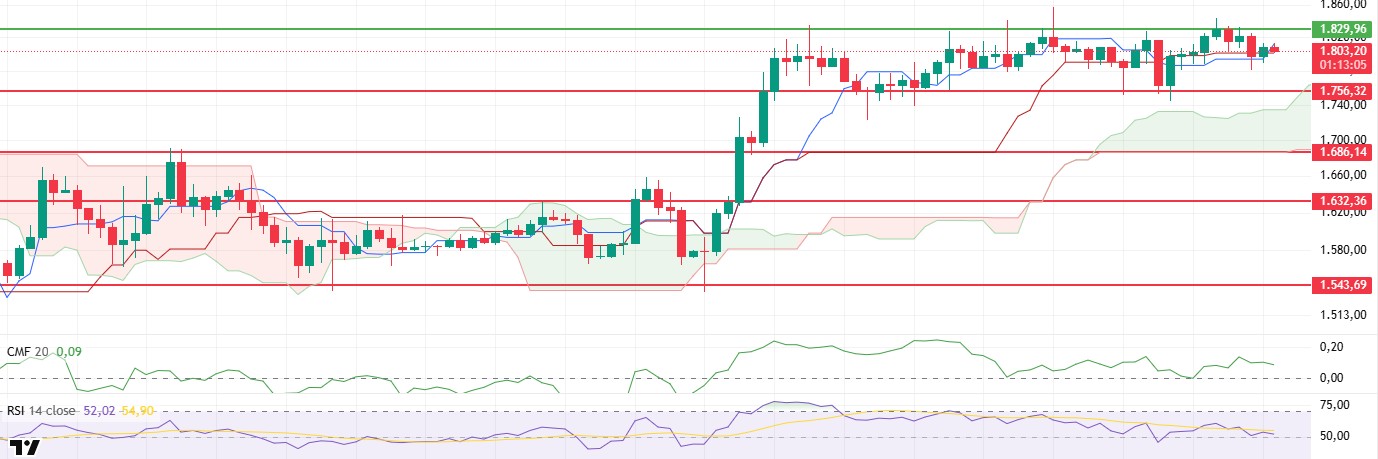
ETH started to signal weakness in the short-term outlook yesterday evening, rejecting key resistance at $1,829. Following this rejection, the price dipped below the tenkan level in the ichimoku indicator and moved into technical negative territory. However, thanks to the reaction buying from this region, the $1,800 level was regained and the price entered into a short-term stabilization effort. Nevertheless, the weakness in technical indicators still continues to dominate.
The continued downward movement of the Chaikin Money Flow (CMF) indicator indicates that liquidity outflows from the market are continuing and selling pressure is increasing. This outlook supports a structure where buyers are losing power and sellers are starting to dominate the market. Similarly, momentum is also under pressure. The Relative Strength Index (RSI) indicator continues its downward trend below the based MA line, indicating that the current negative outlook is becoming more pronounced. This indicates that risk appetite among market participants remains low. On the other hand, there is a notable divergence in the ichimoku indicator. The fact that the tenkan level crosses the kijun level upwards can be considered as a positive signal in the short term. This intersection provides a technical clue that the trend may re-shape upwards. However, in order for this signal to gain strength, the price needs to persist above the cloud zone on the ichimoku indicator and the weakness on the momentum side needs to be eliminated.
As a result, it is possible that the price may retreat to the $1,756 level during the day due to the weakness in the RSI and CMF indicators. However, if the trend change in the ichimoku indicator continues and buyer interest increases at these levels, it may be possible to see rapid and sharp rises on the ETH side again. Therefore, it is useful to be cautious by evaluating both the weakness in technical indicators and the potential turn in trend signals together.
Supports 1,756 – 1,686 – 1,632
Resistances 1,829 – 1,925 – 2,131
XRP/USDT
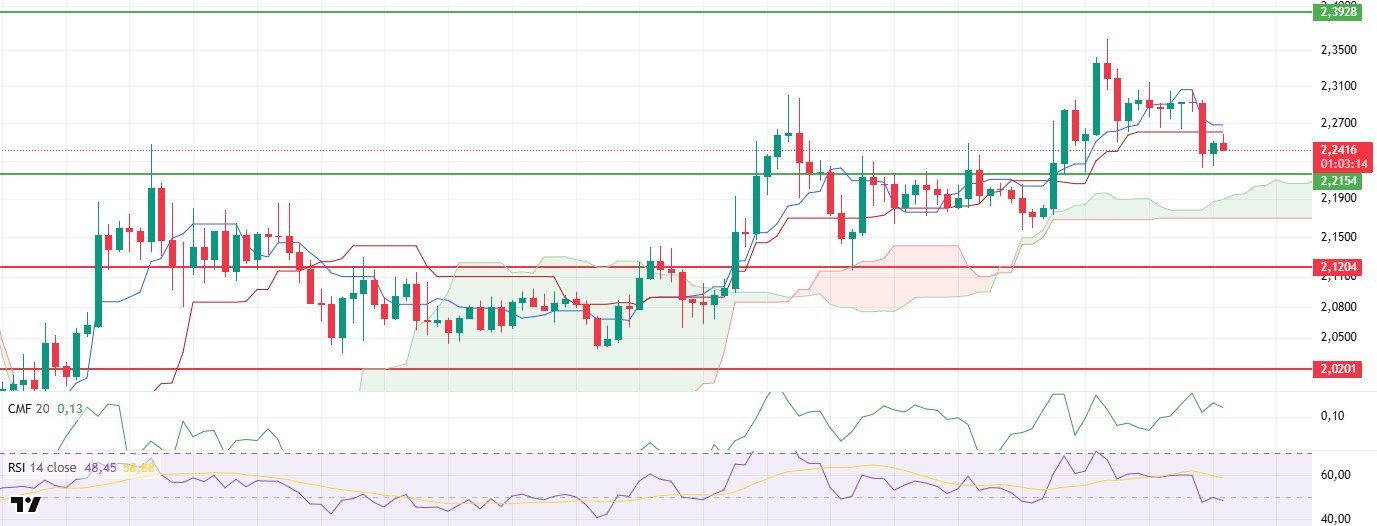
XRP violated the kijun level in the ichimoku indicator downwards in line with expectations yesterday evening and retreated to the $2.21 support zone. Although the price attempted a short-term recovery with weak buying at this level, it faced selling pressure from the kijun level again and upward attacks remained limited. This shows that the market is struggling to break through the current resistance levels and that the weight on the sell side is still on.
Technical indicators also support this negative picture. The sharp decline in the Relative Strength Index (RSI) indicator suggests that the loss of momentum is deepening and risk appetite among market participants is waning. This loss of momentum in the RSI provides a technical basis for the price to move towards lower support levels. On the other hand, the Chaikin Money Flow (CMF) indicator remains in the negative territory and continues its downward trend, indicating that liquidity outflows from the market continue and selling pressure continues unabated. When the Ichimoku indicator is analyzed, the outlook becomes even clearer. The fact that the price continues to remain below both tenkan and kijun levels indicates that the market is in a negative trend in general. In addition, the continued downward trend of the tenkan level confirms that the short-term trend is also weakening. This structure limits the market’s recovery attempts and makes it difficult for upward reactions to gain permanence.
When the overall picture is evaluated, with the weakness in key indicators such as RSI and CMF, if the XRP price breaks the $2.21 support downwards, the decline can be technically expected to continue for a while. On the other hand, if the price regains strength and breaks the $2.26 level upwards, the balance point between the tenkan and kijun levels, this negative outlook may be broken and the way for upward movements may be paved.
Supports 2.2154 – 2.1204 – 2.0201
Resistances 2.3938 – 2.4721 – 2.8347
SOL/USDT
The US Securities and Exchange Commission (SEC) announced that it has postponed its decision on Franklin Templeton’s spot Solana (SOL) ETF application. The Solana network has surpassed the 400 billion trading limit.
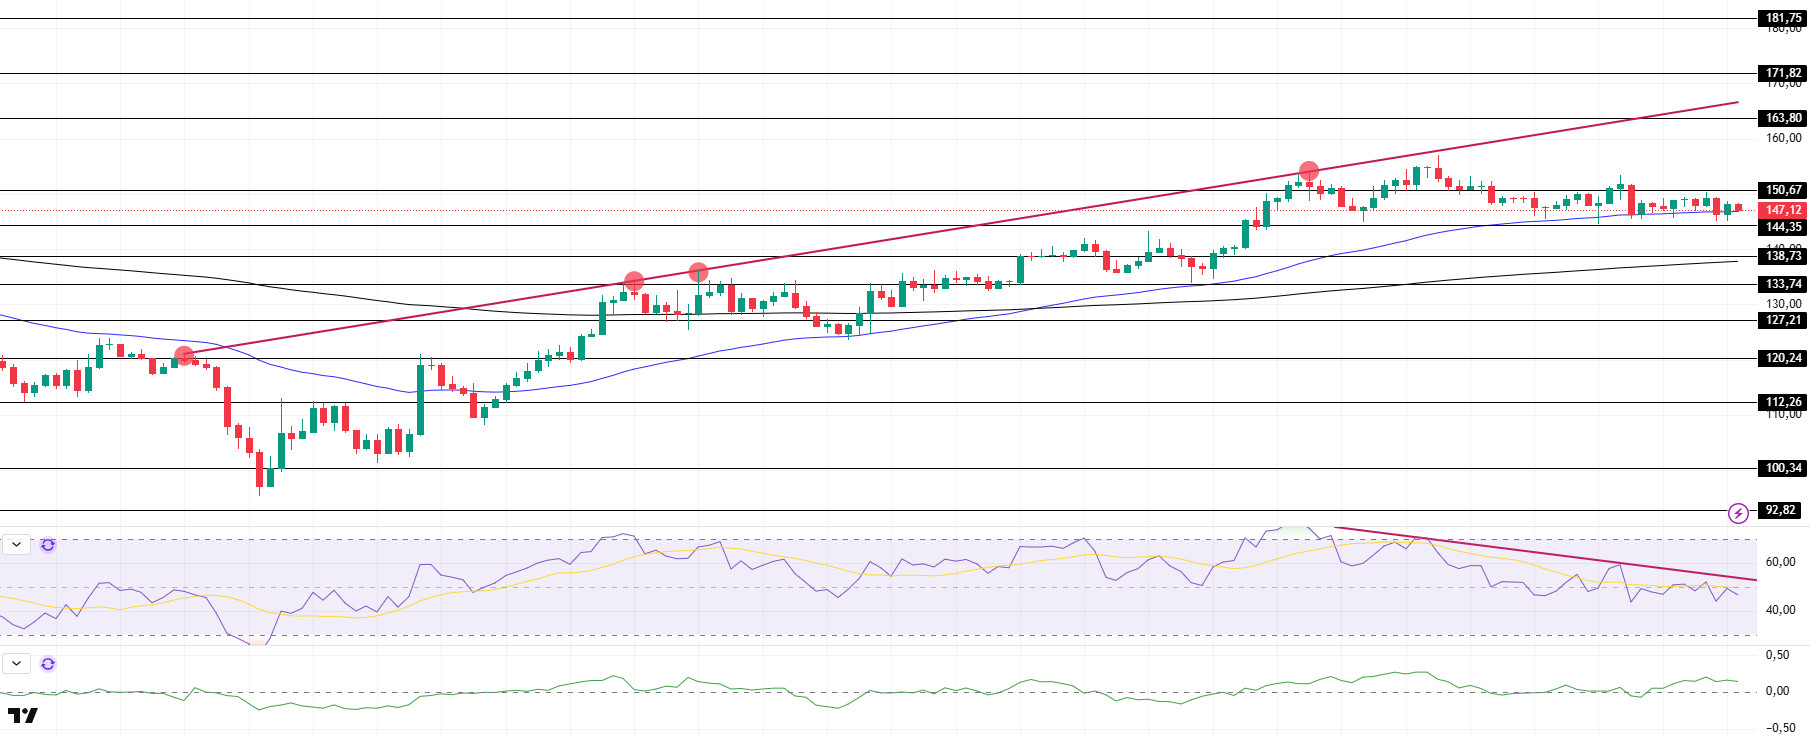
SOL price continued its sideways movements. The asset continues to trade below the resistance level of the ascending line that started on April 6. As of now, it has managed to get support by staying above the 50 EMA (Blue Line). In case this level is broken to the downside, the $138.73 level should be followed as an important support level. On the 4-hour chart, the 50 EMA (Blue Line) remains above the 200 EMA (Black Line). This suggests that the bullish trend may continue in the medium term. In addition, the fact that the price remains above both moving averages suggests that buying pressure continues across the market. Chaikin Money Flow (CMF20) is in positive territory; however, a decline in daily volume may cause CMF to move into negative territory. Relative Strength Index (RSI14), on the other hand, remains below the downtrend that started on April 23 and has moved into negative territory amid selling pressure. The $163.80 level stands out as a strong resistance point in case of a bullish breakout on the back of macroeconomic data or positive news on the Solana ecosystem. If this level is broken upwards, the rise can be expected to continue. If there are pullbacks due to contrary developments or profit realizations, the $138.73 level may be retested. In case of a decline to these support levels, the increase in buying momentum may offer a potential bullish opportunity.
Supports 144.35 – 138.73 – 133.74
Resistances 150.67 – 163.80 – 171.82
DOGE/USDT
21Shares has submitted a proposal to list a spot Dogecoin (DOGE) ETF on Nasdaq to enable traditional investors to invest directly in the popular cryptocurrency. The SEC delayed the Bitwıse spot Dogecoin ETF until June 15.
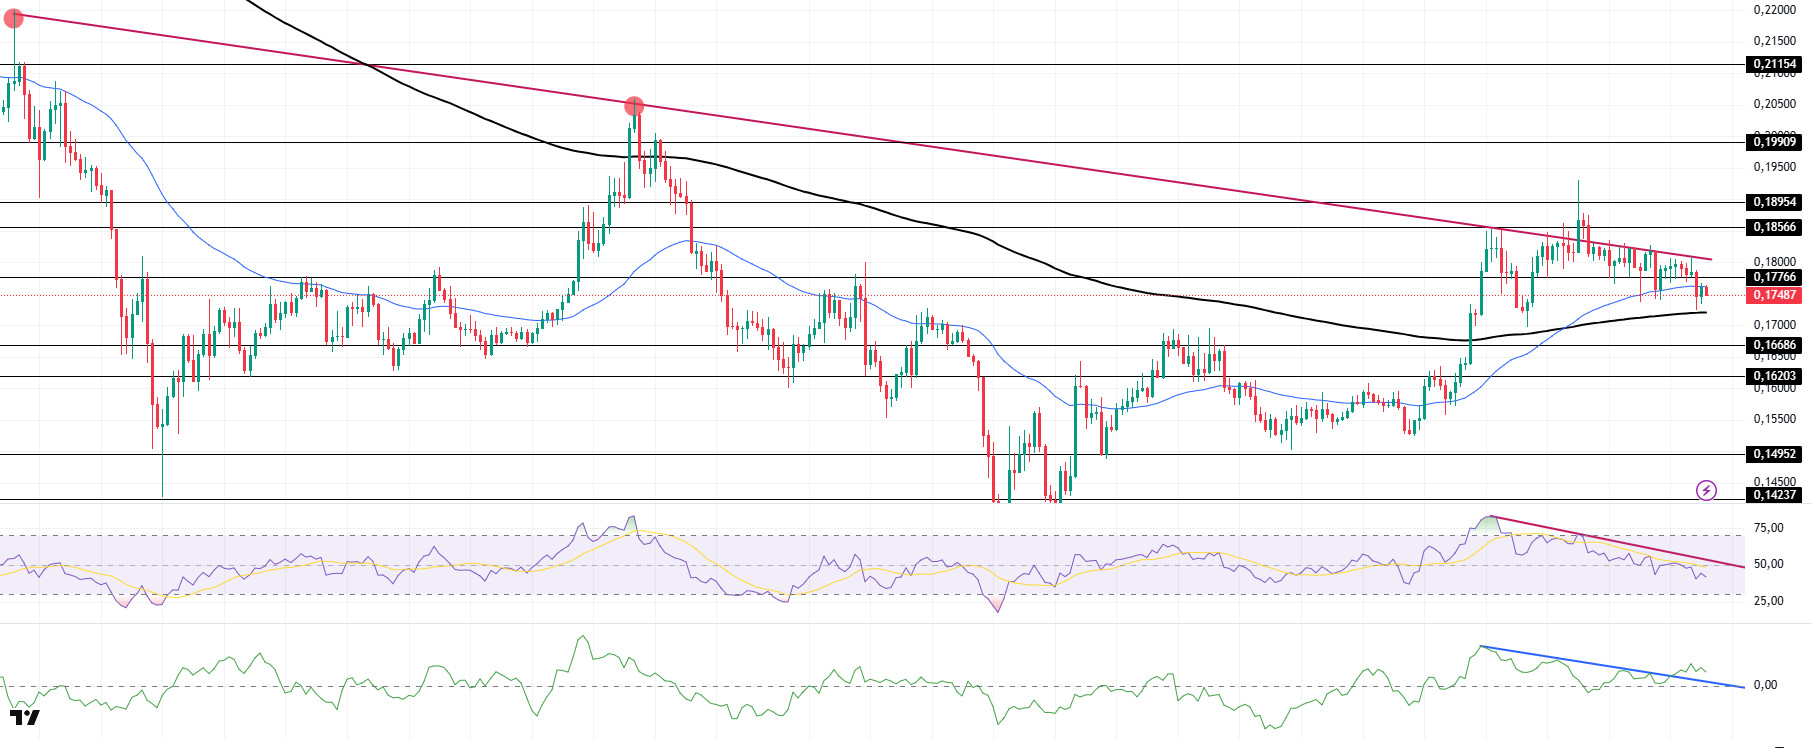
The DOGE price experienced a slight decline. Starting on March 6, it tested the downtrend line as resistance but failed to break it and retreated. Breaking the 50 EMA (Blue Line) to the downside, the asset tested the 200 EMA (Black Line) and showed limited upside from there. In case of a downside break of the 200 EMA, the $0.16686 level should be followed as a strong support. On the 4-hour chart, the 50 EMA is still above the 200 EMA. The fact that the price is between both moving averages indicates that the search for direction in the medium term continues. Chaikin Money Flow (CMF20) indicator remains in positive territory, but inflows are decreasing. On the other hand, the downtrend that started on April 22 has been broken to the upside, suggesting that bullish movements may continue. However, Relative Strength Index (RSI14) is still in negative territory and bullish momentum is weakening. Moreover, the downtrend that started on April 23rd is still in effect. The $0.18954 level stands out as a strong resistance zone in case of possible rises in line with political developments, macroeconomic data or positive news flow in the DOGE ecosystem. In the opposite case or possible negative news flow, the $0.16686 level may be retested. In case of a decline to these levels, the increase in momentum may start a new bullish wave.
Supports 0.16686 – 0.16203 – 0.14952
Resistances 0.17766 – 0.18566 – 0.18954
Legal Notice
The investment information, comments and recommendations contained herein do not constitute investment advice. Investment advisory services are provided individually by authorized institutions taking into account the risk and return preferences of individuals. The comments and recommendations contained herein are of a general nature. These recommendations may not be suitable for your financial situation and risk and return preferences. Therefore, making an investment decision based solely on the information contained herein may not produce results in line with your expectations.

