
TECHNICAL ANALYSIS
BTC/USDT
Trump described the fall of the US stock market after the tariff policy as an “expected transition” and compared it to a surgeon recovering the economy. He said negotiations on tariffs are ongoing and he is optimistic about a deal. On the other hand, in the crypto market, SEC chair nominee Paul Atkins was confirmed by the Senate Banking Committee. On the Bitcoin side, while there was a net outflow of $ 99.86 million from ETFs on April 3, Michael Saylor emphasized that Bitcoin is a strong asset in the long term despite short-term selling pressures.
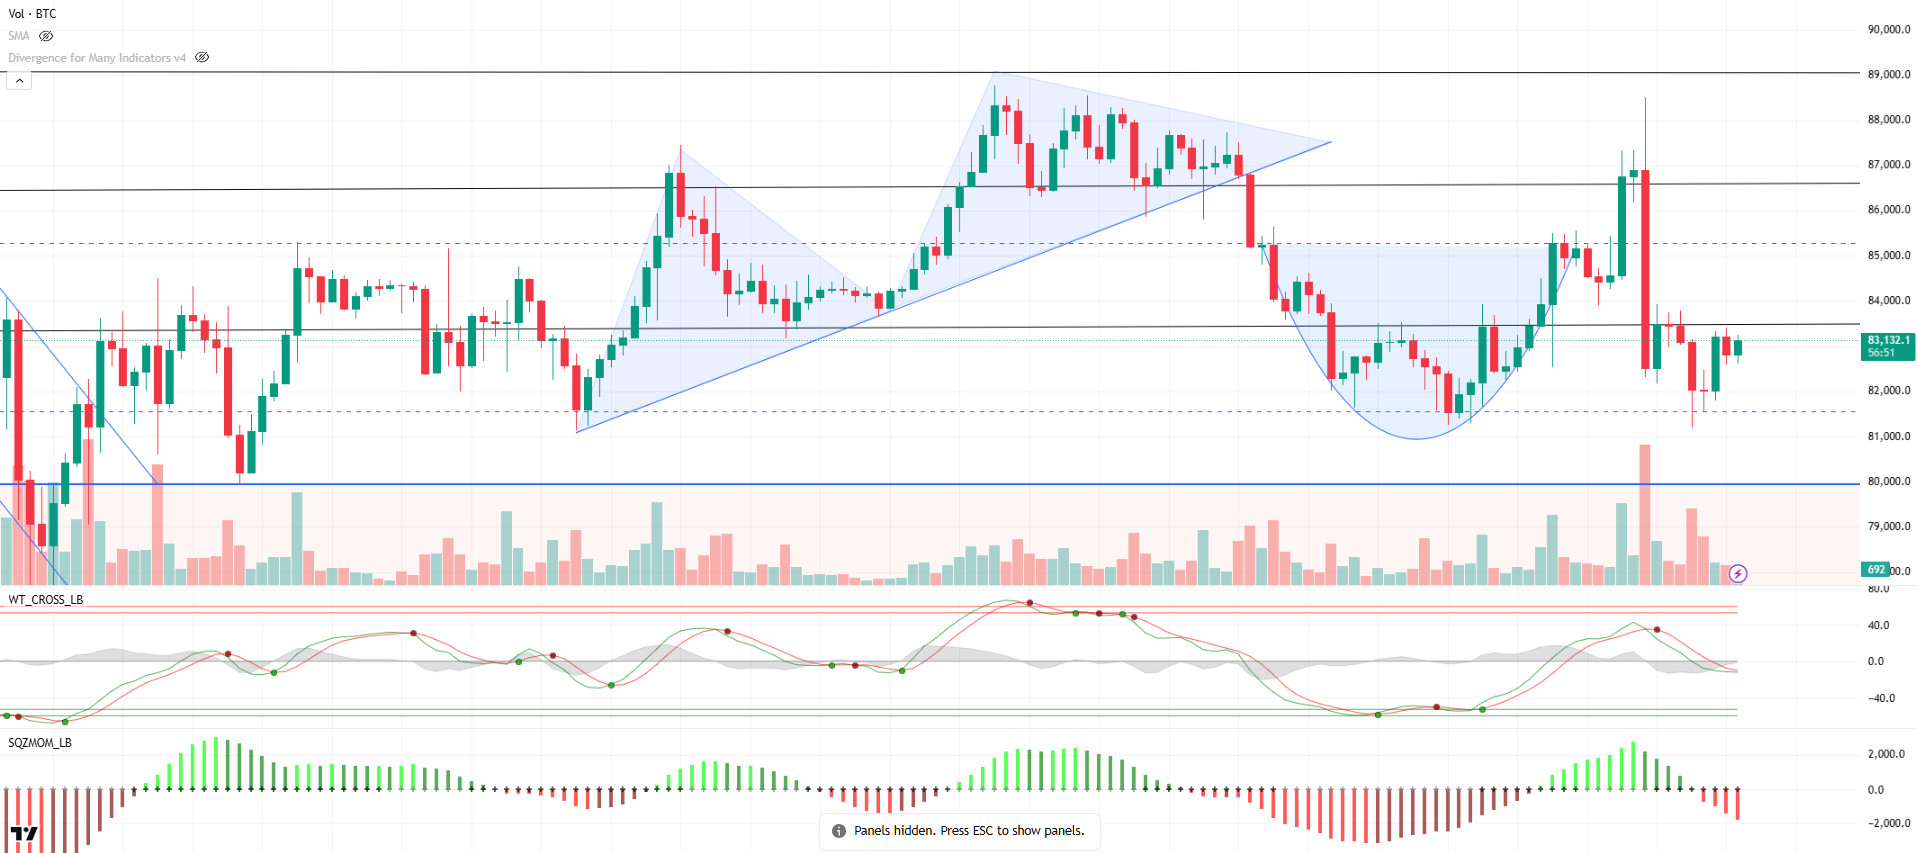
When we look at the technical outlook of BTC, it is seen that the price, which struggled to recover after the tariffs, fell to 81,000 yesterday, then reacted upwards with Trump’s statements. At the time of writing, BTC is trading at 83,000, just below the resistance zone of 83,500. The Wave Trend Oscillator shows that the sell signal has weakened and the probability of a buy signal in the short term has increased. However, momentum indicators are still moving in the negative territory, reflecting the weakness in the market. According to periodic analysis, technical indicators are in neutral territory on the hourly charts, while the sell signal continues to be maintained on the 4-hour and daily charts. The short-term moving averages (MA5, MA10, MA20) are generating a buy signal, while the long-term moving averages (MA50, MA100, MA200) point to continued uncertainty in the market. For the start of a new uptrend, closes above the 85,000 level, where the MA200 crosses, will be critical. Breaching this level could be an important signal for medium-term buyers to re-enter the market. On the other hand, if BTC stays within the 83,500 – 81,500 band, this region can be expected to continue to work as a squeeze range and the selling pressure can be expected to intensify again. In particular, the 80,000 level stands out as both technical and psychological support. If this level is lost, the 78,000 point can be expected to become a target again.
Supports 82,400 – 81,500 – 80,000
Resistances: 83,500 – 86,600 -89,000
ETH/USDT
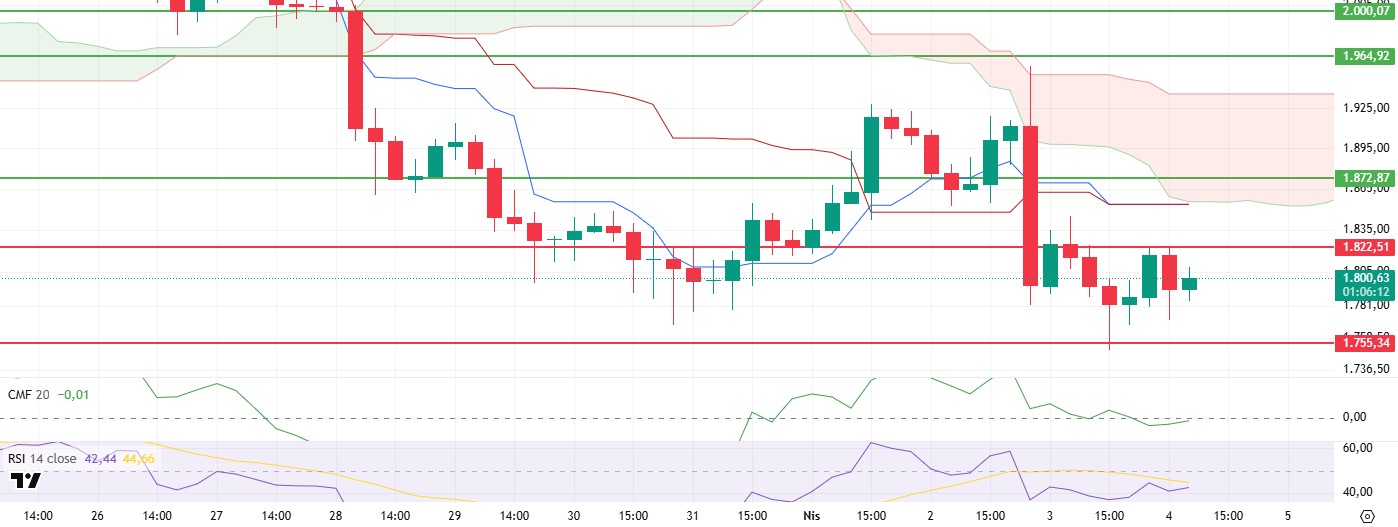
ETH fell as low as $1,755 yesterday evening after a sharp sell-off in the early evening hours. This level was followed by market participants as an important major support zone and was met with a short-term reaction in the price in line with expectations. As a result of this recovery, ETH managed to rise as high as $1,822. However, the selling pressure encountered at this resistance point caused the price to retreat again. Technical indicators exhibit a predominantly horizontal trend during this fluctuation process.
Cumulative Volume Delta (CVD) data shows that the pullback from $1,822 was mainly driven by selling in the futures market. This, along with the entry of aggressive short positions, put downward pressure on the price. At the same time, the Chaikin Money Flow (CMF) indicator gained upward momentum during this decline, suggesting that liquidity in the spot market increased and capital inflows continued. This outlook signals that although the price is under pressure in the short term, the medium-term positive trend is still intact. On the other hand, RSI (Relative Strength Index) and momentum indicators have started to generate bullish signals again, showing a slight recovery from recent lows. This development suggests that the market has started to break out of the oversold zone and the price is trying to stabilize in the short term. Within the Ichimoku cloud, the fact that the tenkan level did not fall below the kijun level despite the price retracement indicates that the upside potential is still technically valid. This structure prepares the ground for the continuation of bullish movements, albeit limited, especially in intraday transactions.
Overall, ETH price is likely to test the $1,822 resistance again during the day. If this level is breached on volume, the price can be expected to initiate a move towards the kumo cloud resistance above. However, if there is a rejection from this level, the price is likely to remain under downward pressure again. In the downside scenario, the $1,755 level could once again act as support, but a break of this support could lead to increased selling pressure and deeper correction. Therefore, keeping a close eye on these levels is critical for the healthy management of short and medium-term positions.
Supports 1,755 – 1,540 – 1,220
Resistances 1,822 – 1,872 – 1,964
XRP/USDT
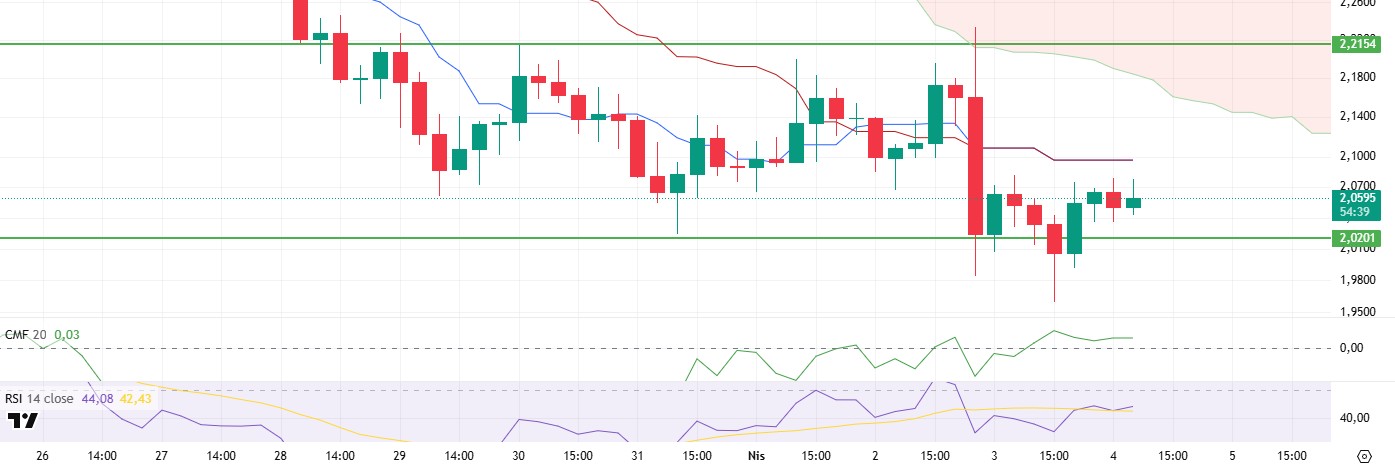
XRP was strongly affected by the sharp selling pressure in the cryptocurrency market yesterday, breaching its main support at the $2.02 level. However, pricing below this level was short-lived, and with buyers stepping in, XRP rebounded quickly to regain this important support level. Technical indicators started to produce some positive signals with this price action and seem to support the possibility of an upward recovery in the short term.
The Chaikin Money Flow (CMF) indicator, in particular, has crossed into positive territory despite the downtrend and maintains this trend. This suggests that buyer interest from the spot market has continued and the decline was largely triggered by futures selling. The positive trend on CMF suggests that capital inflows are continuing and market participants are maintaining their interest in XRP as the price has moved back above the support level. In addition, the RSI (Relative Strength Index) indicator also gained upward momentum with the recent rebound. The RSI’s upward break of the based moving average (MA) line supports that the price is coming out of short-term pressure and the bullish scenario is gaining strength in technical terms. This move underscores the recovery in momentum and suggests that the market is moving away from oversold territory. On the Ichimoku indicator side, while some uncertainties remain in the overall outlook, there are some noteworthy developments. Although the kumo cloud continues its downward trend, the gap between the tenkan and kijun levels seems to have closed and equalized. Although this structure does not produce a clear signal about the direction, the fact that the tenkan level has not yet fallen below kijun shows that the upside potential has not completely disappeared and may pave the way for short-term rises.
Considering the overall technical outlook, the price has the potential to rise up to the tenkan level during the day. In case of persistence above this level, it may become possible for XRP to test the kumo cloud resistance. On the other hand, if the price sags below the $2.02 level again, the downtrend is likely to accelerate again and deeper corrections are likely to come into play. For this reason, it is critical for investors to carefully monitor price movements, especially around the $2.02 support and tenkan level.
Supports 2.0201 – 1.8932 – 1.6309
Resistances 2.2154 – 2.3330 – 2.4940
SOL/USDT
The SEC accepted Fidelity’s application for a spot Solana ETF to be traded on the Cboe BZX Exchange. On Onchain, 4 wallets removed a total of 395,000 SOLs from their stake pool. Meme tokens accounted for more than 92% of Solana DEX volumes.
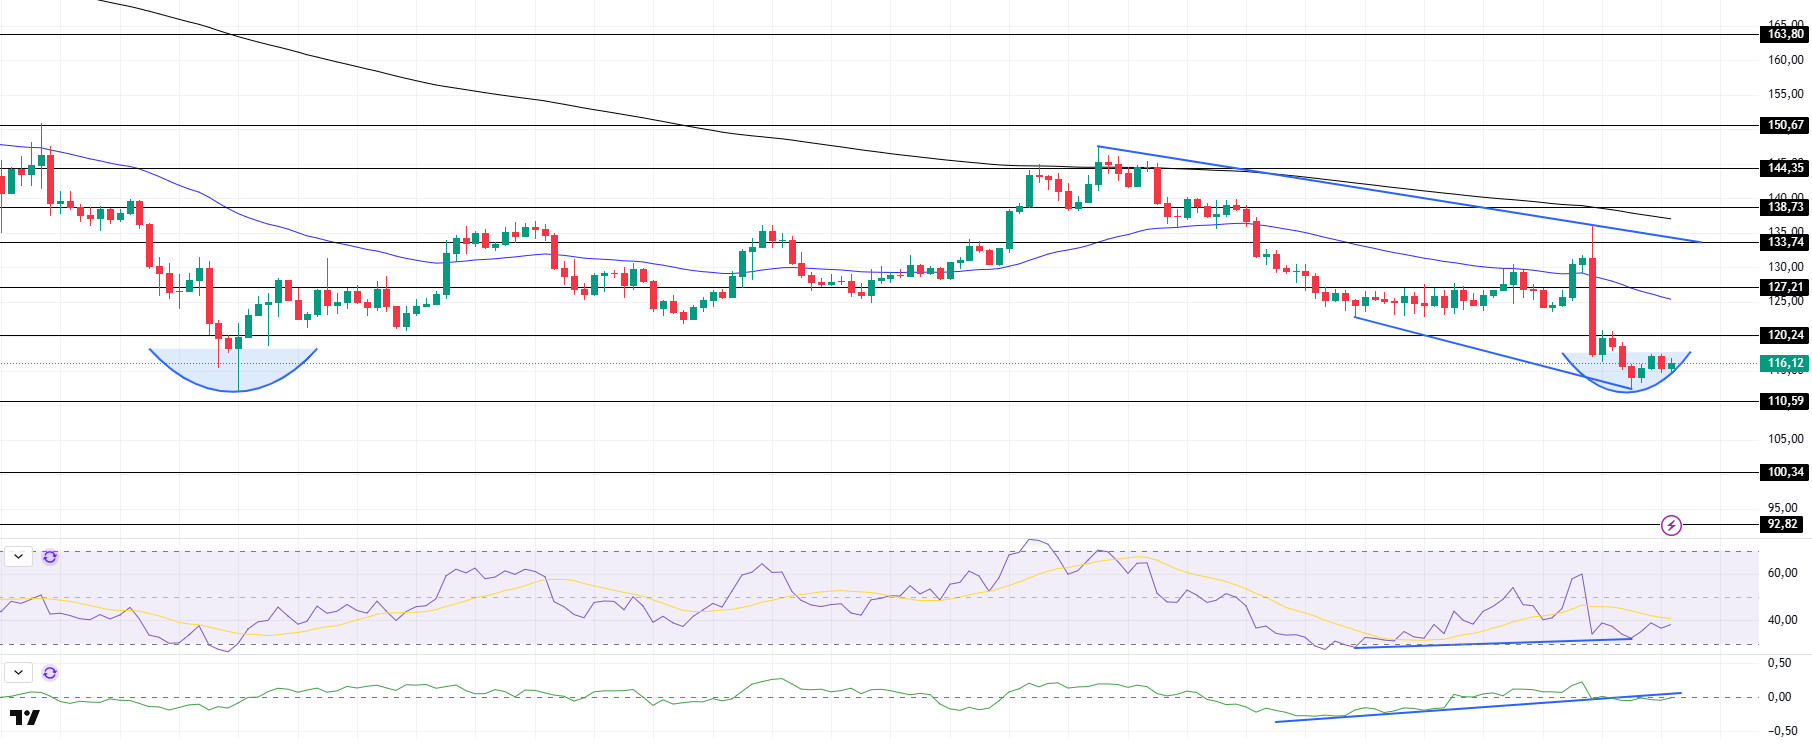
SOL has been flat since our analysis yesterday. The asset continued to continue the downtrend that started on March 25. At the same time, a double bottom formation was formed. This should be taken into consideration. On the 4-hour timeframe, the 50 EMA (Blue Line) remained below the 200 EMA (Black Line). This could deepen the decline further in the medium term. At the same time, the price is moving below the two moving averages again. When we examine the Chaikin Money Flow (CMF)20 indicator, it is in the neutral zone, but the negative daily volume indicates that CMF has a high potential to move back into negative territory. On the other hand, CMF broke the downward uptrend that started on March 29. It is currently testing this trend as resistance. However, the Relative Strength Index (RSI)14 indicator continues to be in negative territory. In addition, there is a bullish mismatch. This could be a bullish harbinger. The $127.21 level appears as a resistance point in the rises driven by the upcoming macroeconomic data and news in the Solana ecosystem. If it breaks here, the rise may continue. In case of retracements for the opposite reasons or due to profit sales, the support level of 110.59 dollars can be triggered. If the price comes to these support levels, a potential bullish opportunity may arise if momentum increases.
Supports 110.59 – 100.34 – 92.82
Resistances 120.24 – 127.21 – 133.74
DOGE/USDT
On-chain data revealed that more than 220 million DOGE tokens were accumulated by whale addresses.
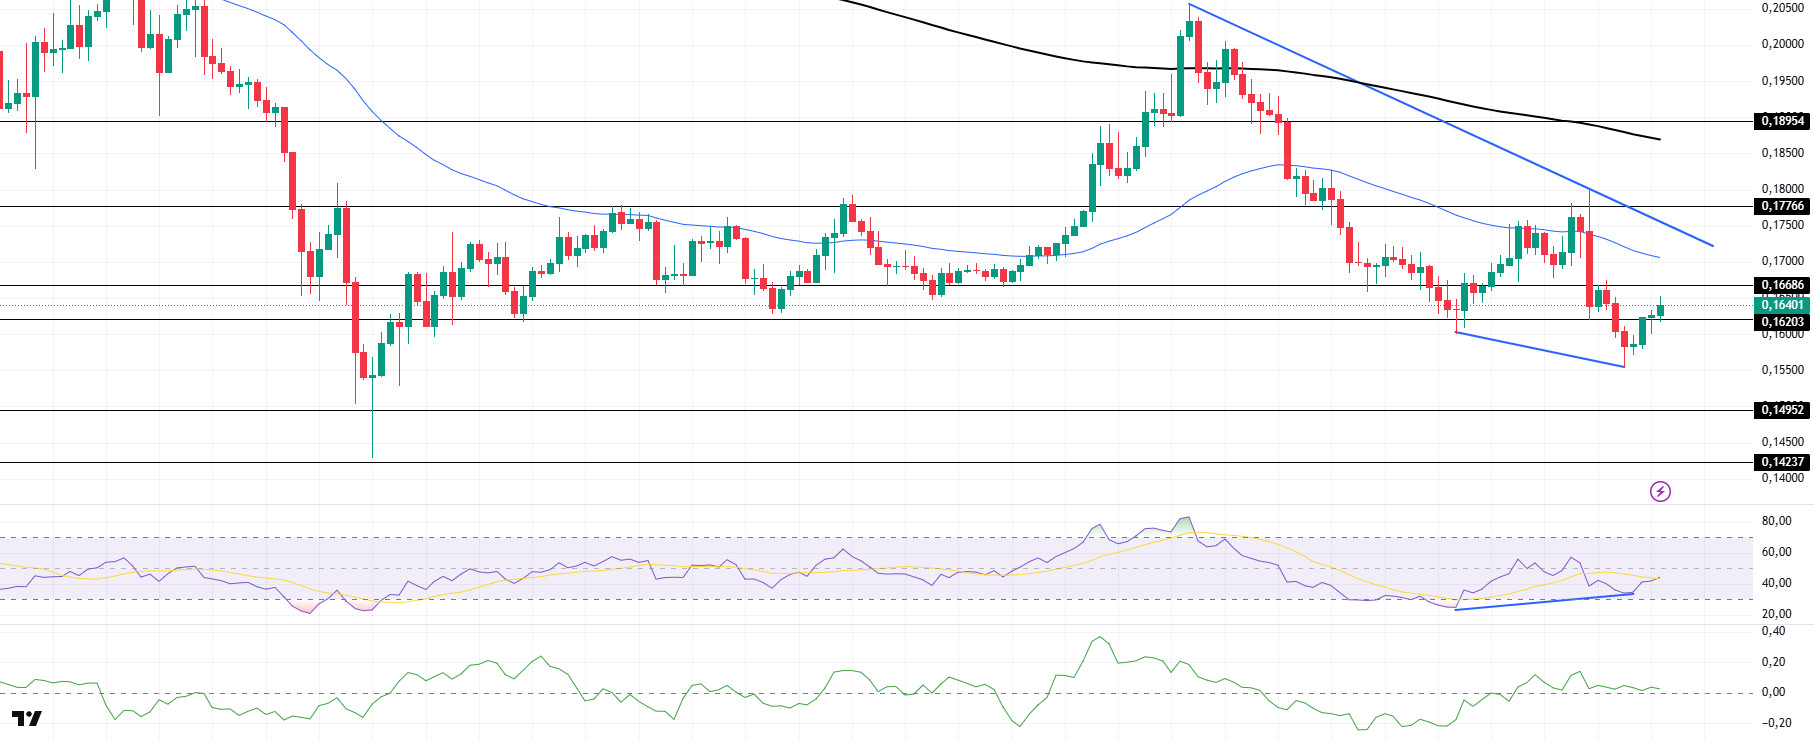
DOGE has rallied since our analysis yesterday. The asset tested the downtrend, which started on March 26, as resistance but failed to break it and lost value and broke the strong support at $0.16203. However, the bullish price managed to rise above the $0.16203 level again. If the upward acceleration continues, $ 0.16686 can be tested. On the 4-hour timeframe, the 50 EMA (Blue Line) continues to be below the 200 EMA (Black Line). This could mean that the decline could deepen in the medium term. However, the price continues to price below the two moving averages. The Chaikin Money Flow (CMF)20 indicator is in positive territory. In addition, the negative 24-hour volume may reduce inflows and cause CMF to move into the negative zone. On the other hand, Relative Strength Index (RSI)14 started to be positioned in the negative zone but seems to have broken the selling pressure. At the same time, there is an upward discrepancy. The $ 0.17766 level is a very strong resistance point in the rises due to political reasons, macroeconomic data and innovations in the DOGE coin. In case of possible retracements due to political, macroeconomic reasons or negativities in the ecosystem, the $ 0.14952 level, which is a strong support place, is an important support place. If the price reaches these support levels, a potential bullish opportunity may arise if momentum increases.
Supports 0.16203 – 014952 – 0.14237
Resistances 0.16686 – 0.17766 – 0.18954
Legal Notice
The investment information, comments and recommendations contained herein do not constitute investment advice. Investment advisory services are provided individually by authorized institutions taking into account the risk and return preferences of individuals. The comments and recommendations contained herein are of a general nature. These recommendations may not be suitable for your financial situation and risk and return preferences. Therefore, making an investment decision based solely on the information contained herein may not produce results in line with your expectations.
