
TECHNICAL ANALYSIS
BTC/USDT
In his statement, Trump defended the tariffs on China, the European Union and other countries, reiterating that this policy is the only way to close the US trade deficit. US Secretary of Commerce Lutrick stated that these tariffs will take effect without delay on April 9, while Treasury Secretary Bessant argued that the declines in the stock market were a short-term reaction to possible economic recession concerns. On the other hand, the White House obliged all federal agencies to report crypto assets in their possession to the Treasury Department by April 7. Bitcoin, on the other hand, has lost most of the gains it made after Trump’s election victory.
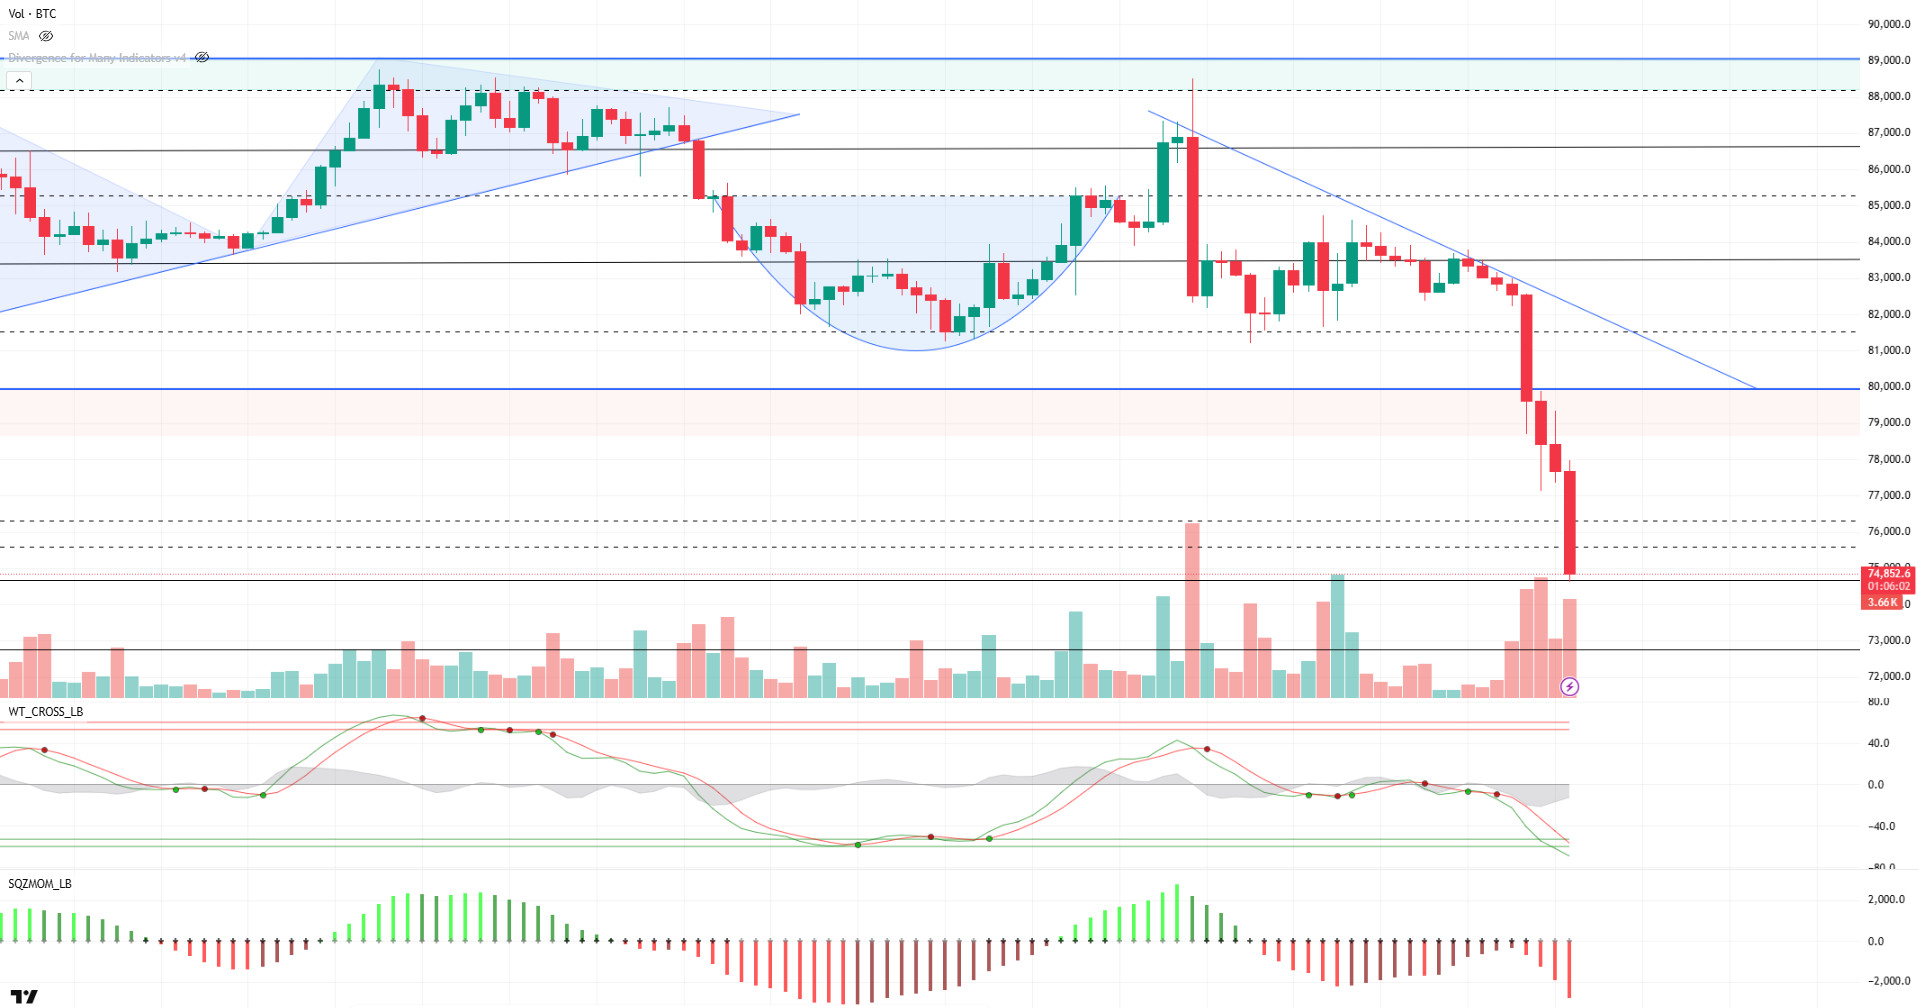
Looking at the technical outlook, last week we pointed out that the 80,000 level was a critical reference point and that selling pressure could deepen if this level was broken. As a matter of fact, BTC, which started the new week with a very sharp retreat, fell as low as 75,000 with a loss of up to 10%. Currently pricing below minor support levels, BTC is headed towards the 74,600 major support level. On the technical indicators side, the Wave Trend oscillator continues to generate a strong sell signal by moving below the oversold zone, while momentum indicators continue to look negative. Periodically, technical indicators on the 4-hour and daily charts have fallen into oversold territory. Spot ETF data shows that institutional investors are moving away from the market for the time being. When the liquidation six-month data is analyzed, it is seen that especially the buying positions have been liquidated to a large extent. This indicates that investors are taking a cautious stance for new positions. If BTC manages to get a reaction from the 74,600-support level, the 76,300 level will be followed as minor resistance first. However, if this level is also broken, it may strengthen the possibility of the price falling to the next support level of 72,700.
Supports: 74,600 – 72,700- 70,000
Resistances: 76,400 – 78,750 -80,000
ETH/USDT
ETH faced strong selling pressure over the weekend, as former US President Donald Trump’s statements and the subsequent uncertainty over tariffs continued to have a negative impact on the market. These developments reduced the global risk appetite and caused deeper selling in the cryptocurrency market. In particular, the downward break of $1,755, a technically critical level, combined with the liquidity gap below this level, led to the acceleration of the decline.
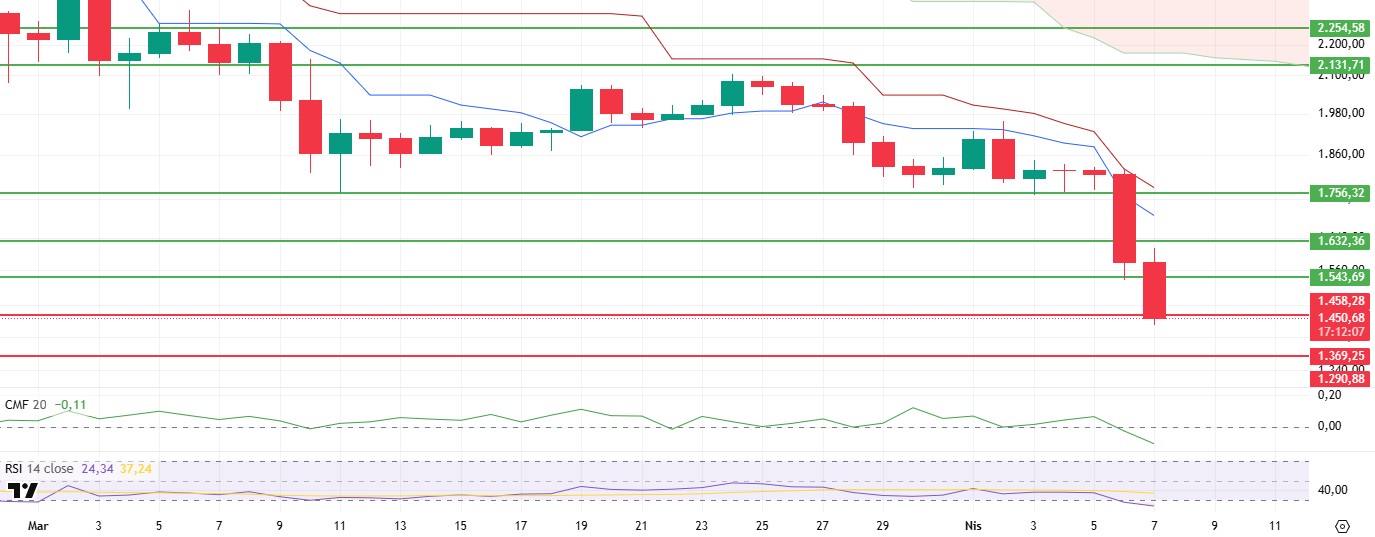
Technical indicators continue to support the bearish trend. The Chaikin Money Flow (CMF) indicator made a rapid transition to the negative territory with this pullback in prices, suggesting a significant outflow of liquidity from the market. On the other hand, the Relative Strength Index (RSI) has fallen to the oversold zone. However, so far, this weak outlook in the RSI is far from producing a possible reversal signal and indicates that the market has not yet signaled a bottom formation. The Ichimoku cloud is another element that supports the current technical picture. While the price has fallen below the Tenkan-sen and Kijun-sen levels, which are the key indicators of the cloud, the continued downward movement of these two levels confirms that the market is in a negative trend. This outlook suggests that short and medium-term resistances are strengthening, and an upside recovery is unlikely for the time being.
In light of all these developments, the downtrend in Ethereum is likely to continue for a while due to uncertainties regarding trade policies in the US and the ongoing weak risk appetite in global markets. If the $1,458 level is lost, the $1,369 and $1,290 levels may come to the agenda, respectively. For the beginning of an upward recovery, it is critical to first ensure persistence above the $1,543 level. Closures above this level may allow the market to breathe a little and enter a short-term rebalancing process.
Supports 1,458 – 1,369 – 1,290
Resistances 1,543 – 1,632 – 1,756
XRP/USDT
XRP has been in a strong downtrend since Sunday, losing two critical support levels with increasing selling pressure in global markets. Especially in this process, where the general market sentiment weakened, the XRP price retreated to the level of $1.63, which is an important threshold in technical terms. It is seen that the liquidity gap in the downside region was also effective in the decline towards this level. This gap paved the way for the price to quickly fall to the lower levels without encountering any strong buying reaction.
Technical indicators also confirm this decline. The Chaikin Money Flow (CMF) indicator, which has long shown a resilient stance despite market volatility, has fallen significantly into negative territory this time. This indicates that there is a significant outflow of capital from the market and investors are becoming risk averse. The fact that liquidity outflows have become so pronounced indicates that the bearish trend is supported by fundamental dynamics. Similarly, the Relative Strength Index (RSI) indicator has also retreated to oversold territory, indicating that the market has lost momentum and bearish pressure may continue in the short term. This weakness in the RSI signals that prices may not have bottomed yet.
In terms of technical structure, the $1.63 level is critical. A possible sag below this level may cause the decline to deepen further and carry the price to the $1.42 band. This area should be followed as the next potential support point. On the other hand, in order for XRP to enter the recovery process again and break out of the current downtrend, it needs to maintain above the $1.89 level. Exceeding this level may improve the technical outlook and bring a possible recovery scenario to the agenda. However, in the current situation, the overall technical outlook and market dynamics indicate that the downward trend may continue in the short term.
Supports 1.6309 – 1.4264 – 1.2895
Resistances 1.8932 – 2.0201 – 2.2154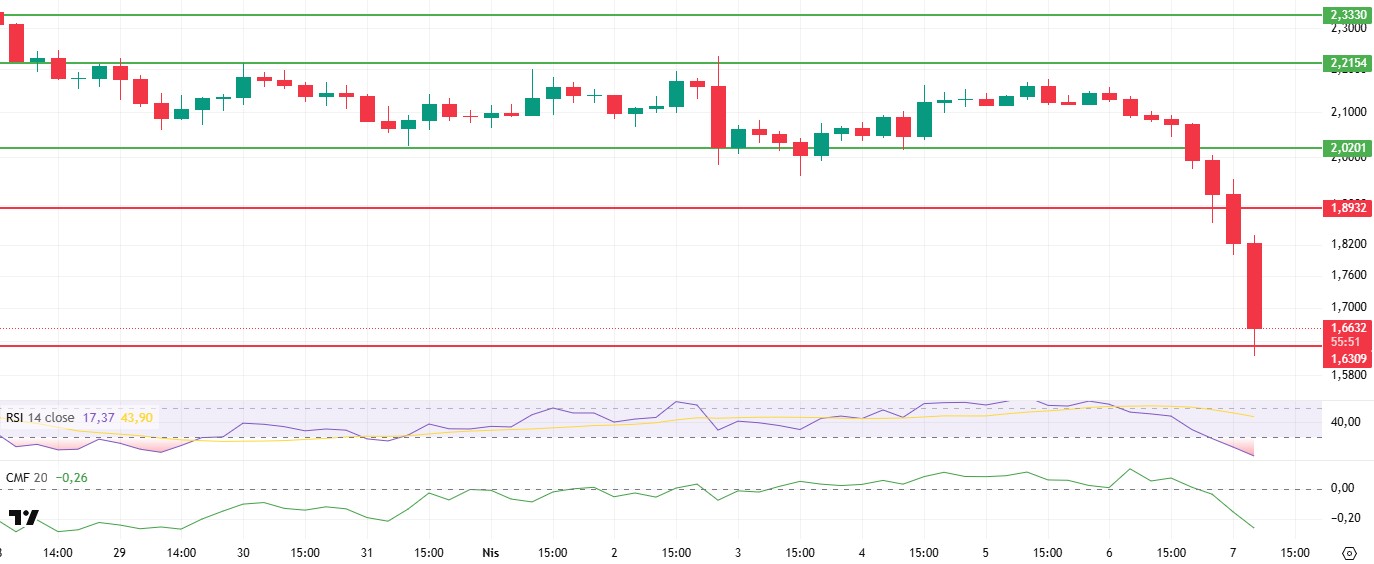
SOL/USDT
Grayscale Investments filed an S-1 form with the SEC to convert Grayscale Solana Trust into an exchange-traded fund (ETF), now called Grayscale Solana Trust ETF. Polymarket predicts the ETF has an 83% chance of approval before the end of the year. Solana whales realized significant sales of $46 million.
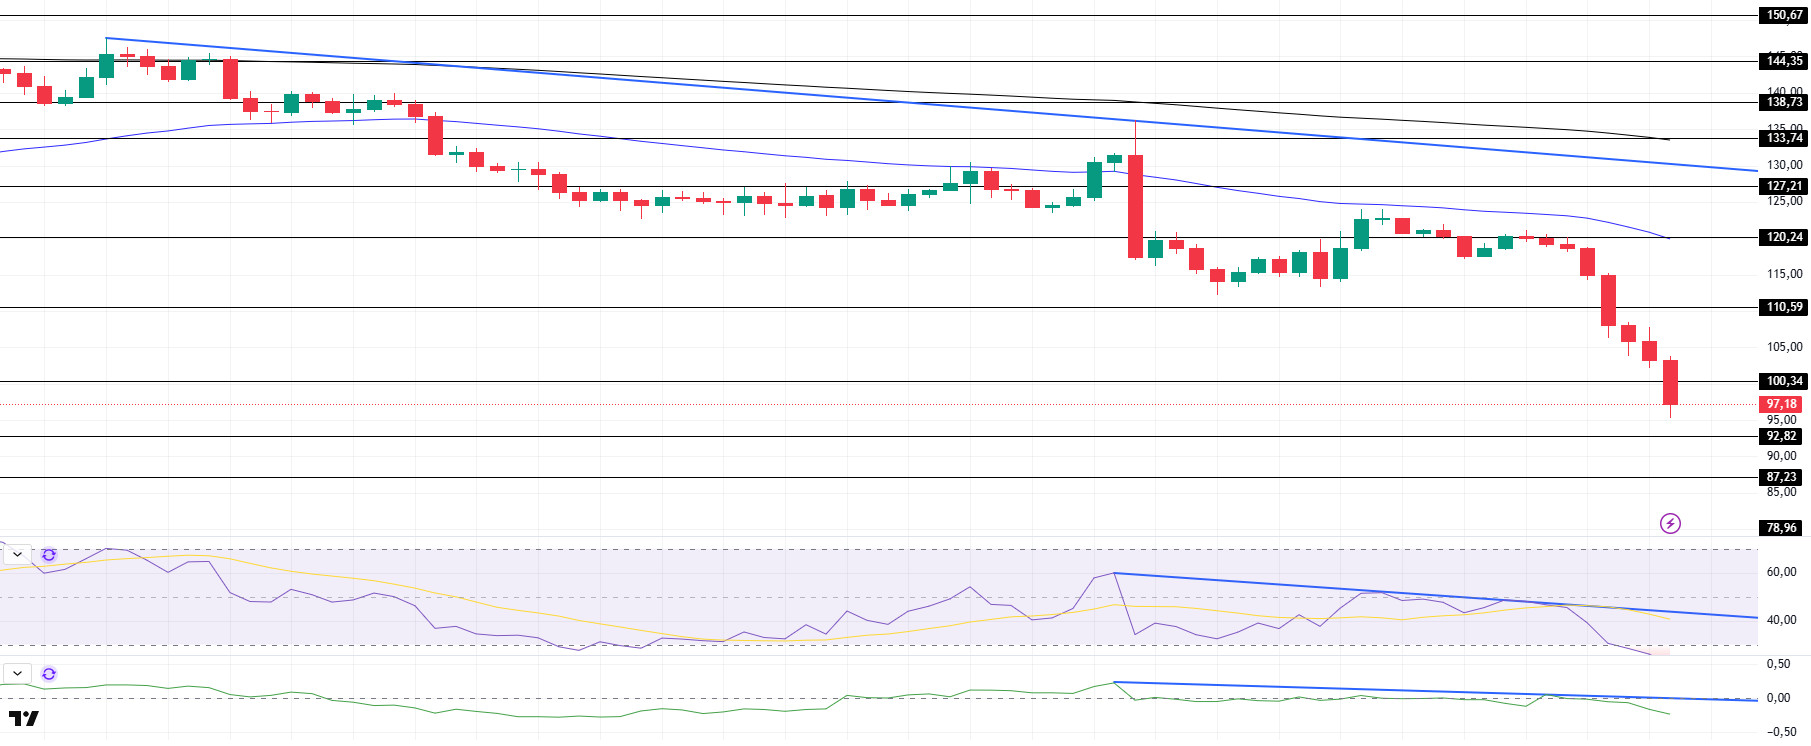
SOL continued to decline over the weekend, keeping pace with the crypto market. The asset continued the downtrend that started on March 25, falling as low as December 23, 2023. On the 4-hour timeframe, the 50 EMA (Blue Line) remained below the 200 EMA (Black Line). This could deepen the decline further in the medium term. At the same time, the price continued to move below the two moving averages. When we examine the Chaikin Money Flow (CMF)20 indicator, it is in the negative zone, but the daily volume is positive, which may cause CMF to move back to the positive zone. On the other hand, CMF continued its downtrend that started on April 2. However, the Relative Strength Index (RSI)14 indicator is in oversold territory. This may cause the price to move upwards during the day. The $110.59 level appears as a resistance point in the rises driven by the upcoming macroeconomic data and the news in the Solana ecosystem. If it breaks here, the rise may continue. In case of retracements for the opposite reasons or due to profit sales, the support level of $ 92.82 can be triggered. If the price comes to these support levels, a potential bullish opportunity may arise if momentum increases.
Supports 100.34 – 92.82 – 87.23
Resistances 110.59 – 120.24 – 127.21
DOGE/USDT
Mark Uyeda examines the SEC’s digital asset frameworks affecting DOGE. At Onchain, data on spot inflows and outflows reveals that exchanges have seen approximately $6.11 million worth of DOGE outflows in the last 24 hours.
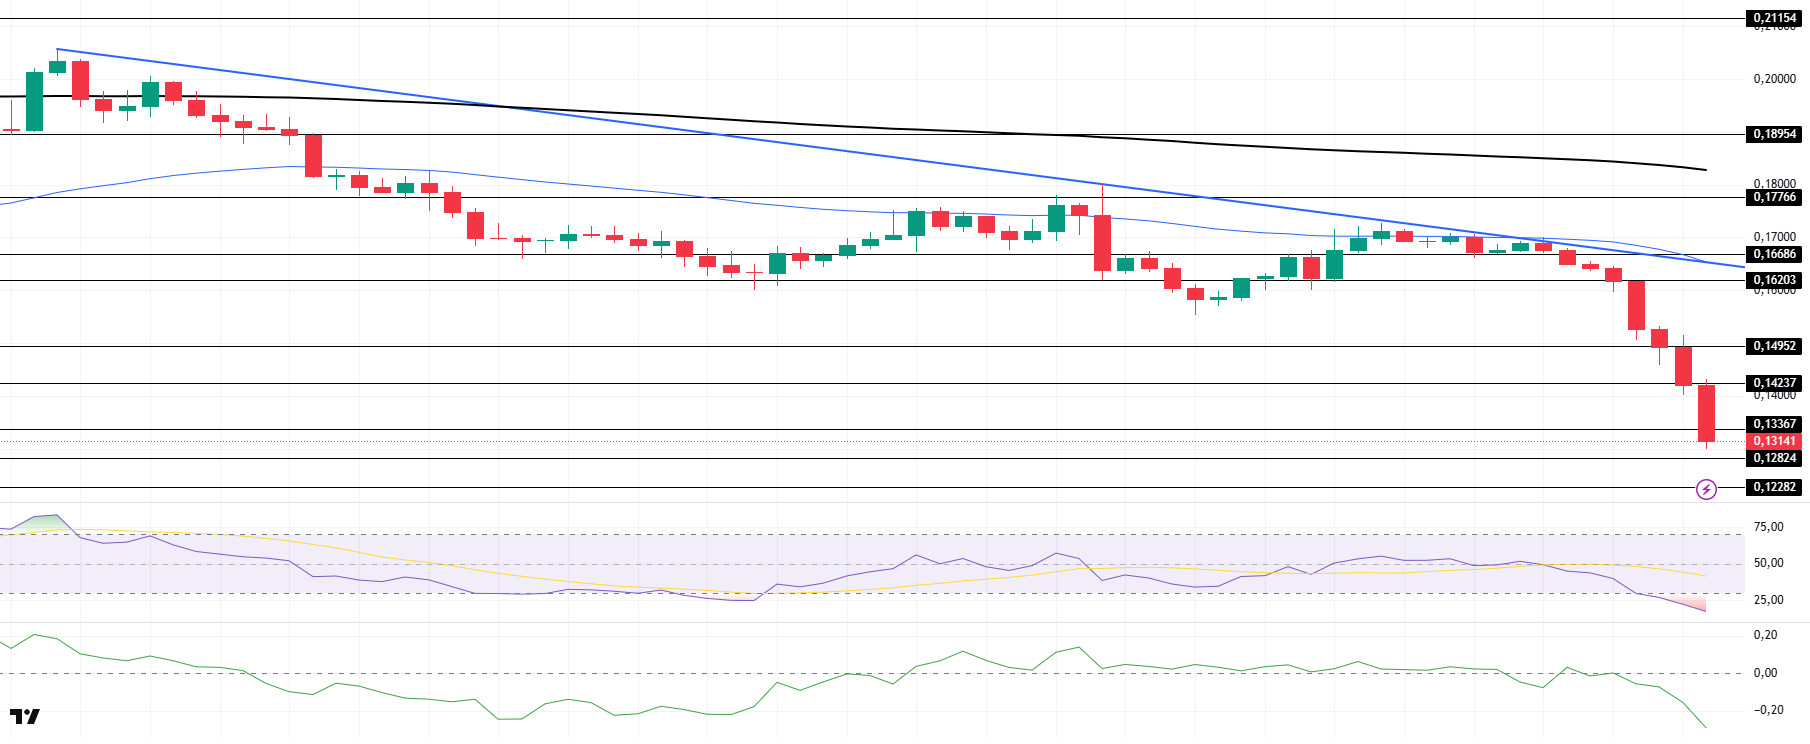
DOGE continued to fall over the weekend, keeping pace with the crypto market. The asset continues to hover below the downtrend that started on March 26. Breaking the strong support at $0.14952, the price continues to deepen its decline. On the 4-hour timeframe, the 50 EMA (Blue Line) remains below the 200 EMA (Black Line). This could mean that the decline could deepen in the medium term. However, the price continues to price below the two moving averages. The Chaikin Money Flow (CMF)20 indicator is in the extreme negative territory. In addition, the fact that the 24-hour volume is on the plus may increase the inflows, allowing CMF to move into the positive zone. On the other hand, Relative Strength Index (RSI)14 is in oversold territory. This may reduce selling pressure. The $0.14237 level stands out as a very strong resistance point in the rises due to political reasons, macroeconomic data and innovations in the DOGE coin. In case of possible pullbacks due to political, macroeconomic reasons or negativities in the ecosystem, the $ 0.12824 level, which is a strong support place, is an important support place. If the price comes to these support levels, a potential bullish opportunity may arise if momentum increases.
Supports 0.13367 – 012824 – 0.12282
Resistances 0.14237 – 0.14952 – 0.16203
Legal Notice
The investment information, comments and recommendations contained herein do not constitute investment advice. Investment advisory services are provided individually by authorized institutions taking into account the risk and return preferences of individuals. The comments and recommendations contained herein are of a general nature. These recommendations may not be suitable for your financial situation and risk and return preferences. Therefore, making an investment decision based solely on the information contained herein may not produce results in line with your expectations.
