
TECHNICAL ANALYSIS
BTC/USDT
US President Donald Trump made it clear that he has no plans to suspend the tariffs in a statement at the White House. Trump emphasized that many country leaders want trade negotiations, but the tariffs remaining in place are not an obstacle to this process. He also rejected the European Union’s offer to lift tariffs, saying it was “absolutely not enough”. Following these statements, rumors that tariffs could be suspended for 90 days led to a brief market recovery. However, in a statement to CNBC, the White House flatly denied these claims, calling them “fake news”.
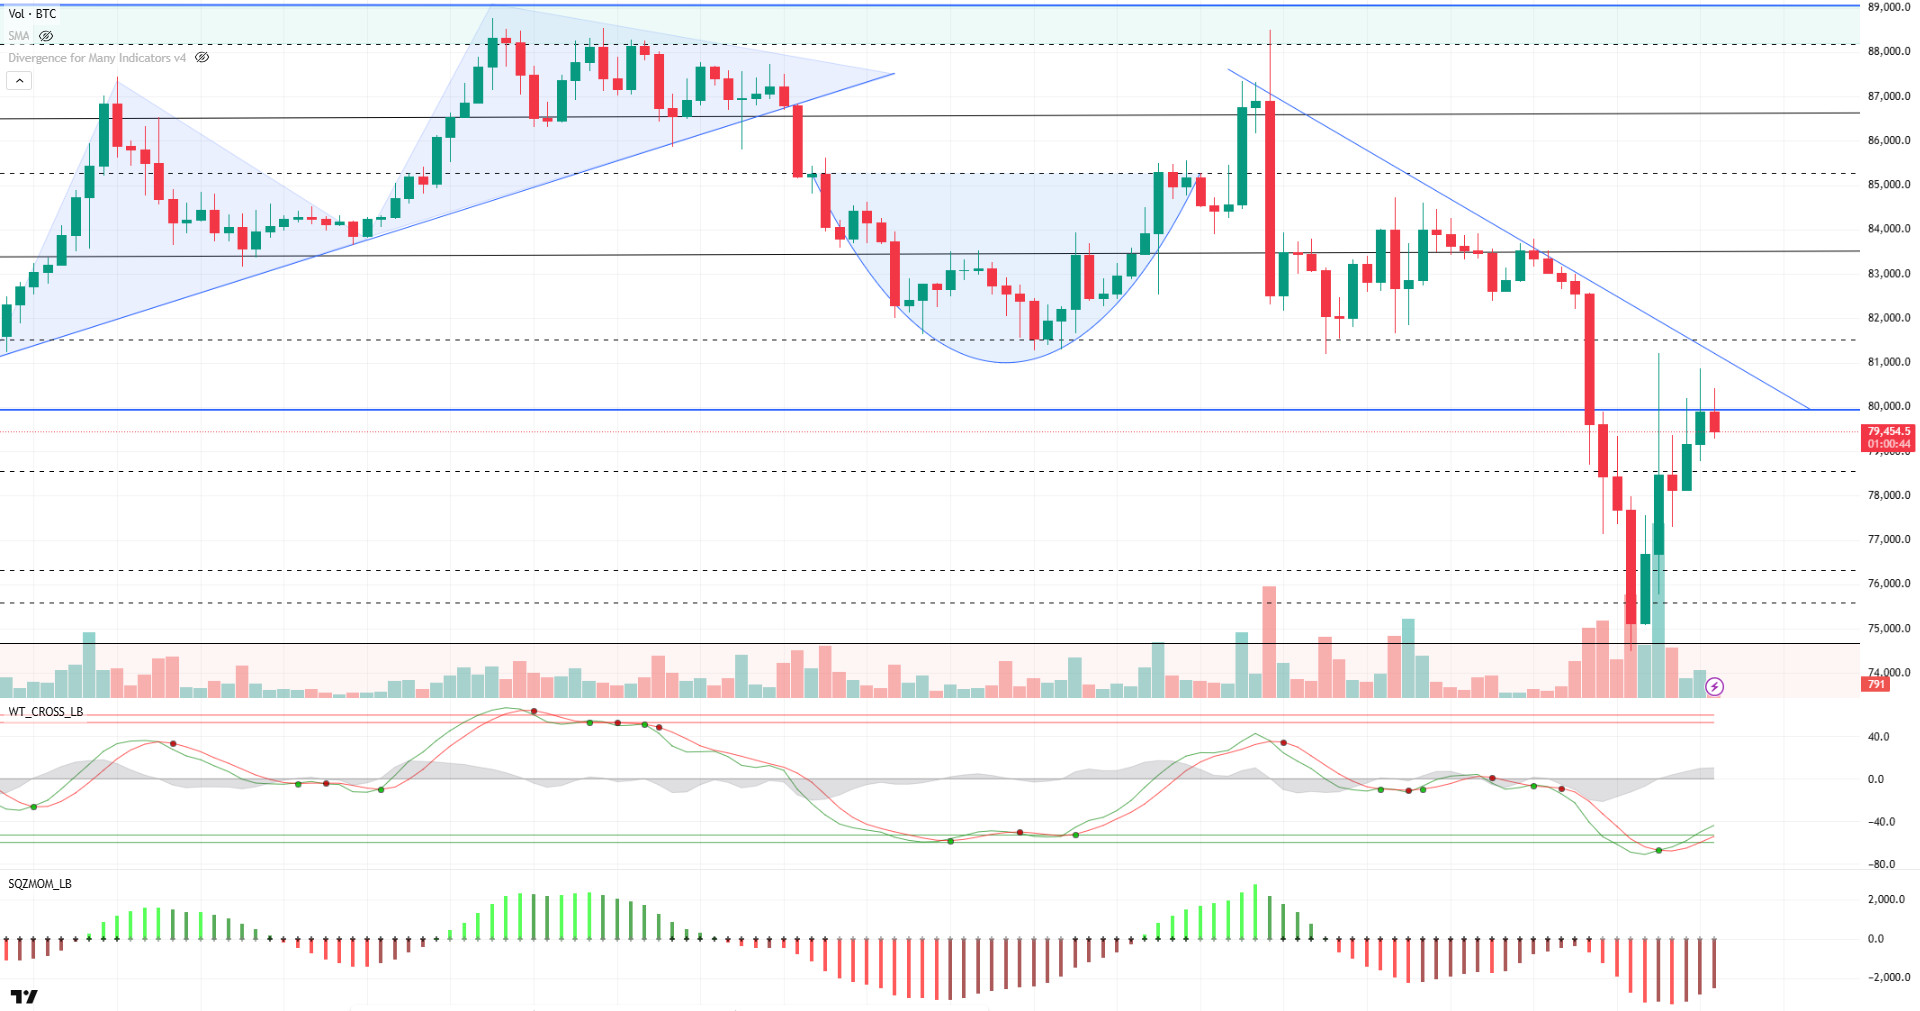
When we look at the technical outlook, with the impact of news flows, technical indicators coming to the oversold zone pulled the market up again. With the increasing volatility due to unfounded news, BTC retreated again, but recovered in a short time. When we look at yesterday’s price movements, the instant reflection of the change in the market’s risk perception on prices showed that for the moment, the bullish effect has not disappeared and the equation has not changed. BTC, which was trading at 79,500 at the time of writing the analysis, exceeded the 80,000 point, which we took as a reference level three times, but could not stay above it. Trading just below this level will be followed as an important threshold, if it is exceeded, the scenario is expected to reverse again, while if the rises remain as a correction, we may face new selling pressure. While our Wave trend oscillator continues to maintain its buy signal, the fact that only the hourly charts periodically signal a buy signal indicates that uncertainty continues. Liquidation data is dominated by short trades while ETF data remains negative. While institutional investor interest takes a break with Strategy, in the worst case scenario, it is useful to follow, even if it is very unlikely that such companies will take a position in the direction of sales. During this period, fundamental developments along with news flows will guide us. In case of possible sales, being in the gap zone continues to widen the price range, while the 78,500 level can be followed as a minor support point.
Supports: 78,500 -76,400 – 74,600
Resistances 80,000 – 81,500 – 83,500
ETH/USDT
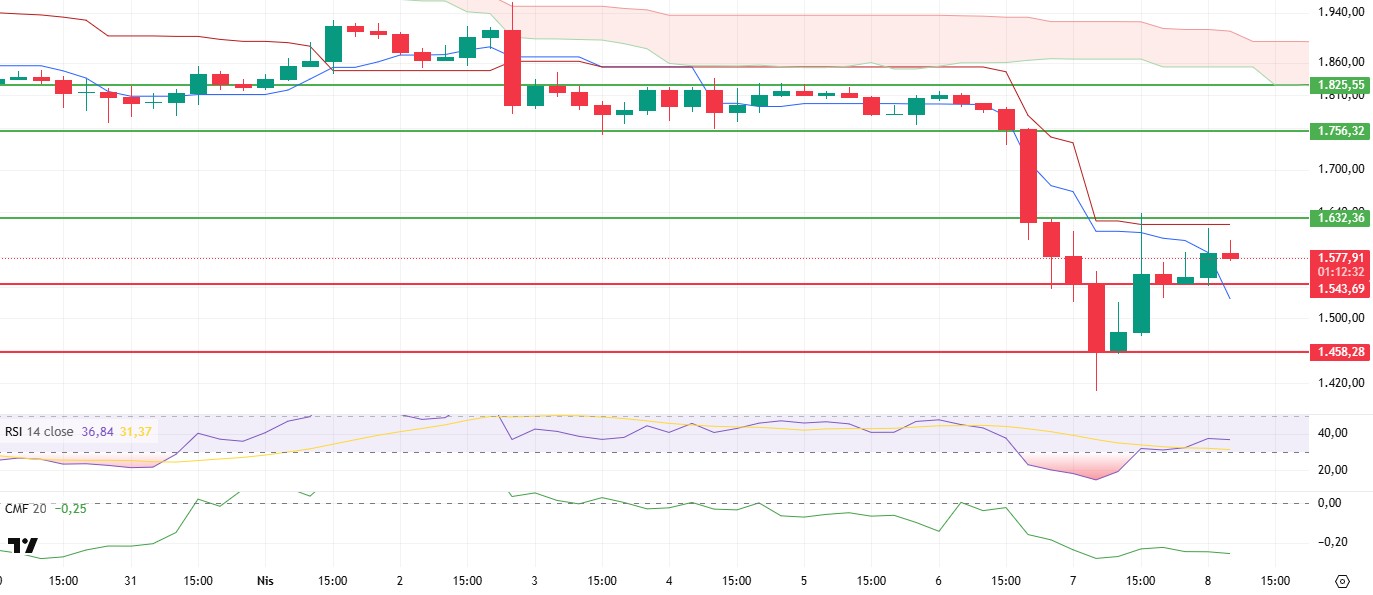
After sliding below the $1,458 support with the sharp selling pressure it experienced on Sunday night, ETH regained strength as the US stock markets recovered yesterday evening and surpassed the $1,543 level and is currently priced around $1,580. Although this recovery signals an improvement in the short term, technical indicators suggest that some weakness continues in the background of price action.
The Chaikin Money Flow (CMF) indicator continues its downward trend, failing to make any meaningful gains despite the price reclaiming the $1,543 level. This suggests that liquidity inflows into the market have been limited and the uptrend has been largely supported by the closing of short positions in futures. Therefore, the current bullish move is more of a correction than the beginning of a permanent and healthy trend. On the other hand, the Relative Strength Index (RSI) indicator’s upward momentum from the oversold zone can be considered as a positive signal in the short term. The fact that no negative divergence is observed in the RSI indicates that the current recovery is technically supported. When the Ichimoku indicator is analyzed, it is seen that the price has exceeded the tenkan level, but the tenkan level still shows a downward trend and the price remains between the tenkan and kijun levels, indicating that the uncertainty of direction in the market continues. This outlook does not produce a clear signal in terms of the continuity of the rise and indicates that caution should be exercised.
In general, there is a possibility of rising up to $1,632 during the day. If this level is exceeded, the upward movement can be expected to gain momentum. However, it should be noted that since the CMF and Ichimoku indicators are still fragile, selling pressure may increase again and deeper retracements may occur if the support of $1,543 is lost.
Supports 1,543 – 1,458 – 1,369
Resistances 1,632 – 1,756 – 1,825
XRP/USDT
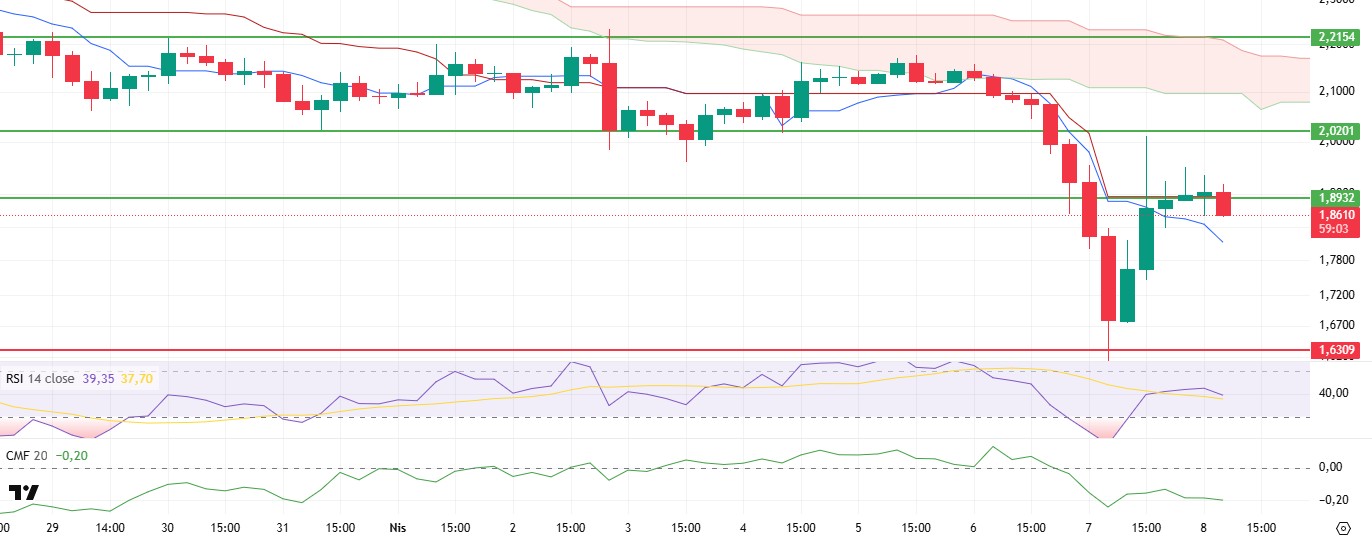
XRP retreated to the $1.63 level with increasing selling pressure since the end of the week. However, yesterday, with the effect of the general recovery in the US markets, it reacted strongly and started to rise again and managed to climb up to the main resistance at the $2.02 level. Failing to break through this important level, the price fell below the $1.89 support level with the re-intensified sales in the market during the night hours, and this level has been lost for the moment.
Technical indicators suggest that some significant vulnerabilities remain in the background of this price action. The Chaikin Money Flow (CMF) indicator failed to show any meaningful upside despite the price rebound and turned down again, indicating continued liquidity outflows. This outlook suggests that the rally was not spot market-driven but largely based on the closing of short positions in the futures markets. This raises doubts about the sustainability of the price action. Similarly, although the Relative Strength Index (RSI) indicator managed to break out of the oversold zone, it is struggling to generate structural upside strength and still exhibits weak momentum. Ichimoku Cloud analysis reveals the situation more clearly. Although XRP managed to briefly surpass the tenkan and kijun levels during yesterday’s rally, it entered the uncertainty zone by falling below the kijun level with the pullback in the morning hours. This indicates an indecisive situation for market participants and suggests that new confirmations are needed to clarify the direction of price action.
In general terms, the loss of the $1.89 support and the weakness in technical indicators suggest that the bearish trend may continue for a while in the short term. However, if the price regains the $1.89 level, this negative structure can be invalidated, and it may become possible for XRP to rise towards the $2.02 resistance again. At this point, it will be decisive for investors to carefully follow the price reaction, especially at the $1.89 level, in terms of short-term strategies.
Supports 1.6309 – 1.4264 – 1.2895
Resistances 1.8932 – 2.0201 – 2.2154
SOL/USDT
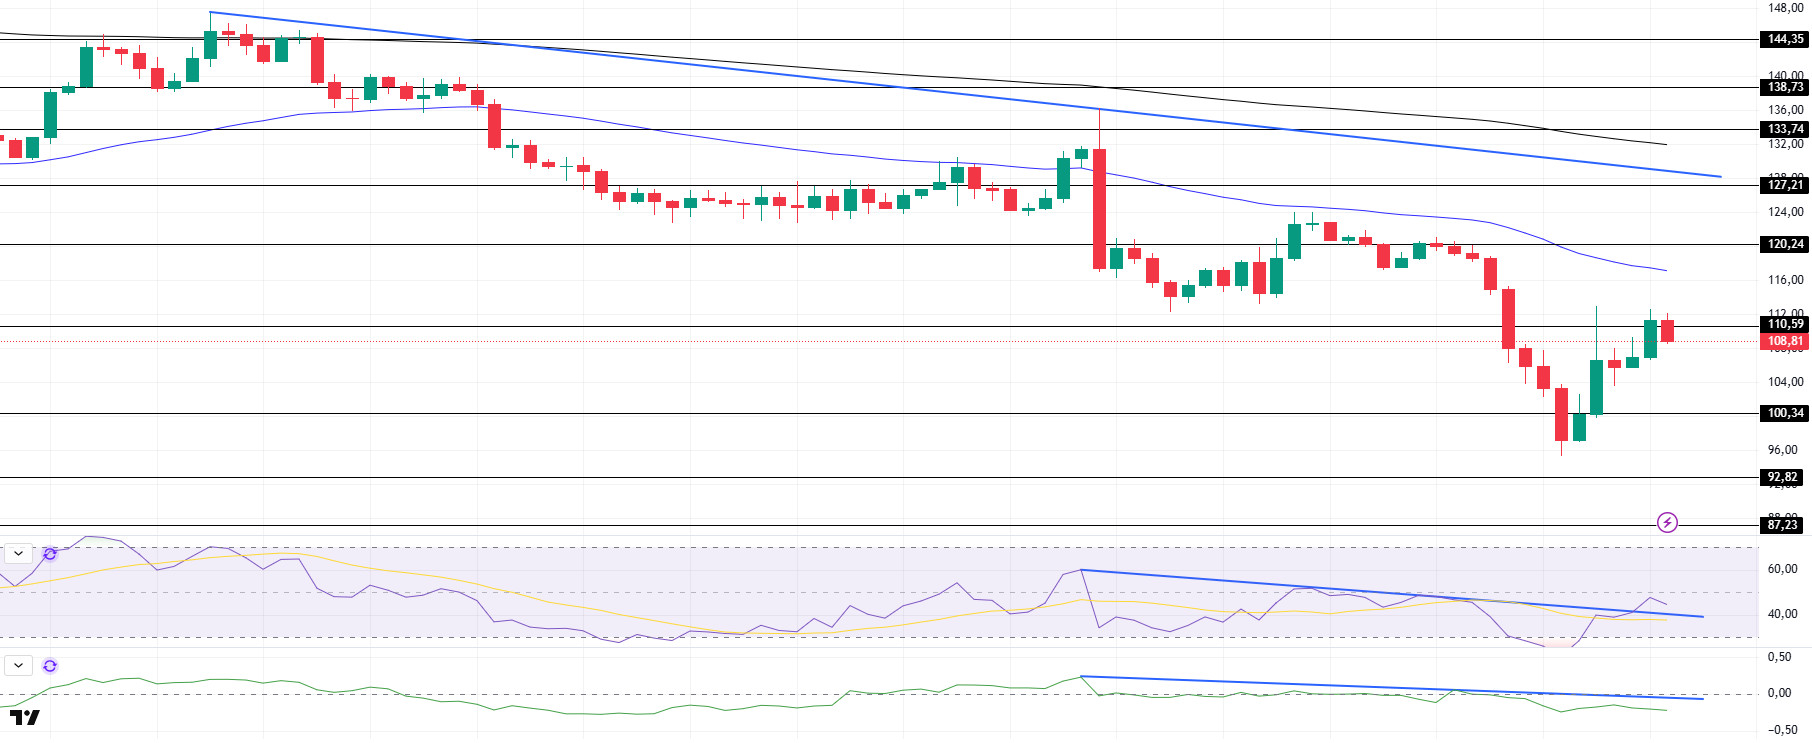
According to data from Coinglass, there were significant liquidations in Solana positions totaling approximately $86.3 million in the last 24 hours. Of this, $67.2 million was liquidated by buyers in long positions, while sellers covered $19.1 million in short positions. Additionally, more than $50 million worth of SOL tokens are scheduled to be unlocked this week.
SOL has been bullish since our analysis yesterday. The asset has risen by around 12%, continuing the downtrend that started on March 25th. On the 4-hour timeframe, the 50 EMA (Blue Line) remained below the 200 EMA (Black Line). This could deepen the decline further in the medium term. At the same time, the price continues to move below the two moving averages. When we examine the Chaikin Money Flow (CMF)20 indicator, it is in the negative zone, but the daily volume is positive, which may cause CMF to move back to the positive zone. On the other hand, CMF continued its downtrend that started on April 2. However, the Relative Strength Index (RSI)14 indicator rose from the oversold zone to the middle levels of the negative zone, breaking the downtrend that started on April 2. The $110.59 level stands out as a resistance point in the rises driven by the upcoming macroeconomic data and the news in the Solana ecosystem. If it breaks here, the rise may continue. In case of retracements for the opposite reasons or due to profit sales, the support level of $92.82 can be triggered. If the price comes to these support levels, a potential bullish opportunity may arise if momentum increases.
Supports 100.34 – 92.82 – 87.23
Resistances 110.59 – 120.24 – 127.21
DOGE/USDT
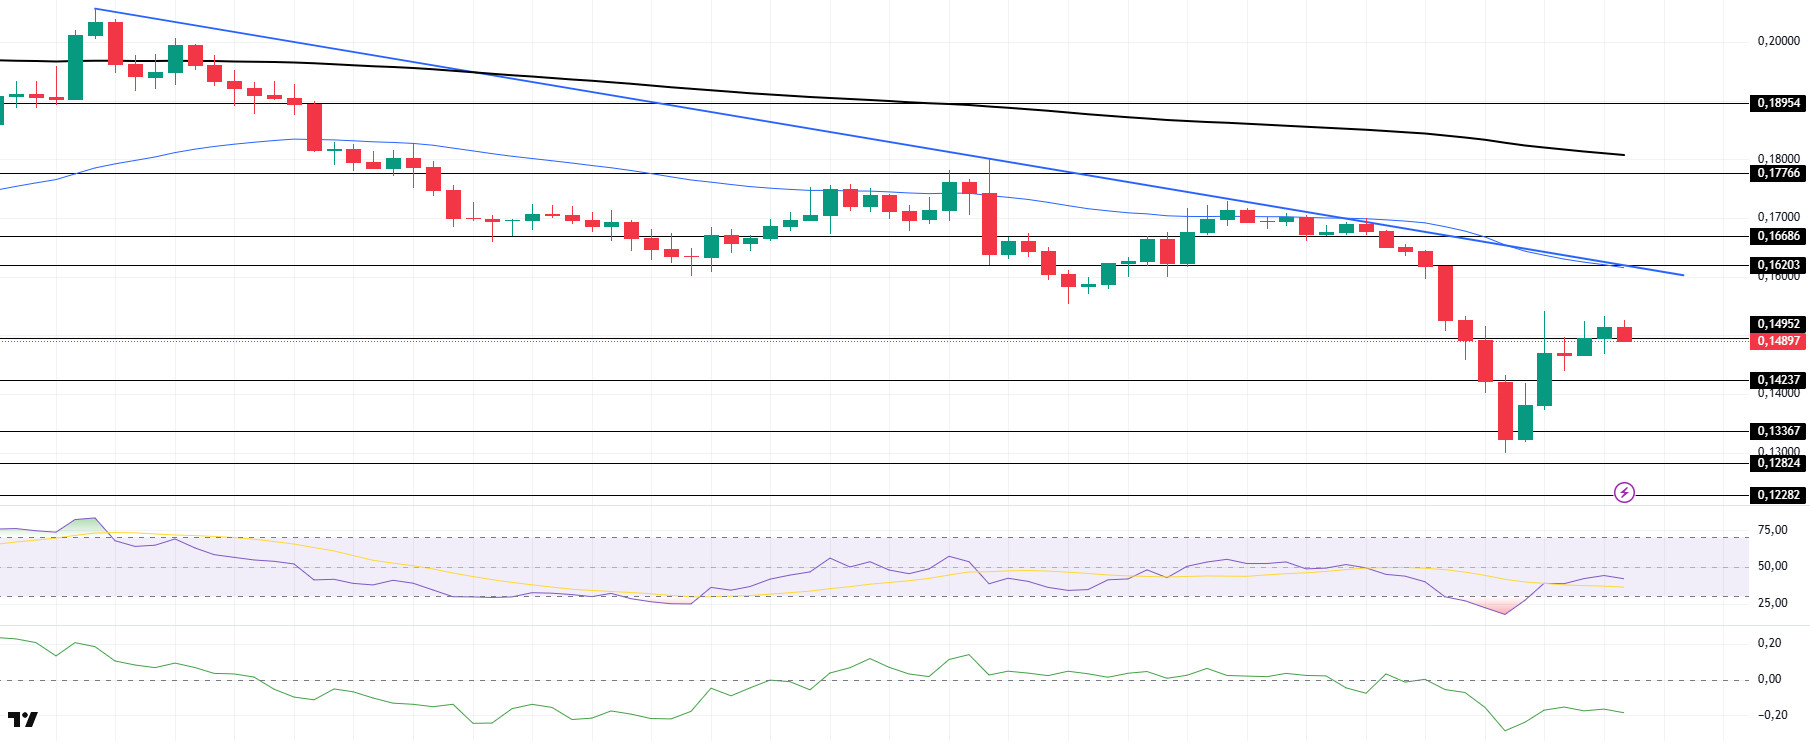
DOGE has rallied since our analysis yesterday. The asset continues to hover below the downtrend that started on March 26. The price is currently at the strong resistance at $0.14952, and if it breaks there, it may test the $0.16686 level as resistance. On the 4-hour timeframe, the 50 EMA (Blue Line) continues to be below the 200 EMA (Black Line). This could mean that the decline could deepen in the medium term. However, the price continues to price below the two moving averages. The Chaikin Money Flow (CMF)20 indicator is in the extreme negative territory. In addition, the fact that the 24-hour volume is on the rise may increase the inflows and cause CMF to rise. On the other hand, Relative Strength Index (RSI)14 rose from the oversold zone and reached the mid-level of the negative zone, but selling pressure continues. The $0.16686 level is a very strong resistance point in the rises due to political reasons, macroeconomic data and innovations in the DOGE coin. In case of possible retracements due to political, macroeconomic reasons or due to negativities in the ecosystem, the $0.13367 level, which is a strong support place, is an important support place. If the price comes to these support levels, a potential bullish opportunity may arise if momentum increases.
Supports 0.14952 – 0.14237 – 013367
Resistances 0.16203 – 0.16686 – 0.17766
Legal Notice
The investment information, comments and recommendations contained herein do not constitute investment advice. Investment advisory services are provided individually by authorized institutions taking into account the risk and return preferences of individuals. The comments and recommendations contained herein are of a general nature. These recommendations may not be suitable for your financial situation and risk and return preferences. Therefore, making an investment decision based solely on the information contained herein may not produce results in line with your expectations.
