
TECHNICAL ANALYSIS
BTC/USDT
The strategic Bitcoin reserve approved by Trump did not fully meet market expectations. on Friday At a meeting, the Trump administration approved the establishment of a strategic Bitcoin reserve, but it was announced that the reserve would only consist of confiscated Bitcoins held by the US and that no new assets would be added to the treasury. This disappointed investors who were expecting new Bitcoin purchases in the short term. Nevertheless, the legal status of Bitcoin in the US, on par with gold and oil, is a historic development in terms of institutional acceptance of crypto assets. committee
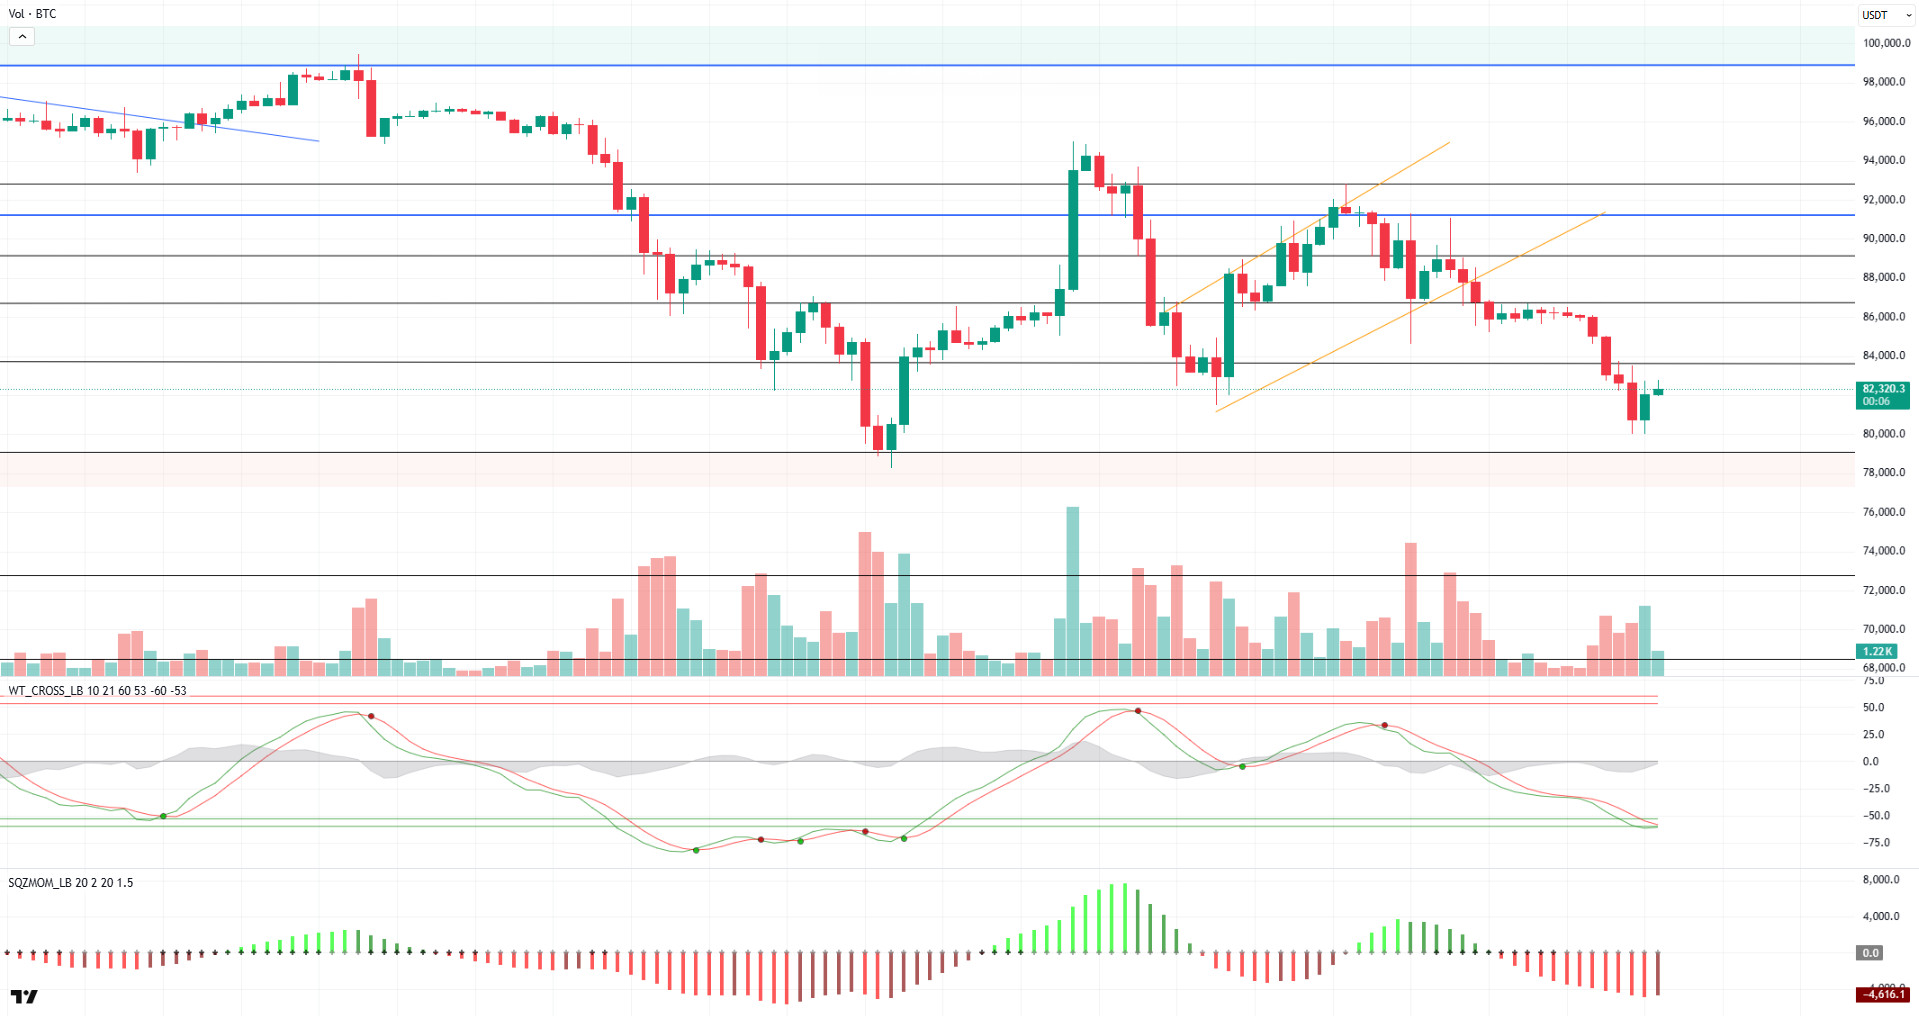
When we look at the technical outlook, a gradual selling pressure the BTC price due to fundamental developmentsit is seen that. The price action, which formed an ABCD pattern, broke the rising trend channel downwards, falling before reaching point D. As the selling pressure increased, BTC fell as low as 80,000 levels, forming here dominates a double bottom formation. With technical oscillators reaching the oversold zone, it is observed that the sell signals have weakened, and momentum indicators have started to regain momentum, creating the potential for BTC to catch an uptrend once again. BTC, which is currently trading at 82,300, will first the 83,500 minor resistance level if it is bullish again follow the closes above. On the other hand, BTC is likely to test the 79,000 level as the previous low in a possible new selling pressure. A break below this level could lead to deeper selling pressure.
Supports: 80,000 -77,000 – 74,600
Resistances 83,500 – 86,500 – 89,000
ETH/USDT
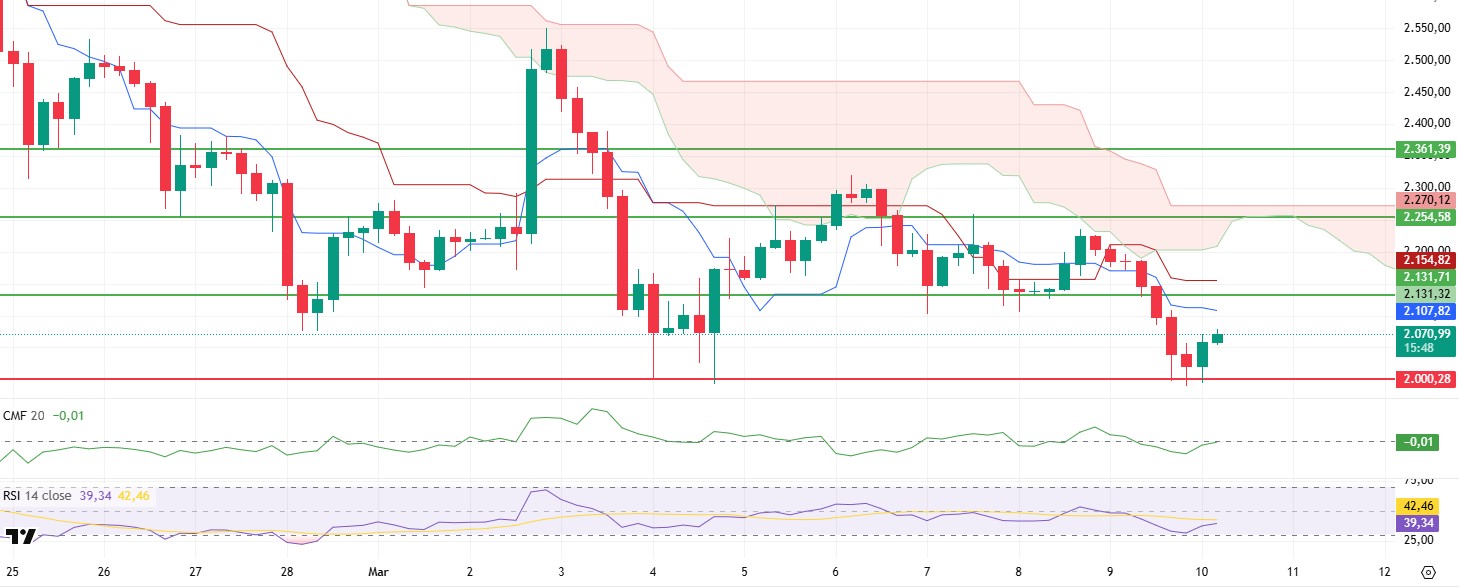
ETH lost the support level of $ 2,131 and retreated to $ 2,000 levels on Sunday due to the selling pressure on the futures side in low-volume market conditions. It can be said that this decline was also influenced by the speech of FED Chairman Jerome Powell on Friday evening and the weakening of investor confidence by the sub-expected statements at the White House Digital Asset Summit. Although the price recovered somewhat with purchases from the $2,000 level, it is observed that the downside risk continues.
When technical indicators are analyzed, the formation of a double bottom at the $2,000 level draws attention. In addition, the fact that the Relative Strength Index (RSI) indicator reacted from a point close to the oversold zone and started to rise indicates a positive short-term outlook. In addition, the Chaikin Money Flow (CMF) indicator rose back to zero after moving into negative territory, indicating that buyers have reasserted their dominance over the market and the liquidity flow has begun to recover. This is a strong signal that Ethereum could gain positive momentum in the short term. However, the Ichimoku indicator is more cautious in terms of price action. After the price’s from the kumo cloud on Saturdayreaction , the tenkan level cut the kijun level downwards and the price hovered below both levels can be considered negative.
Overall, technical indicators are largely positive, suggesting that the price has the potential to rise back up to the $2,131 level during the day. However, the weakness in the Ichimoku indicator and the continued closures below this level reveal that bearish risks remain if the price remains below the $2,131 level. If the $2,131 level is sustained above the $2,254 level, an upward movement towards the $2,254 level could be triggered. Otherwise, the possibility of the price retreating back to the $2,000 level should not be ignored. ETH
Supports 2,000 – 1,910 – 1,755
Resistances 2,131 – 2,254 – 2,361
XRP/USDT
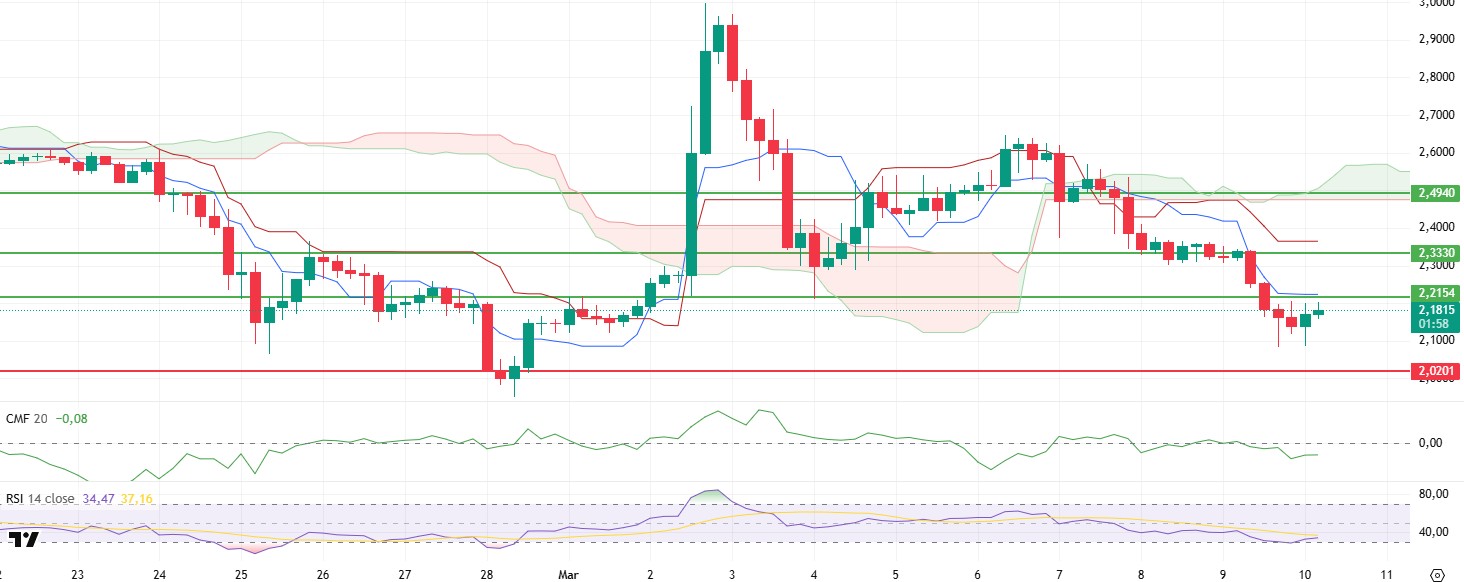
XRP retreated sharply on Friday as it lost its $2.49 support and held on to the $2.33 level. With the decline in the crypto market on Sunday, this level was also broken and fell below the support of $ 2.21.
With this price action, technical indicators also saw some very important changes. Based on the Ichimoku indicator, the XRP price, which has maintained a positive outlook for a long time, sagged under the kumo cloud. The fact that the tenkan level cut the kijun level downwards and the price remained below both levels indicates that the negative outlook continues. The Chaikin Money Flow (CMF) indicator also continued its downward movement in the negative area, indicating that liquidity outflows continue. Relative Strength Index (RSI), on the other hand, gains upward momentum with the support it receives in the oversold zone, indicating an increase in momentum and looks positive.
As a result, considering the weak outlook in indicators and the persistence below 2.21, a horizontal course or slight declines can be expected during the day. The most important support point to follow is the $ 2.02 level. Violation of this region may bring more drastic declines. The regain of the $ 2.21 level may trigger an upward movement up to $ 2.33 in the short term.
Supports 2.0201 – 1.8932 – 1.6309
Resistances 2.2154 – 2.3330 – 2.4940
SOL/USDT
Lily Liu, Executive Director of the Solana Foundation, expressed concerns about SIMD-228, the network’s proposal to adjust the emissions of its native SOL token based on stake participation, calling it “very half-baked”. However, Solana co-founder Anatoly Yakovenko has a different view and that he stands behind the plan despite their disagreement has stated. On the other hand, Solana’s Open Interest data (OI) increased by to $31.63% .95 billion.
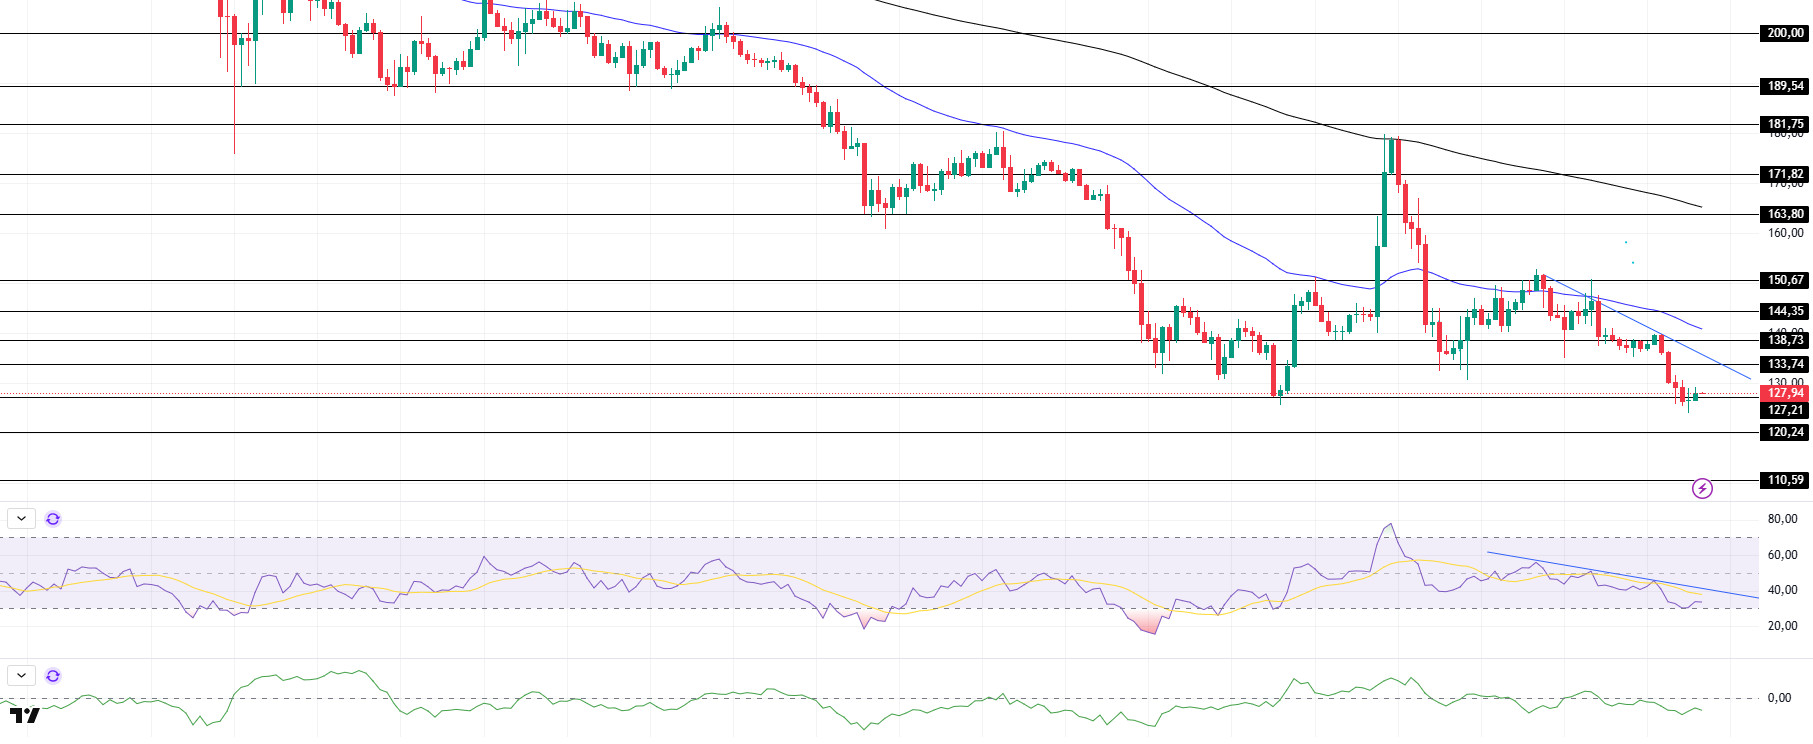
SOL continued its declines, keeping pace with the broader market. On the 4-hour timeframe, the 50 EMA (Blue Line) 200 EMA continues to be below. This could deepen the decline further in the medium term. At the same time, the price started moving below the two moving averages. the (Black Line) The Chaikin Money Flow (CMF)20 indicator moved into negative territory. However, an increase in volume may increase inflows. However, the Relative Strength Index (RSI)14 indicator has started to accelerate up from the oversold zone. At the same time, RSI continues its downtrend from March 5. The $ 133.74 level stands out as a very strong resistance point. here, in the rises driven by both the upcoming macroeconomic data and in the Solana ecosystem the news If it breaks the rise may continue. In case of retracements for reasons or due to profit sales, the the opposite support level of 120.24 dollars can be triggered. If the price comes to these support levels, a potential bullish opportunity may arise if momentum increases.
Supports 127.21 – 120.24 – 110.59
Resistances 133.74 – 138.73 – 144.35
DOGE/USDT
Whale investors holding large amounts of DOGE reacted to the increasing bearishness. Addresses holding 100 million to 1 billion DOGE over $400 million sold 2 billion DOGE. At the same time, Dogecoin’s daily active addresses 36dropped to 1 thousand, while the number of transactions fell to 13.9 thousand.
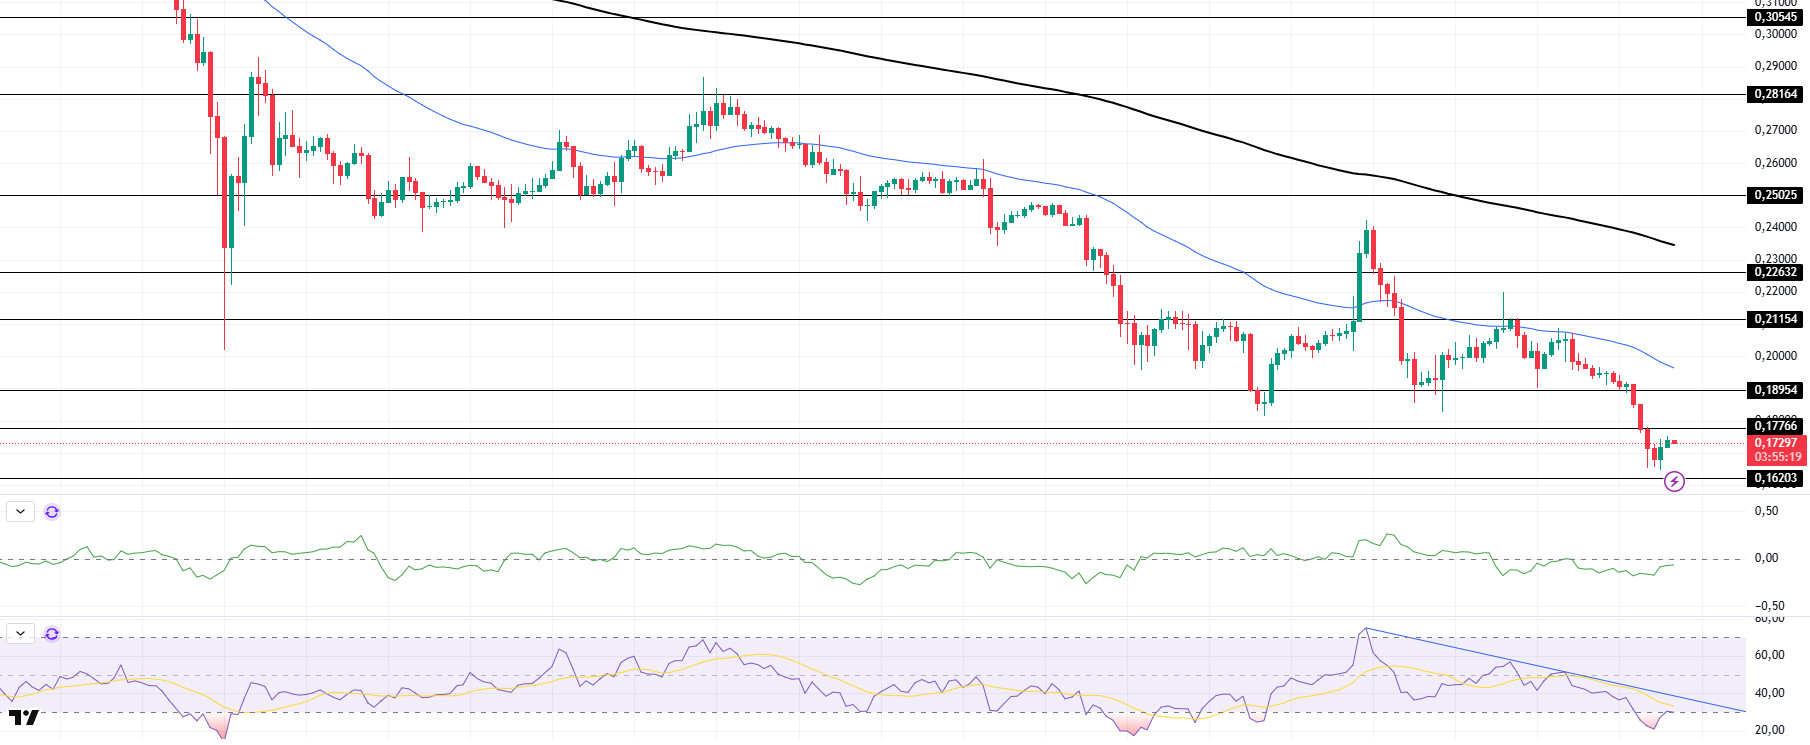
DOGE kept pace with the broader market and turned bearish over the weekend. Although the price tested the 50 EMA twice as resistance, it failed to break it and the decline deepened. On the 4-hour timeframe, the 50 EMA (Blue Line) is below the 200 EMA (Black Line). This could mean that the decline could deepen in the medium term. However, the price started to hover below the two moving averages. The larger gap between the two moving averages increases the probability that DOGE will rise. The Chaikin Money Flow (CMF)20 indicator is in negative territory. However, the increase in daily volume may increase money inflows and cause CMF to rise. On the other hand, Relative Strength Index (RSI)14 is in oversold territory and RSI continues to hover below the downtrend on March 2. due to political reasons, macroeconomic data the level appears to be a very strong resistance point. In case of possible $0.18954 in the rise’s innovations in the coin and DOGE pullbacks, due to macroeconomic reasons political, or negativities in the ecosystem the .14952, which is the base level of the trend, $0level appears as an important support. If the price reaches these support levels, a potential bullish opportunity may arise if momentum increases.
Supports 0.16203 – 0.14952 – 0.14237
Resistances 0.17766 – 0.18954 – 0.21154
LEGAL NOTICE
The investment information, comments and recommendations contained herein do not constitute investment advice. Investment advisory services are provided individually by authorized institutions taking into account the risk and return preferences of individuals. The comments and recommendations contained herein are of a general nature. These recommendations may not be suitable for your financial situation and risk and return preferences. Therefore, making an investment decision based solely on the information contained herein may not produce results in line with your expectations.
