
TECHNICAL ANALYSIS
BTC/USDT
Investor sentiment continues to be negatively impacted as crypto and traditional markets have plummeted. Massive losses on Wall Street accelerated outflows from risky assets, including Bitcoin and Ethereum. On US exchanges, the Nasdaq lost 4%, while crypto-linked stocks MicroStrategy and Coinbase fell 16.68% and 17.58%, respectively. On the other hand, El Salvador and Paraguay signed a cooperation agreement on cryptocurrency regulations. Also, onchain data showed that Mt. Gox was found to have transferred 11,502 BTC to an unknown wallet.
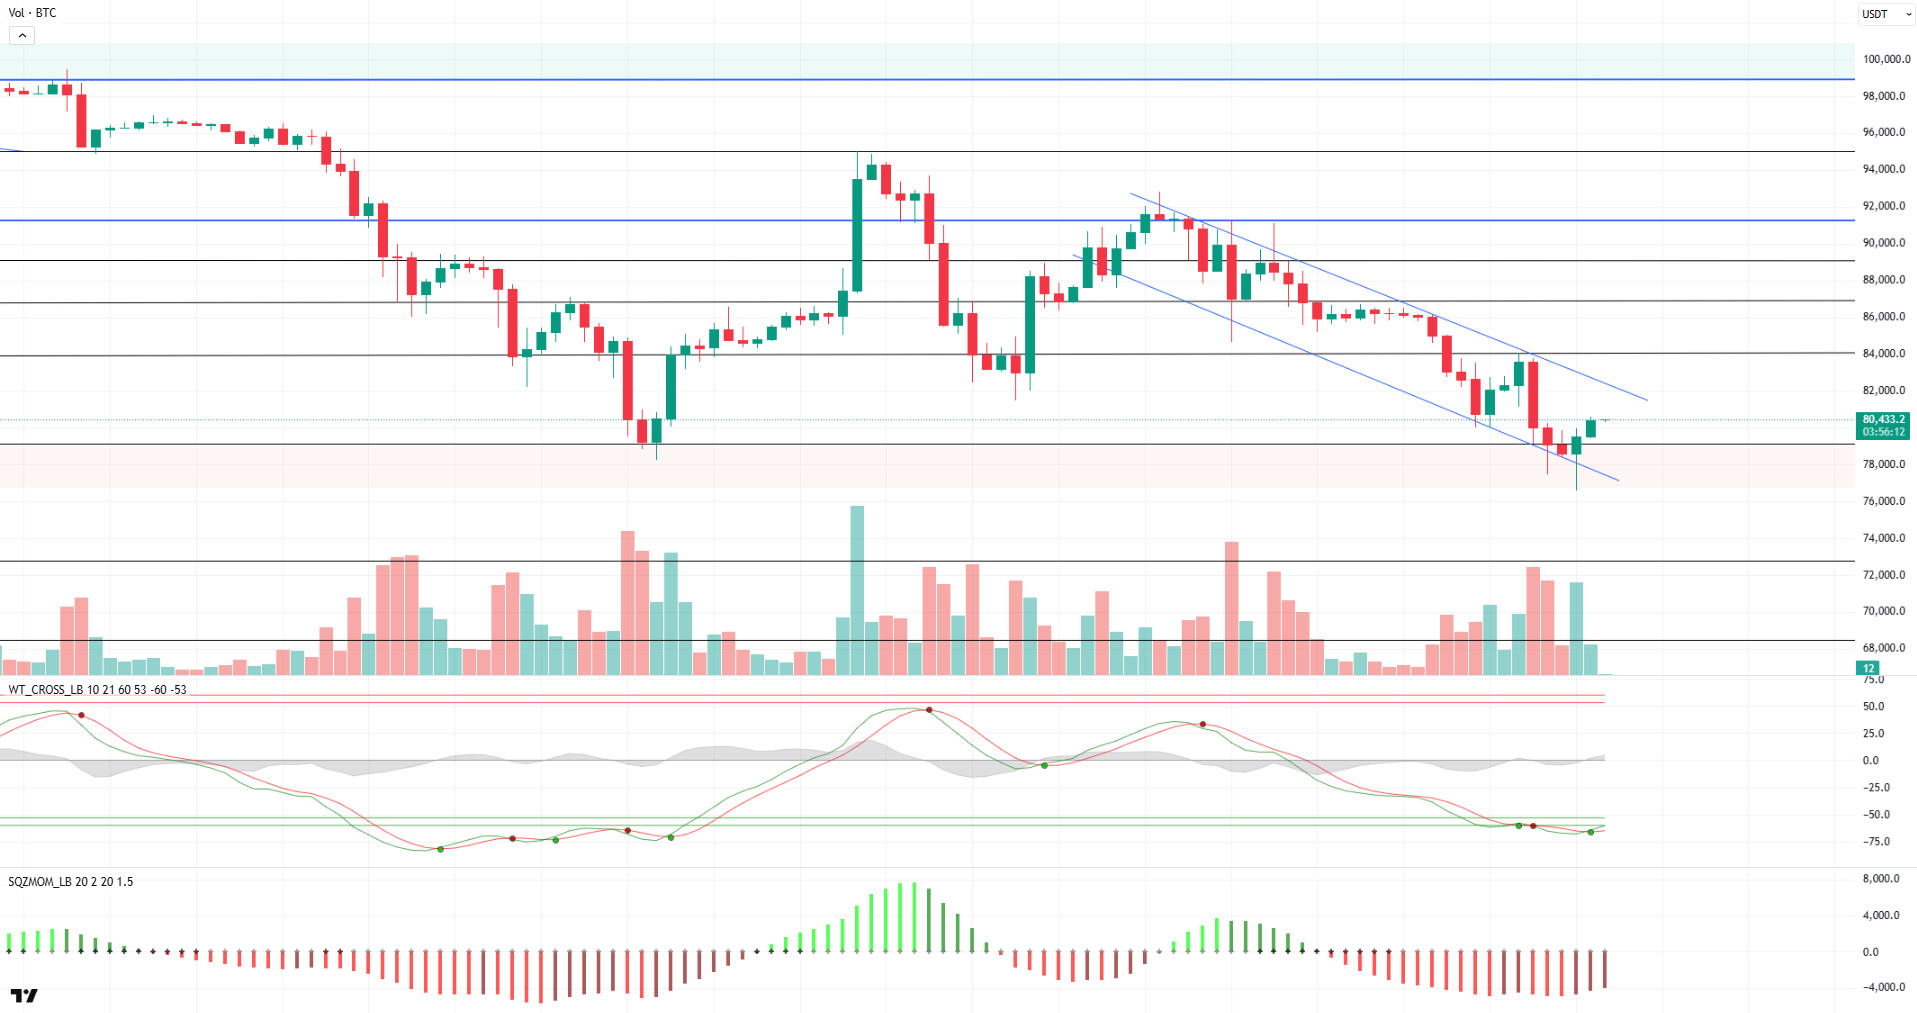
When we look at the technical outlook, BTC, which continues its pricing within the falling trend structure, broke the $ 80,000 reference level downwards and fell to $ 76,600. BTC, which last fell below $ 80,000 on February 28, rose to $ 95,000 with strong demand from this level. However, with fundamental factors and a wave of selling, BTC once again tested below $80,000 and recovered from there. In BTC, which is currently trading at $ 80,400, we see that the technical oscillators have turned the sell signal in the oversold zone back to the buy signal. However, momentum indicators do not yet fully support the buy side. On the hourly charts, while the buy signals are getting stronger, it is seen that they are starting to be supported on the momentum side. In the continuation of the uptrend, the break of the falling trend structure is critical for the start of a new uptrend. In a bearish scenario, the $ 80,000 level continues to be monitored as a reference point in the short term.
Supports 80,000 – 77,000 – 74,600
Resistances 83,500 – 86,500 – 89,000
ETH/USDT
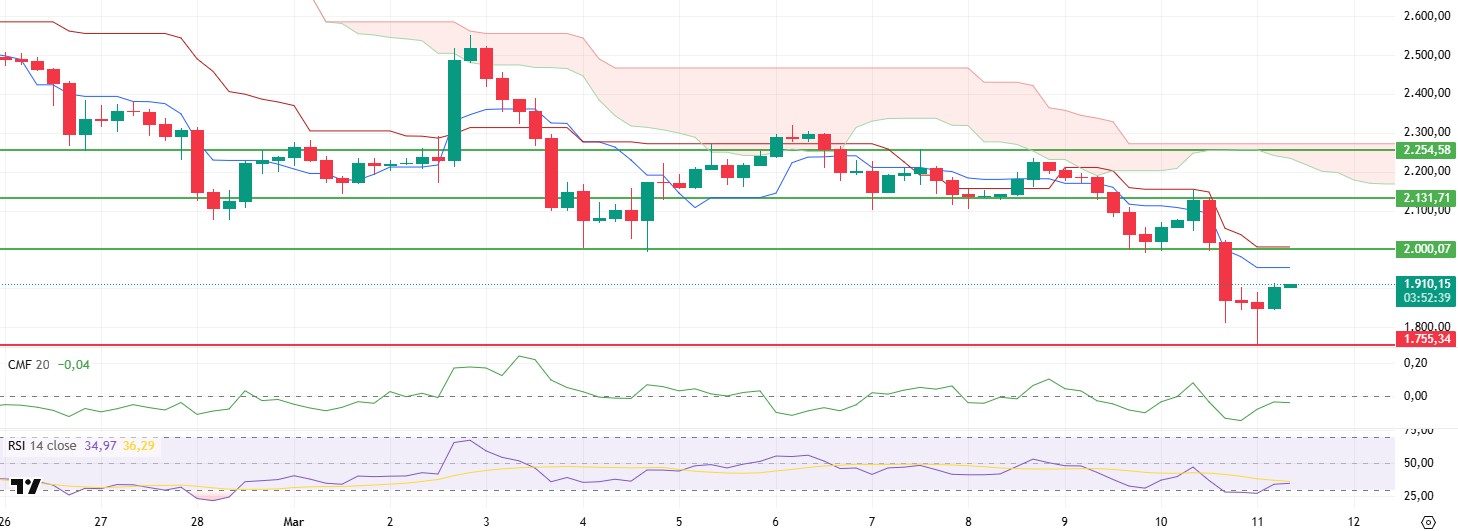
ETH fell sharply yesterday evening with the decline in the US stock markets, first falling to the $ 2,000 level and then breaking this level and falling to $ 1,758. It can be said that the risky outlook continues for ETH, which rose to $ 1,900 again with the reaction it received from the $ 1,755 level.
When technical indicators are analyzed, after the Chaikin Money Flow (CMF) indicator fell sharply into the negative zone, it has converged to the zero line by reacting at $ 1,755. Despite the slight recovery in liquidity flow, it can be said that risks still remain. Relative Strength Index (RSI), on the other hand, has formed a turn signal with the support it received from the oversold zone. With the recovery in momentum, maintaining the support level has created a slightly positive picture.
As a result, although the slight recovery in the price and the operation of the support zone at $ 1,755 support upward price movements, the macro-scale risks and the possibility that the price may retreat to 1,755 and lower if the collapse in the American technology market continues remain valid.
Supports 1,755 – 1,665 – 1,539
Resistances 2,000- 2,131 – 2,254
XRP/USDT
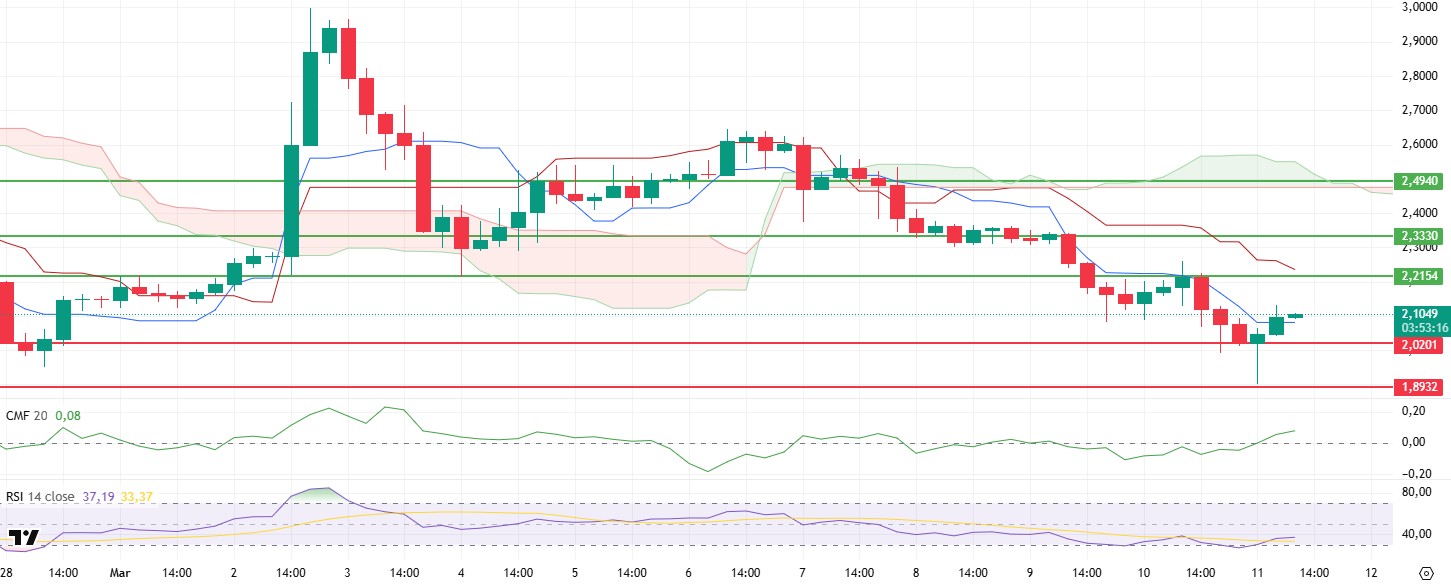
XRP was also affected by yesterday’s deep declines, first to the $ 2.02 level, then losing this support and retreating to the $ 1.89 support. With the support it received from the $ 1.89 level, it rose again to the $ 2.09 level.
Looking at the technical indicators, the strong rise of the Chaikin Money Flow (CMF) indicator, which has been declining in the negative area for a long time with the price movement, moving back to the positive area, indicates liquidity inflows and strengthening buyer dominance. Relative Strength Index (RSI), on the other hand, has not yet given a positive confirmation, although it has gone slightly up with the reaction it received from the oversold zone. When the Ichimoku indicator is analyzed, it seems positive that the price gained the tenkan level.
As a result, if the price manages to maintain the support of $ 2.02 during the day, rises to $ 2.21 levels seem possible again. However, the loss of $ 2.02 support may bring deeper declines.
Supports 2.0201 – 1.8932 – 1.6309
Resistances 2.2154 – 2.3330 – 2.4940
SOL/USDT
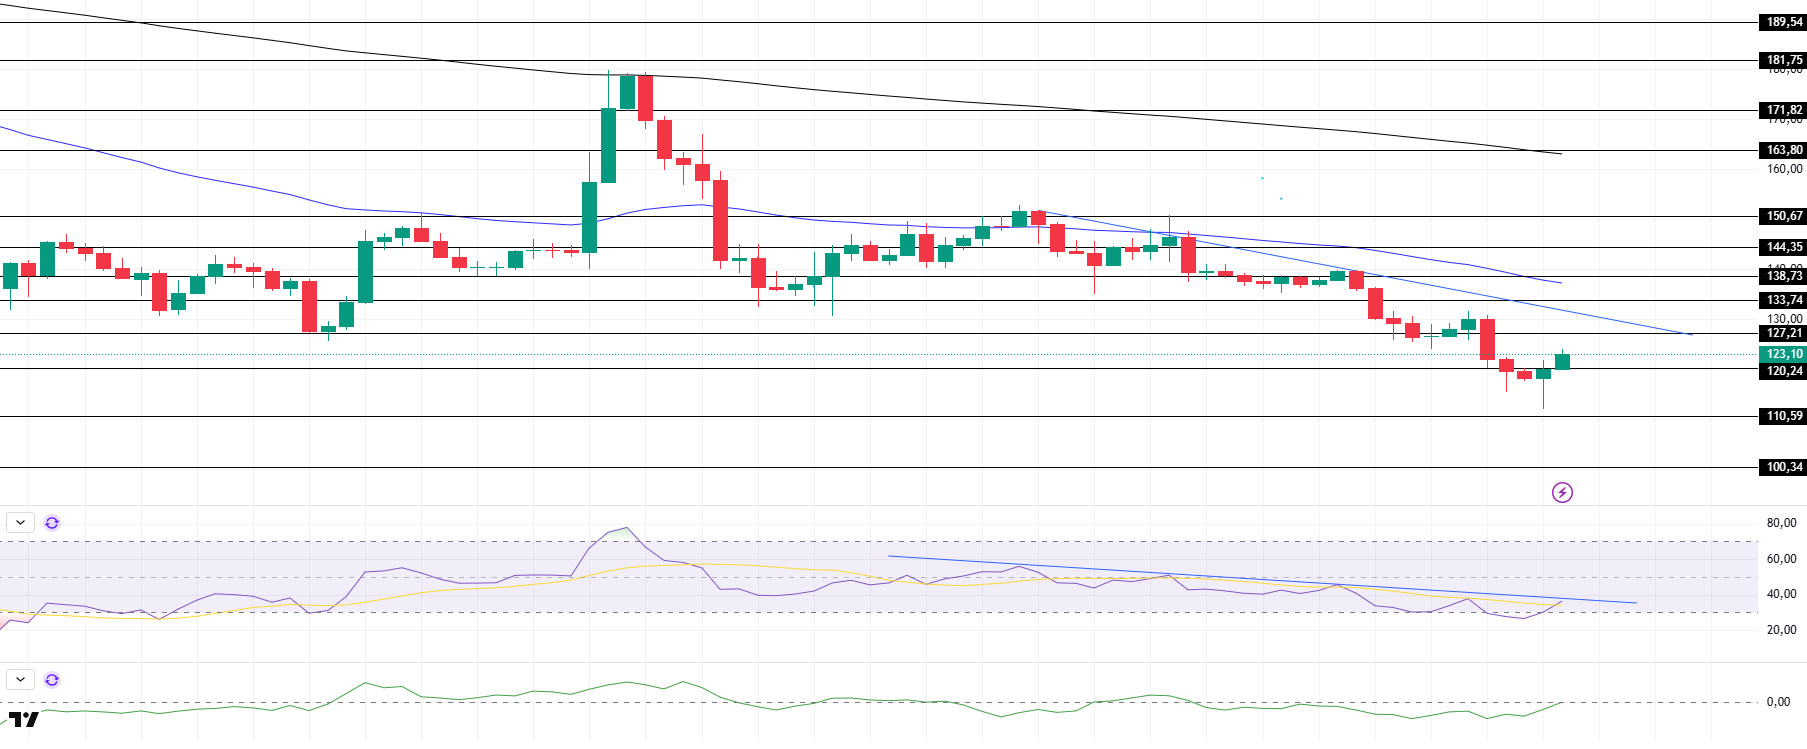
The level of social dominance around Solana has also fallen to a four-month low. Indeed, the 19% drop in Solana’s Open Interest data since early March signaled a decline in interest.
SOL continued its decline as the market retreated. On the 4-hour timeframe, the 50 EMA (Blue Line) continues to be below the 200 EMA (Black Line). This could deepen the decline further in the medium term. At the same time, the price is moving below two moving averages. The Chaikin Money Flow (CMF)20 indicator is in neutral territory. However, an increase in volume may increase money inflows. However, the Relative Strength Index (RSI)14 indicator is testing the downtrend that started on March 5 from the oversold zone as resistance. The $ 133.74 level appears to be a very strong resistance point in the rises driven by both the upcoming macroeconomic data and the news in the Solana ecosystem. If it breaks here, the rise may continue. In case of retracements for the opposite reasons or due to profit sales, the support level of 120.24 dollars can be triggered. If the price comes to these support levels, a potential bullish opportunity may arise if momentum increases.
Supports 120.24 – 110.59 – 100.34
Resistances 127.21 – 133.74 – 138.73
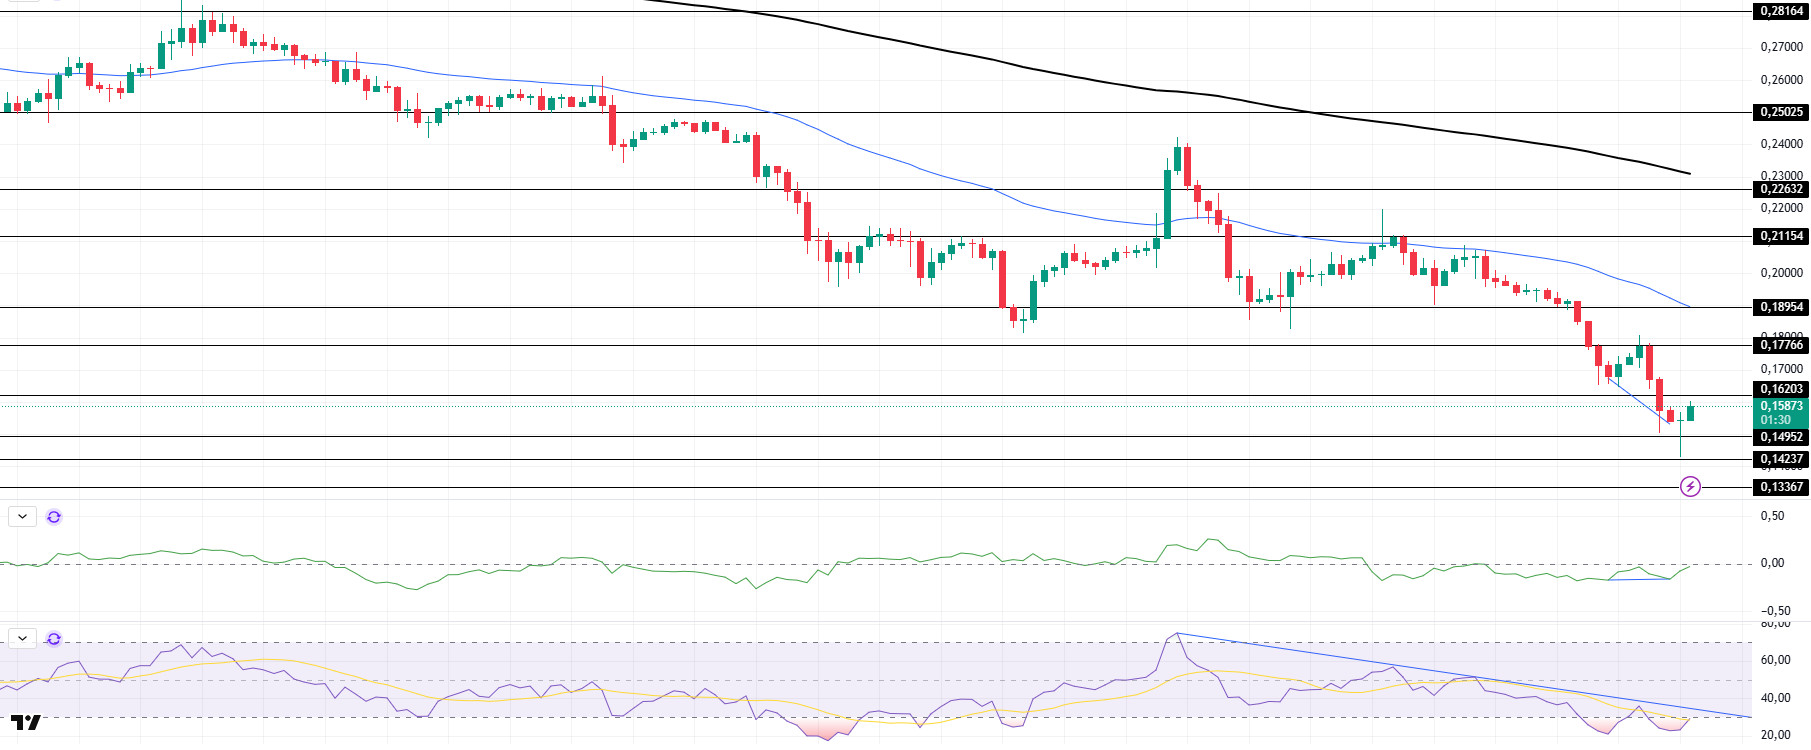
DOGE/USDT
360 million DOGES moved to a centralized exchange.
Since our analysis yesterday, DOGE has pulled back, keeping pace with the market. On the 4-hour timeframe, the 50 EMA (Blue Line) is below the 200 EMA (Black Line). This could mean that the decline could deepen in the medium term. However, the price started to hover below the two moving averages. The larger gap between the two moving averages increases the probability that DOGE will rise. The Chaikin Money Flow (CMF)20 indicator is in the neutral zone. However, the increase in daily volume may increase money inflows and cause CMF to rise. On the other hand, Relative Strength Index (RSI)14 is in the oversold zone and the RSI continues to hover below the downtrend on March 2. At the same time, there is a bullish divergence in the RSI. The $0.18954 level stands out as a very strong resistance point in the rises due to political reasons, macroeconomic data and innovations in the DOGE coin. In case of possible pullbacks due to political, macroeconomic reasons or negativities in the ecosystem, the $0.14952 level, which is the base level of the trend, is an important support. If the price reaches these support levels, a potential bullish opportunity may arise if momentum increases.
Supports 0.14952 – 0.14237 – 0.13367
Resistances 0.16203 – 0.17766 – 0.18954
LEGAL NOTICE
The investment information, comments and recommendations contained herein do not constitute investment advice. Investment advisory services are provided individually by authorized institutions taking into account the risk and return preferences of individuals. The comments and recommendations contained herein are of a general nature. These recommendations may not be suitable for your financial situation and risk and return preferences. Therefore, making an investment decision based solely on the information contained herein may not produce results in line with your expectations.

