
TECHNICAL ANALYSIS
BTC/USDT
The Fed kept interest rates unchanged while revising economic forecasts. The Federal Reserve left interest rates unchanged between 4.25%-4.50% and decided to slow down the pace of balance sheet reduction. The 2025 growth forecast was lowered from 2.1% to 1.7%, while the inflation forecast was raised from 2.5% to 2.8%. Fed Chairman Jerome Powell stated that there is no need to rush to adjust the policy stance and emphasized that they will act depending on economic data. On the other hand, according to the Fed’s dot plot, most of the officials expect a total of 50 basis points of rate cuts by the end of 2025, but some members argue that there should be no rate cuts at all.
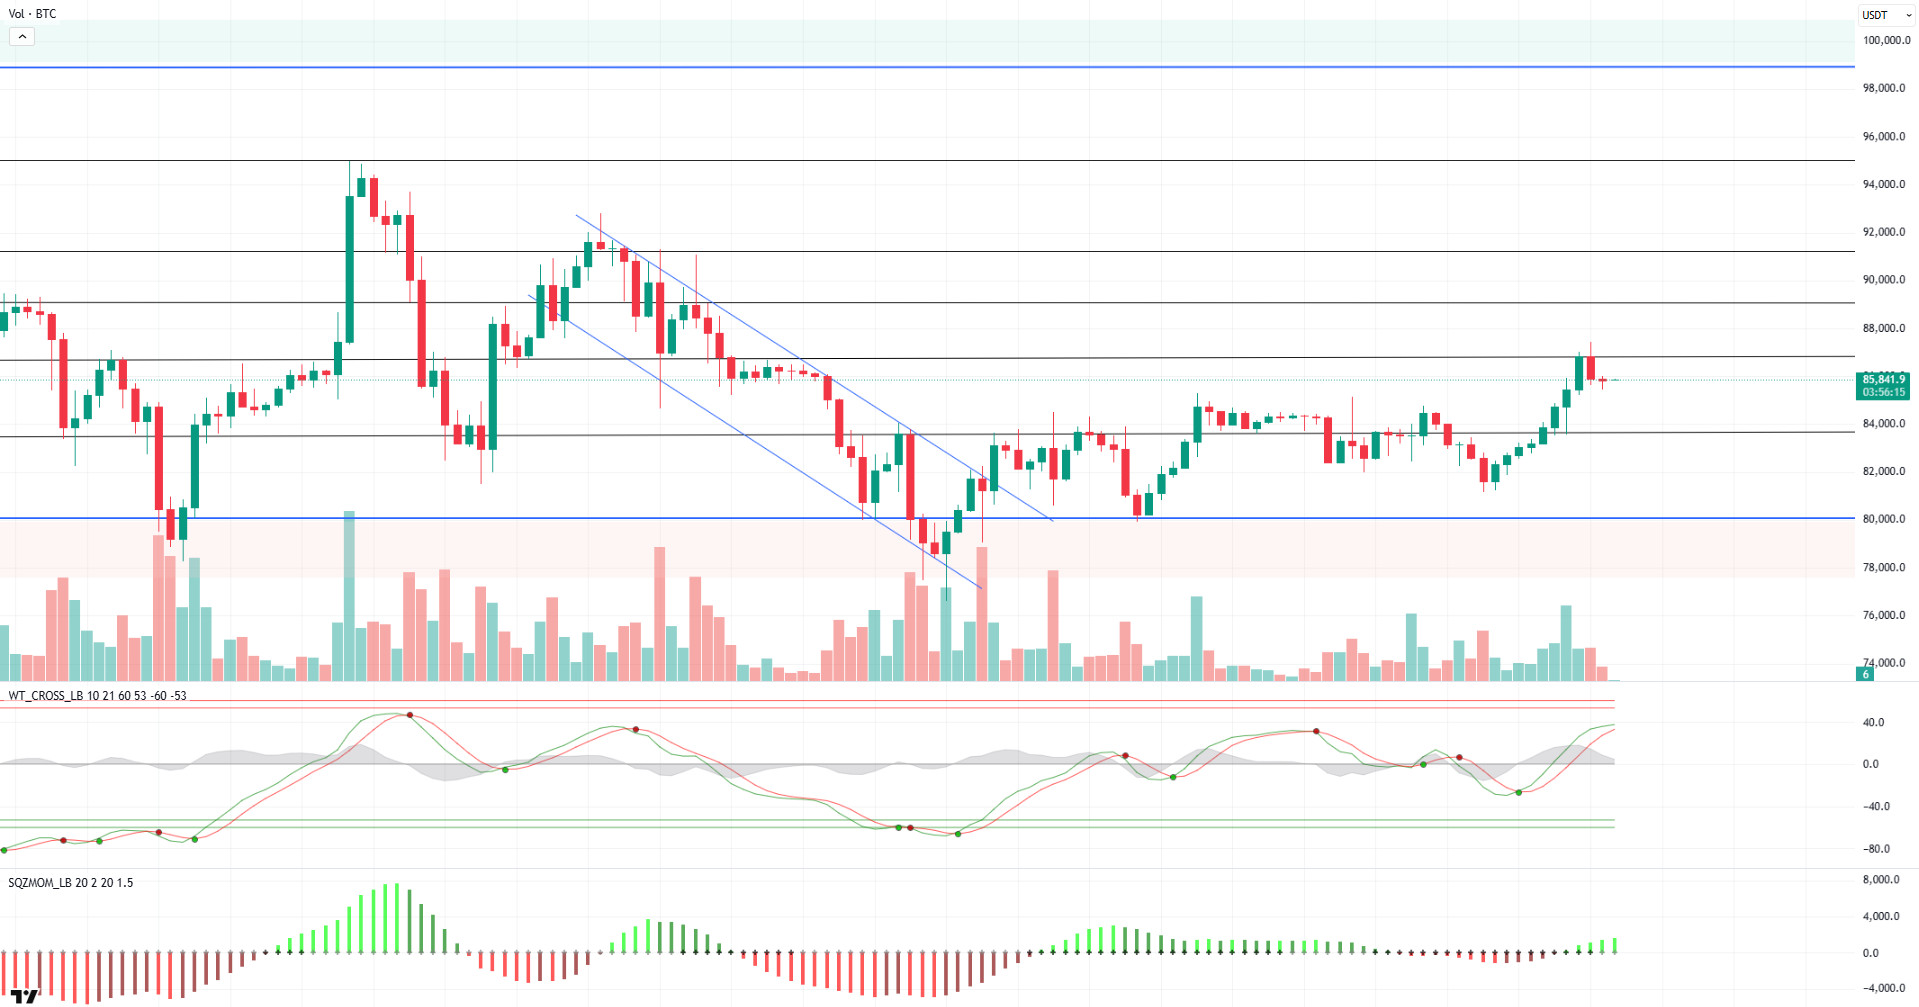
Looking at BTC’s technical outlook, the buy signal from the previous analysis and the scenario of initially targeting the accumulation of short trades above 85,000 have been realized. After breaching the 83,500-resistance level, BTC gained upside momentum and tested the 87,450 level on the 4-hour eighth candle. However, with the correction from this level, the price fell below the 86,600-support level and entered the accumulation process at 85,800. Looking at the technical indicators, the Wave Trend Oscillator maintained its buy signal, while the Squeeze Momentum indicator moved back into positive territory. On the weekly liquidation chart, it is noteworthy that short trades above 85,000 were liquidated, but the accumulation of long positions increased as the uptrend continued. If fundamentals continue to be supported by positive expectations for Trump, BTC can be expected to continue its upward movement. However, if the expected developments do not materialize, it is possible that the price will move sideways for a while and then long positions will be targeted. Periodically, while the buy signal is maintained on the hourly and 4-hour charts, it is observed that the sell signal is replaced by a neutral outlook on the daily chart. If the rise continues, exceeding the 86,600 level may bring the 89,000 level to the agenda. However, in a possible selling pressure, the 83,500 level will be followed as a support point.
Supports 83,500 – 82,400 – 80,000
Resistances 86,600 – 89,000 – 91,400
ETH/USDT
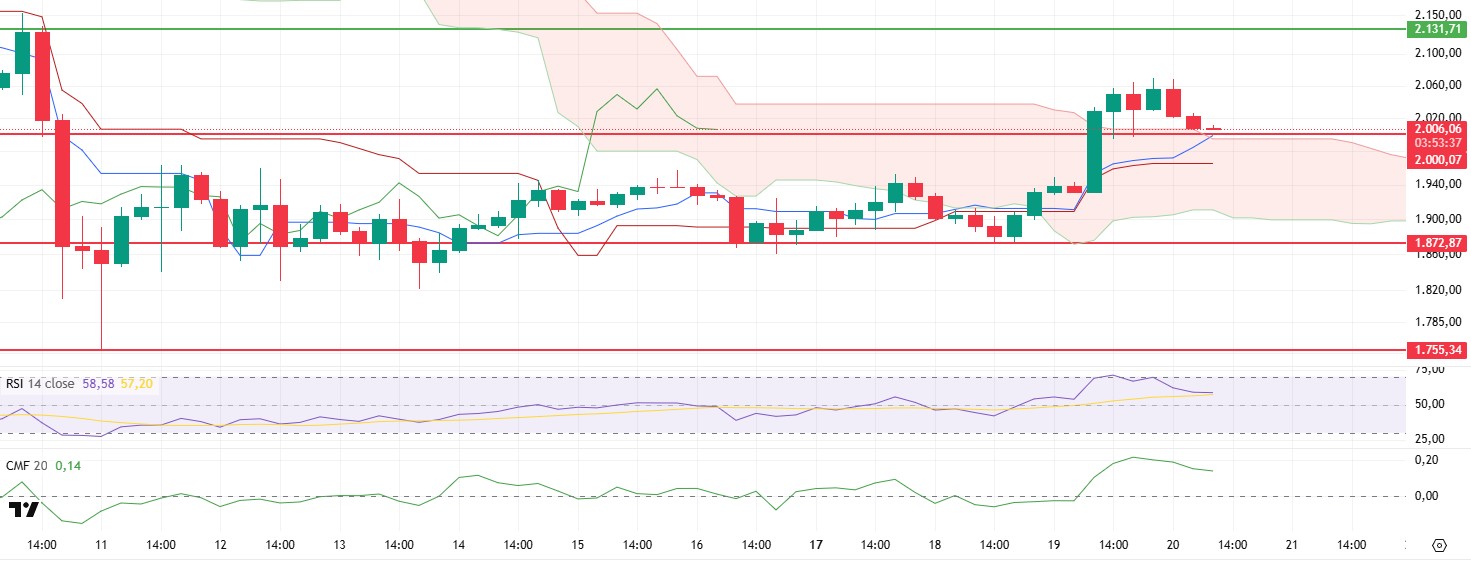
ETH surpassed a key resistance point yesterday, breaking above the $2,000 level and rising as high as $2,070 after FED Chairman Jerome Powell’s speech. However, with the selling pressure following this rise, the price retreated to the Ichimoku Kumo cloud level in the morning hours.
Technical indicators suggest that ETH’s current price action presents an overall positive outlook. The Ichimoku indicator shows a strong buy signal as the tenkan level crosses the kijun level to the upside. At the same time, the price has exceeded the boundaries of the Ichimoku cloud, indicating an uptrend. When the Relative Strength Index (RSI) indicator is analyzed, it is observed that with the reaction from the overbought zone, it made a correction above the based (MA) line, but this correction did not cause a structural breakdown and maintained its positive outlook. This suggests that momentum is still strong, and the uptrend may be maintained. Cumulative Volume Delta (CVD) indicator, on the other hand, reveals that selling pressure is evident in the spot market. Weak buying support from the spot side may be considered as a risk factor for the sustainability of the upward movement.
Overall, technical indicators are giving positive signals, and the price continues to hold above the $2,000 level, which is a strong sign that the uptrend may continue. However, insufficient spot support on the CVD side may keep the price pressured at these levels. Maintaining the $2,000 level during the day and strengthening spot purchases may accelerate the upward movement. On the other hand, if the $2,000 level is broken downwards, there is a possibility that the price may retreat to the $1,950 level. In this scenario, it should be kept in mind that the buyer’s reaction at the relevant levels can quickly come into play and enable the price to recover again.
Supports 2,000- 1,872 – 1,755
Resistances 2,131 – 2,254 – 2,512
XRP/USDT
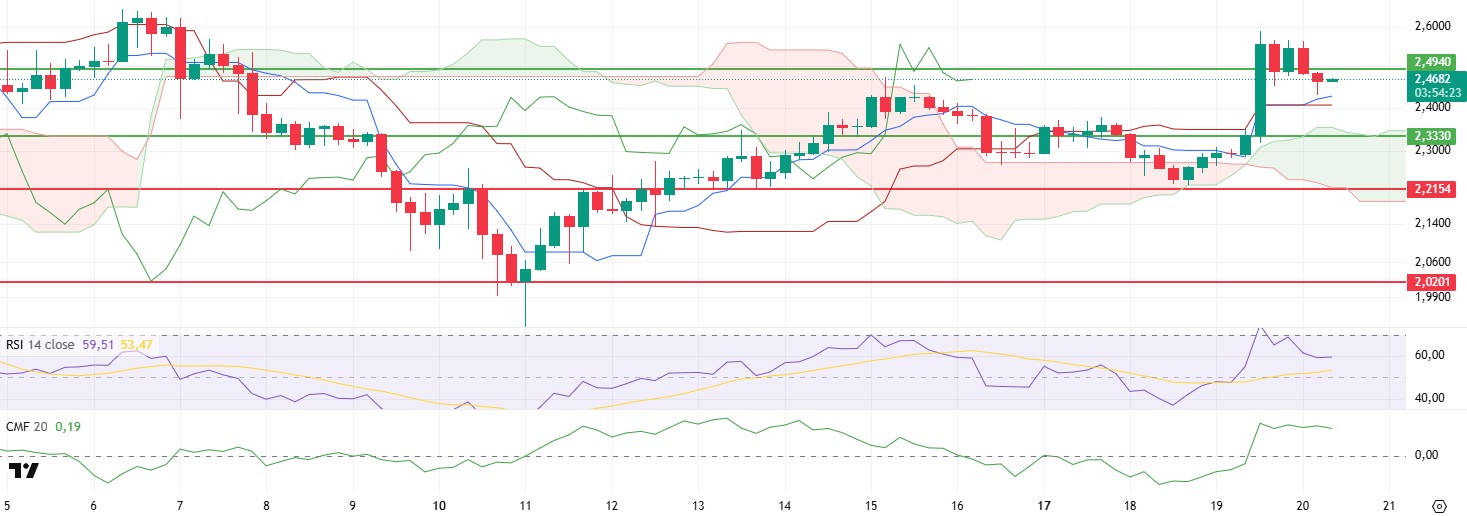
XRP retreated in the morning hours after yesterday’s rise and lost the support of $ 2.49. However, the fact that this retracement remains above the kijun and tankan levels may mean that this price movement can be considered as a correction movement.
When technical indicators are analyzed, it is seen that Chaikin Money Flow (CMF)’s rise weakened at the top regions and moved horizontally. While the price retreated, the horizontal movement of the CMF indicator indicates that there were no liquidity outflows and the price could recover quickly. At the same time, the pullback of the Relative Strength Index (RSI) indicator from the overbought zone remained above the based MA line. This suggests that the pullback could be a correction. In addition, the positive signal formed by the tenkan level rising above the kijun level on the ichimoku indicator also stands out.
As a result, the price can be expected to continue its upward movement by regaining the $ 2.49 level during the day. If the retracement continues, the $ 2.33 region is the most important support level and the price can be expected to react from this region.
Supports 2.3330 – 2.2154 – 2.0201
Resistances 2.4940 – 2.8280 – 3.2125
SOL/USDT
Volatility Shares LLC will launch the first Solana futures ETFs in the US today, trading with 2x leverage under the tickers SOLZ and SOLT. Meanwhile, Solana’s deleted ad sparked backlash, with co-founder Anatoly Yakovenko apologizing for its tone-deaf treatment of gender issues
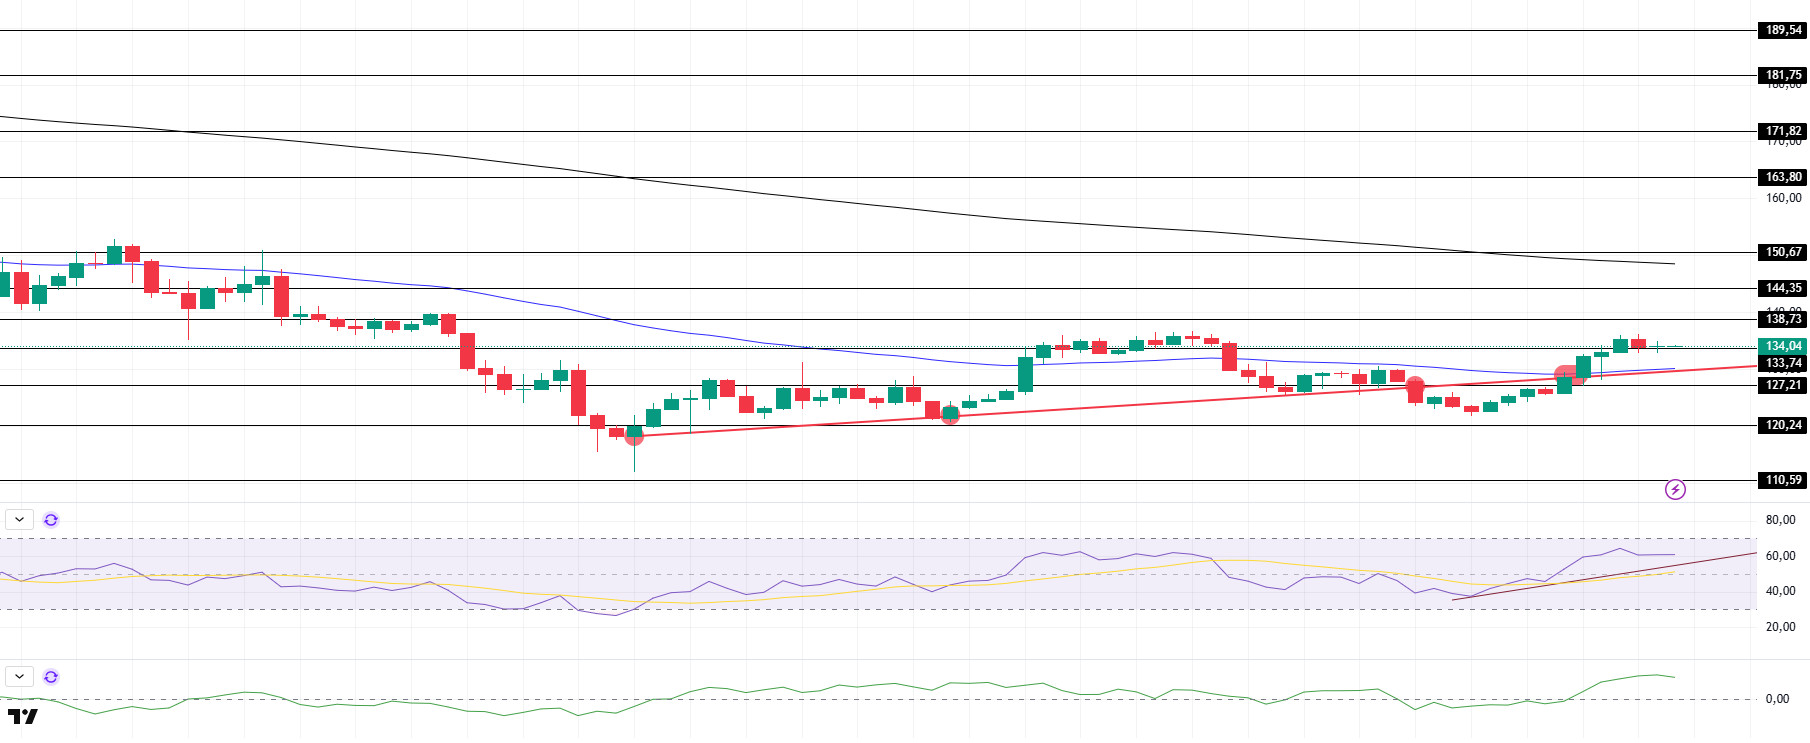
SOL has continued its uptrend since our analysis yesterday, making the strong resistance at $133.74 as support and continuing the uptrend from March 11. On the 4-hour timeframe, the 50 EMA (Blue Line) remained below the 200 EMA (Black Line). This could deepen the decline further in the medium term. At the same time, the price started to move between two moving averages. However, a large difference between the two moving averages may cause the asset to rise. When we examine the Chaikin Money Flow (CMF)20 indicator, it has moved into the positive zone. In addition, the high 24-hour volume may further increase money inflows. However, the Relative Strength Index (RSI)14 indicator crossed into positive territory and continued its uptrend on March 18. This may cause the asset to rise further. The $150.67 level stands out as a very strong resistance point in the rises driven by both the upcoming macroeconomic data and the news in the Solana ecosystem. If it breaks here, the rise may continue. In case of retracements for the opposite reasons or due to profit sales, the support level of $ 127.21 can be triggered. If the price comes to these support levels, a potential bullish opportunity may arise if momentum increases.
Supports 133.74 – 127.21 – 120.24
Resistances 138.73 – 144.35 – 150.67
DOGE/USDT
House of Doge, the Dogecoin Foundation, IndyCar driver DeFrancesco and Rahal Letterman Lanigan Racing launched the Dogecoin Indy 500 voting and donation platform, allowing fans to make Doge history and win the ultimate collector’s prize.
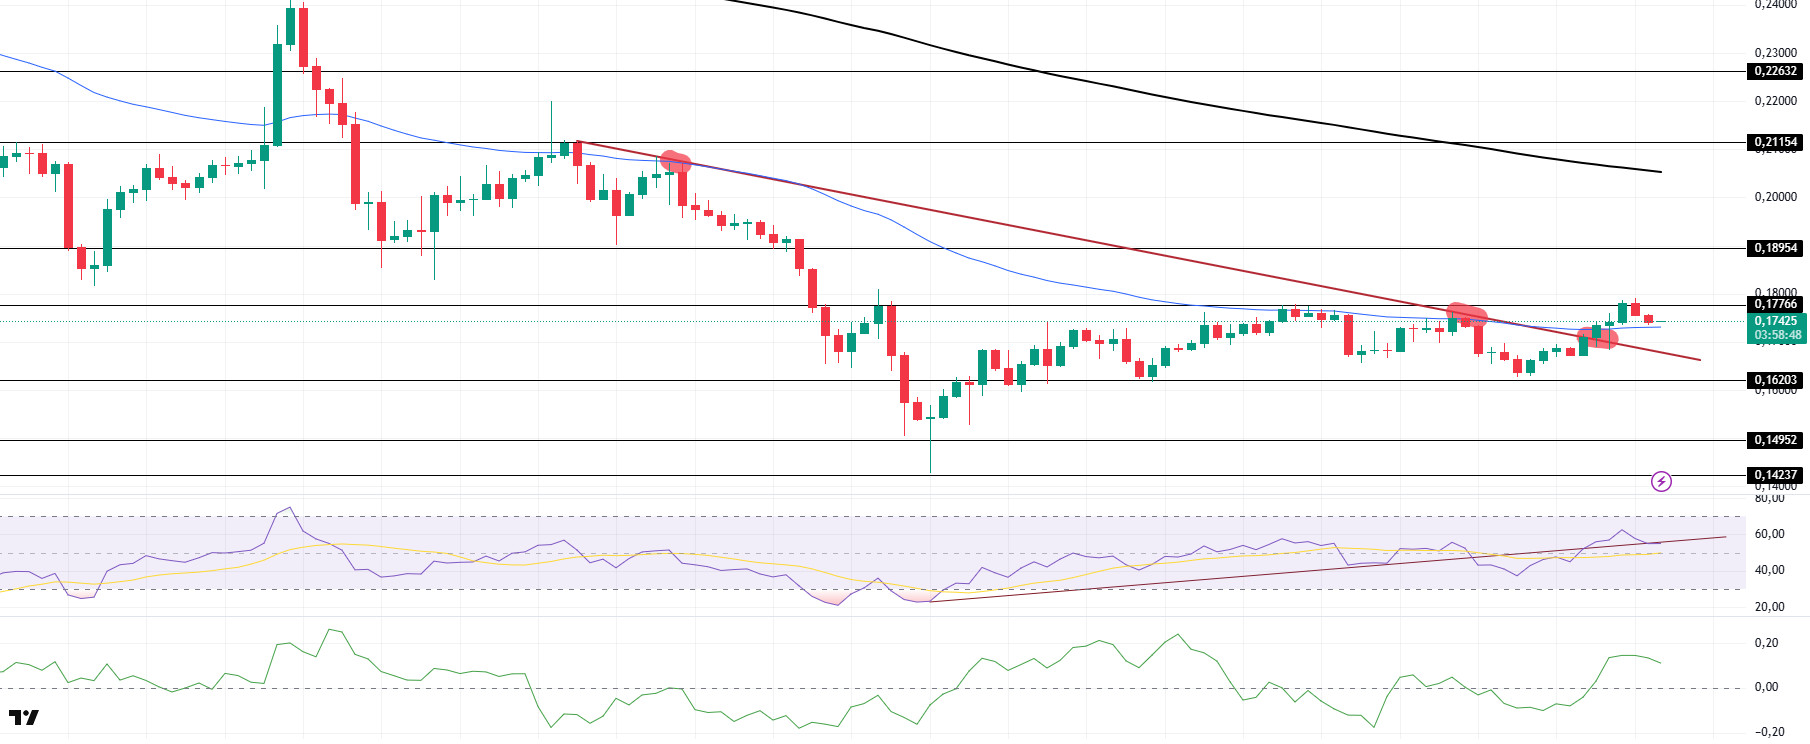
DOGE has continued its uptrend since our analysis yesterday. Although the asset failed to break the downtrend it has been in since March 6 despite testing it twice before, it failed to break the strong resistance at 0.17766 and retreated slightly. It is currently running the 50 EMA (Blue Line) moving average as support. On the 4-hour timeframe, the 50 EMA (Blue Line) is below the 200 EMA (Black Line). This could mean that the decline could deepen in the medium term. However, the price has started to price between two moving averages. In addition, the larger gap between the two moving averages increases the probability that DOGE will rise. When we analyze the Chaikin Money Flow (CMF)20 indicator, it is in positive territory. In addition, the fact that the 24-hour volume is on the plus side may increase inflows and cause CMF to rise further. On the other hand, Relative Strength Index (RSI)14 has moved into positive territory. However, it has managed to climb back above the uptrend on March 11 and is currently testing this as support. The $0.18954 level stands out as a very strong resistance point in the rises driven by political reasons, macroeconomic data and innovations in the DOGE coin. In case of possible pullbacks due to political, macroeconomic reasons or negativities in the ecosystem, the $0.14952 level, which is the base level of the trend, is an important support. If the price reaches these support levels, a potential bullish opportunity may arise if momentum increases.
Supports 0.16203 – 0.14952 – 0.14237
Resistances 0.17766 – 0.18954 – 0.21154
LEGAL NOTICE
The investment information, comments and recommendations contained herein do not constitute investment advice. Investment advisory services are provided individually by authorized institutions taking into account the risk and return preferences of individuals. The comments and recommendations contained herein are of a general nature. These recommendations may not be suitable for your financial situation and risk and return preferences. Therefore, making an investment decision based solely on the information contained herein may not produce results in line with your expectations.
