
TECHNICAL ANALYSIS
BTC/USDT
In his speech at the Blockworks Digital Asset Summit, US President Donald Trump called on Congress to create common sense rules for stablecoins and market structure. On the other hand, Japan-based Metaplanet announced the appointment of Trump’s second son Eric Trump as a member of its strategic advisory board.
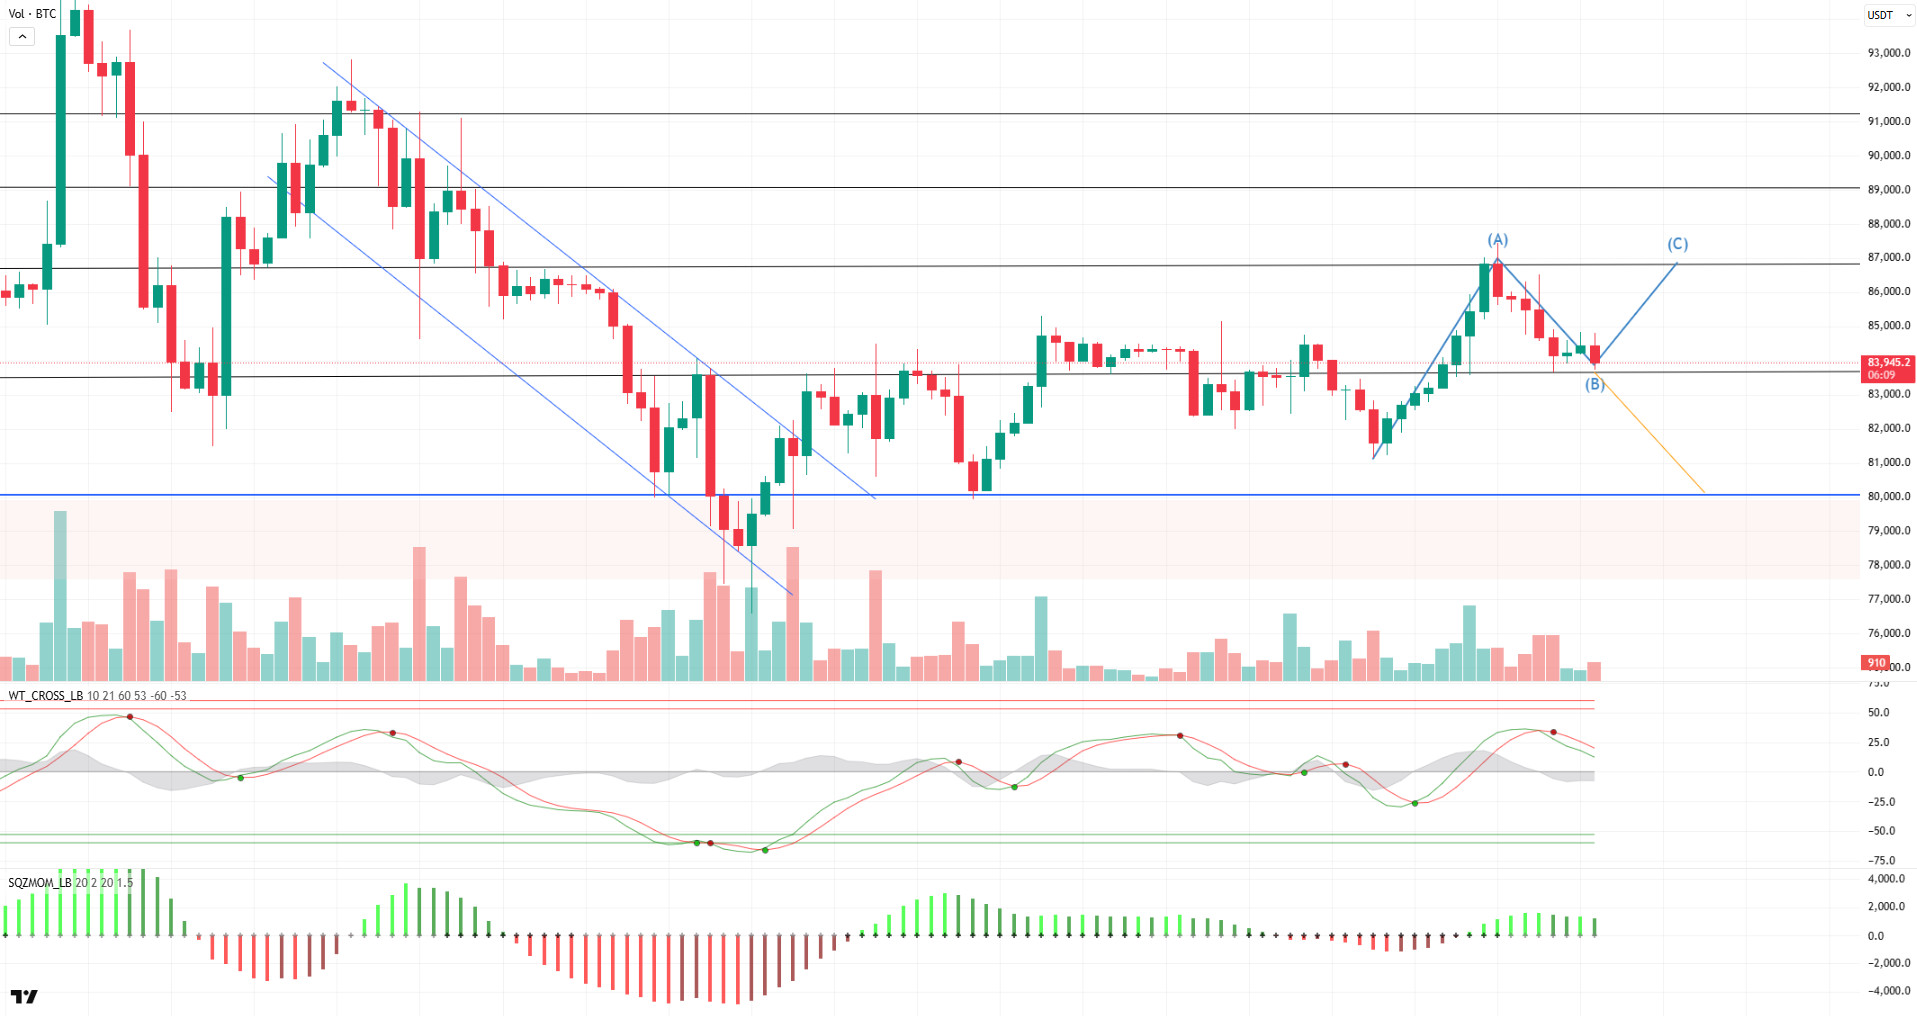
When we look at the technical outlook of BTC, it is seen that yesterday’s fundamental developments did not meet expectations, causing the price to turn down again and erase some of its post-Fed gains. As of now, BTC is trading at $83,900, above the $83,500 support level. Looking at the weekly liquidation chart, long trades above the $80,000 level continue to attract attention, while limited short trades continue to put downward pressure on the price. This increases the probability that the price will move according to the liquidation zones. The Wave Trend Oscillator maintains its sell signal, while momentum indicators have been weak for the past month, reflecting the uncertainty in the market. On the hourly charts, StochRSI (14) and MACD (12.26) give a sell signal, while the 4-hour charts are neutral. In terms of moving averages, the MA (10.20) on the 4-hour charts gives a sell signal in the short term, while the MA (50) maintains a buy signal in the medium term. A break of the $83,500 level may deepen the selling pressure as the price loses momentum and liquidation data shows a downward trend. On the other hand, the possibility of the price forming an ABC pattern will be monitored if it receives support from this level.
Supports 83,500 – 82,400 – 80,000
Resistances 86,600 – 89,000 – 91,400
ETH/USDT
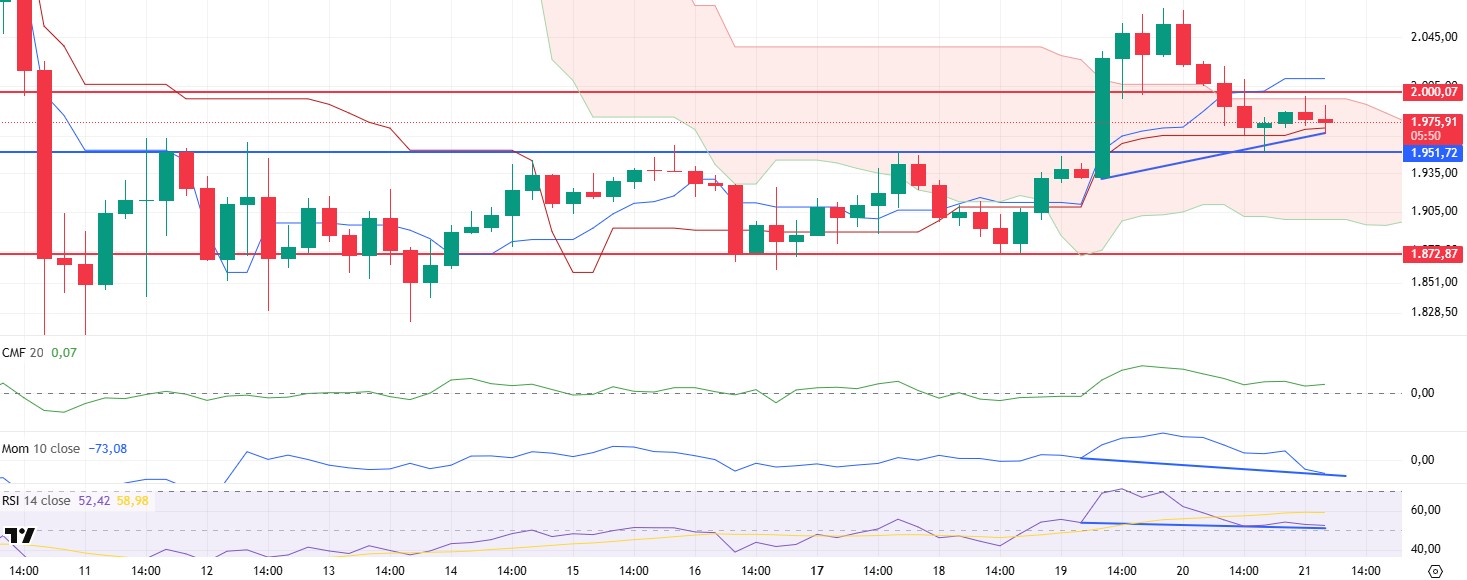
ETH fell yesterday evening as US President Donald Trump’s speech at the Digital Asset Summit and US markets turned slightly negative. With this decline, ETH, which sagged below the $2,000 level with this decline, started to rise slightly by pinning the $1,951 level, one of the most important support levels, but fell back to the $1,970 region with the sales that came in the night hours.
In technical indicators, the weakness in the ichimoku cloud attracts attention. The price lost support at the tankan level and the kumo cloud and retreated to the kijun support, presenting a negative picture. However, despite this, the Chaikin Money Flow (CMF) indicator remained in the positive area and did not turn bearish, indicating that buyers dominate the market and liquidity outflows are too small to violate the support point. Another noteworthy factor is the positive divergence in momentum and Relative Strength Index (RSI) indicators. Provided that the price does not violate the zones between $1,951 and $1,930, these positive divergences can be expected to regain the $2,000 level.
In summary, even though the price has lost the psychological support level of $2,000, it can be expected to rise during the day as it remains above the $1,951 support zone and some positive signals are formed in technical indicators. With the $2,000 level gained, it seems likely that this expected bullish movement will continue. However, the closures of the price below the $1,951 zone may bring a decline with sharp movements.
Supports 1,951 – 1,872 – 1,755
Resistances 2,000 – 2,131 – 2,254
XRP/USDT
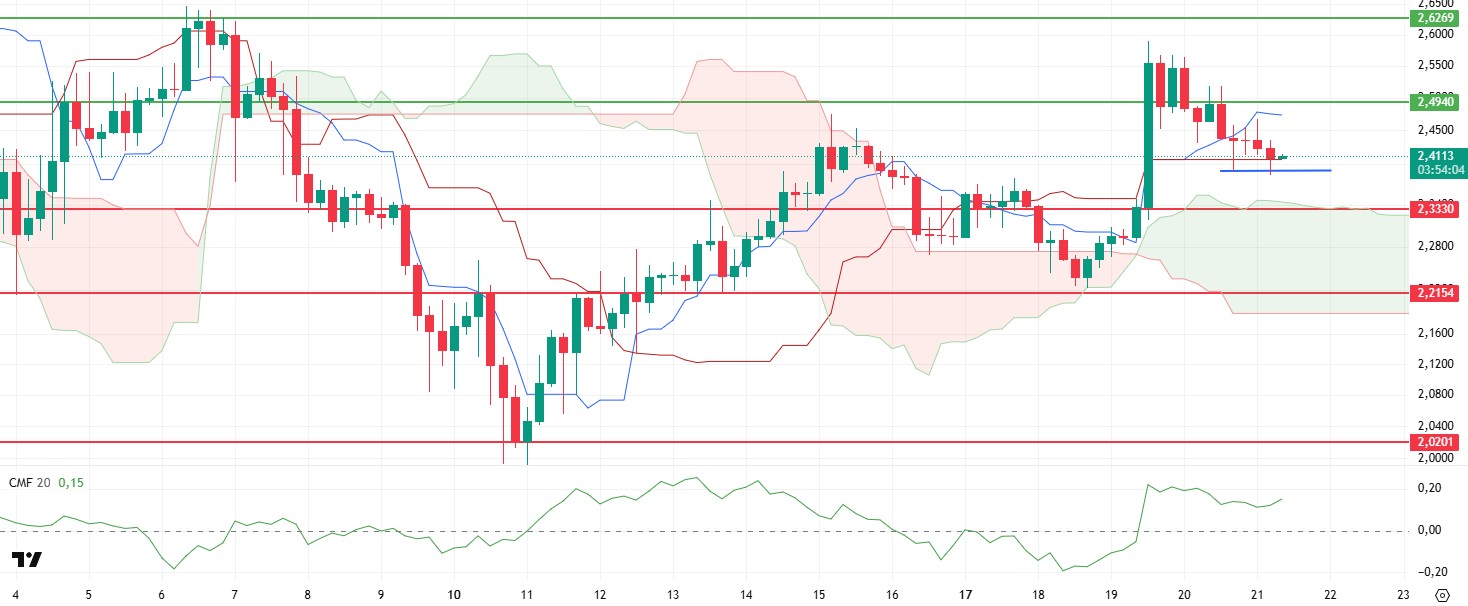
XRP reacted to the decline in the US markets and the crypto market yesterday and could not hold above the $2.49 level and fell slightly to the kijun level. Technical indicators for XRP, which has risen slightly by finding support from this region, generally seem to maintain their upward trend.
First of all, Chaikin Money Flow (CMF) indicator remained unaffected by the decline and moved horizontally, indicating that there were no liquidity outflows and buyers were strong. On the spot side of the Cumulative Volume Delta (CVD), buying continues to be strong. The decline in the funding rate also shows that this downward movement is mostly coming from the futures side. In addition, the formation of a Swing Failure Pattern (SFP) structure with the last four-hour close indicates that the upward movement may start.
As a result, although there is pressure on the price, the fact that this pressure is not spot-side and comes from the futures side contributes to the positive outlook and shows that the price may continue its upward movements. With the regain of the $2.49 level, the upward movement may continue more sharply. In possible pullbacks, it seems likely to react from the $2.33 level.
Supports 2.3330 – 2.2154 – 2.0201
Resistances 2.4940 – 2.8280 – 3.2125
SOL/USDT
Trezor, the original hardware wallet company, brought Solana (SOL) staking to its cryptocurrency management application Trezor Suite. Pump.fun announced the launch of PumpSwap, its native DEX using a fixed product automated market maker.
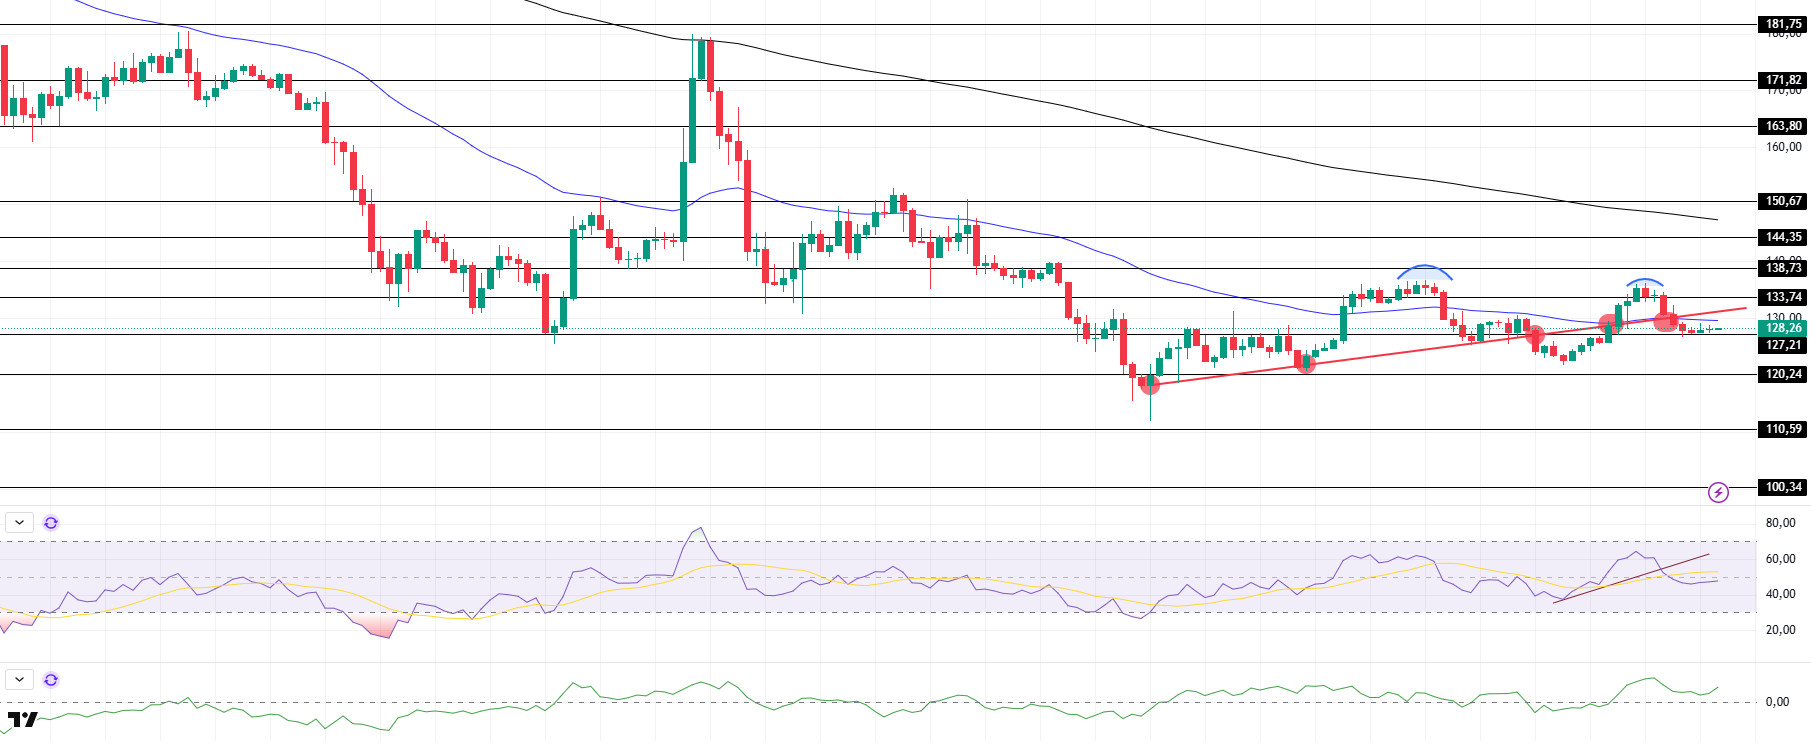
SOL has turned bearish since our analysis yesterday and is back below the March 11 uptrend and is currently testing the 50 EMA (Blue Line) as resistance. On the 4-hour timeframe, the 50 EMA (Blue Line) remained below the 200 EMA (Black Line). This could deepen the decline further in the medium term. At the same time, the price is moving below the two moving averages again. However, a large gap between the two moving averages may cause the asset to rise. When we analyze the Chaikin Money Flow (CMF)20 indicator, it is in positive territory, but low daily volume may reduce inflows and move CMF into negative territory. However, the Relative Strength Index (RSI)14 indicator moved into negative territory, indicating that selling pressure continued. In addition, it broke the uptrend on March 18 to the downside. This may cause the asset to fall further. On the other hand, the double top pattern should be taken into consideration. The $150.67 level is a very strong resistance point in the rises driven by both the upcoming macroeconomic data and the news in the Solana ecosystem. If it breaks here, the rise may continue . In case of retracements for the opposite reasons or due to profit sales, the support level of $ 120.24 can be triggered. If the price reaches these support levels, a potential bullish opportunity may arise if momentum increases.
Supports 127.21 – 120.24 – 110.59
Resistances 133.74 – 138.73 – 144.35
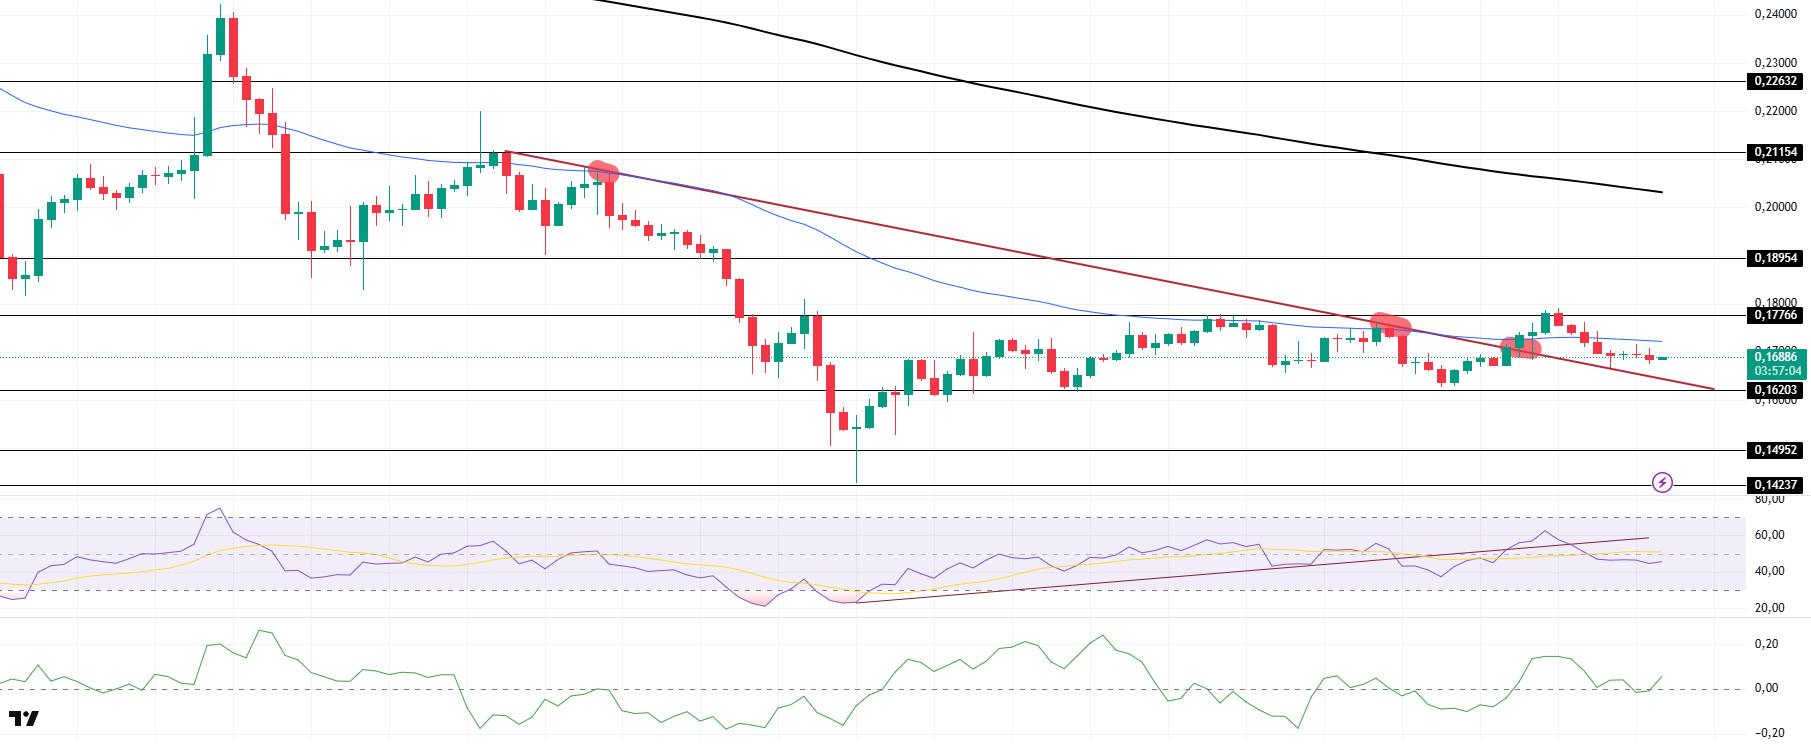
DOGE/USDT
DOGE has continued to retreat since our analysis this morning. Although the asset has failed to break the downtrend it has been in since March 6 despite testing it twice before, it broke it on yesterday’s uptrend, but it fell again at the strong resistance at 0.17766 and is positioned below the downtrend. On the 4-hour timeframe, the 50 EMA (Blue Line) is below the 200 EMA (Black Line). This could mean that the decline could deepen in the medium term. However, the price started to price below two moving averages. In addition, the difference between the two moving averages is large, which increases the probability that DOGE will rise. When we analyze the Chaikin Money Flow (CMF)20 indicator, it is in the neutral zone. In addition, the negative 24-hour volume may reduce money inflows and cause CMF to fall. On the other hand, Relative Strength Index (RSI)14 has moved into negative territory. However, it started to position below the uptrend on March 11 again. This may deepen the decline. The $0.18954 level stands out as a very strong resistance point in the rises due to political reasons, macroeconomic data and innovations in the DOGE coin. In case of possible pullbacks due to political, macroeconomic reasons or negativities in the ecosystem, the $0.14952 level, which is the base level of the trend, is an important support. If the price reaches these support levels, a potential bullish opportunity may arise if momentum increases.
Supports 0.16203 – 0.14952 – 0.14237
Resistances 0.17766 – 0.18954 – 0.21154
LEGAL NOTICE
The investment information, comments and recommendations contained herein do not constitute investment advice. Investment advisory services are provided individually by authorized institutions taking into account the risk and return preferences of individuals. The comments and recommendations contained herein are of a general nature. These recommendations may not be suitable for your financial situation and risk and return preferences. Therefore, making an investment decision based solely on the information contained herein may not produce results in line with your expectations.
